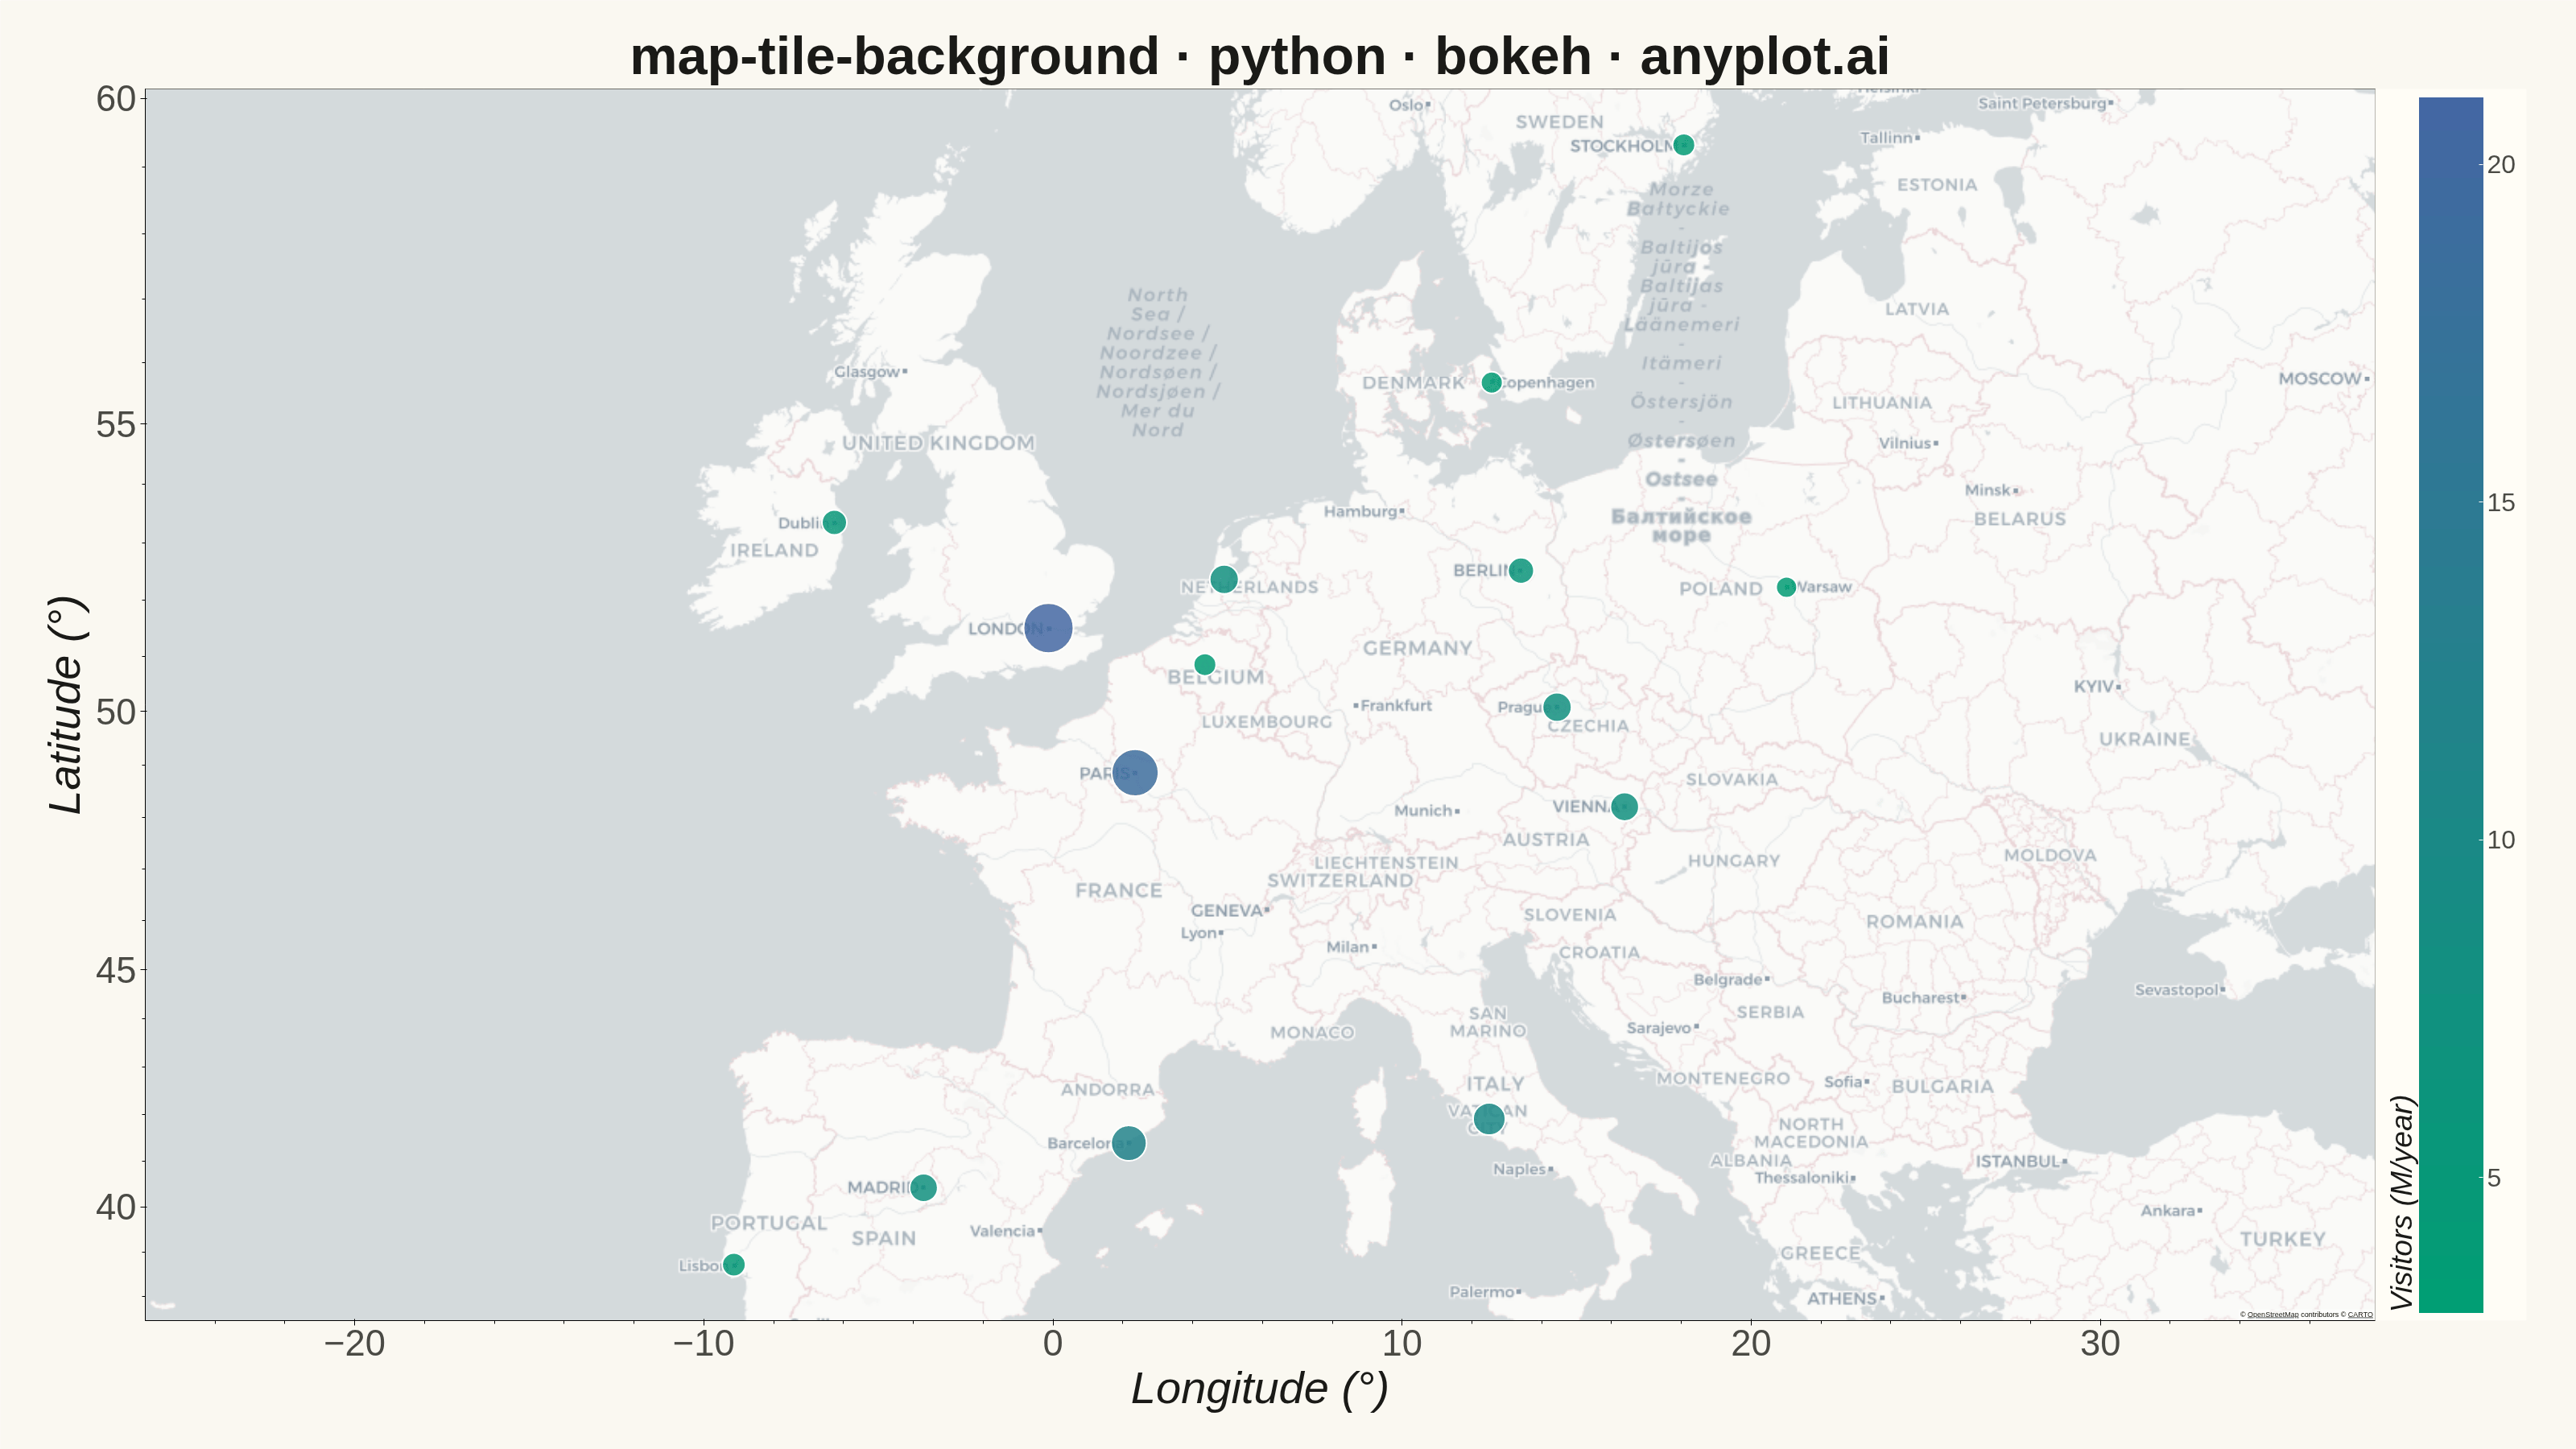
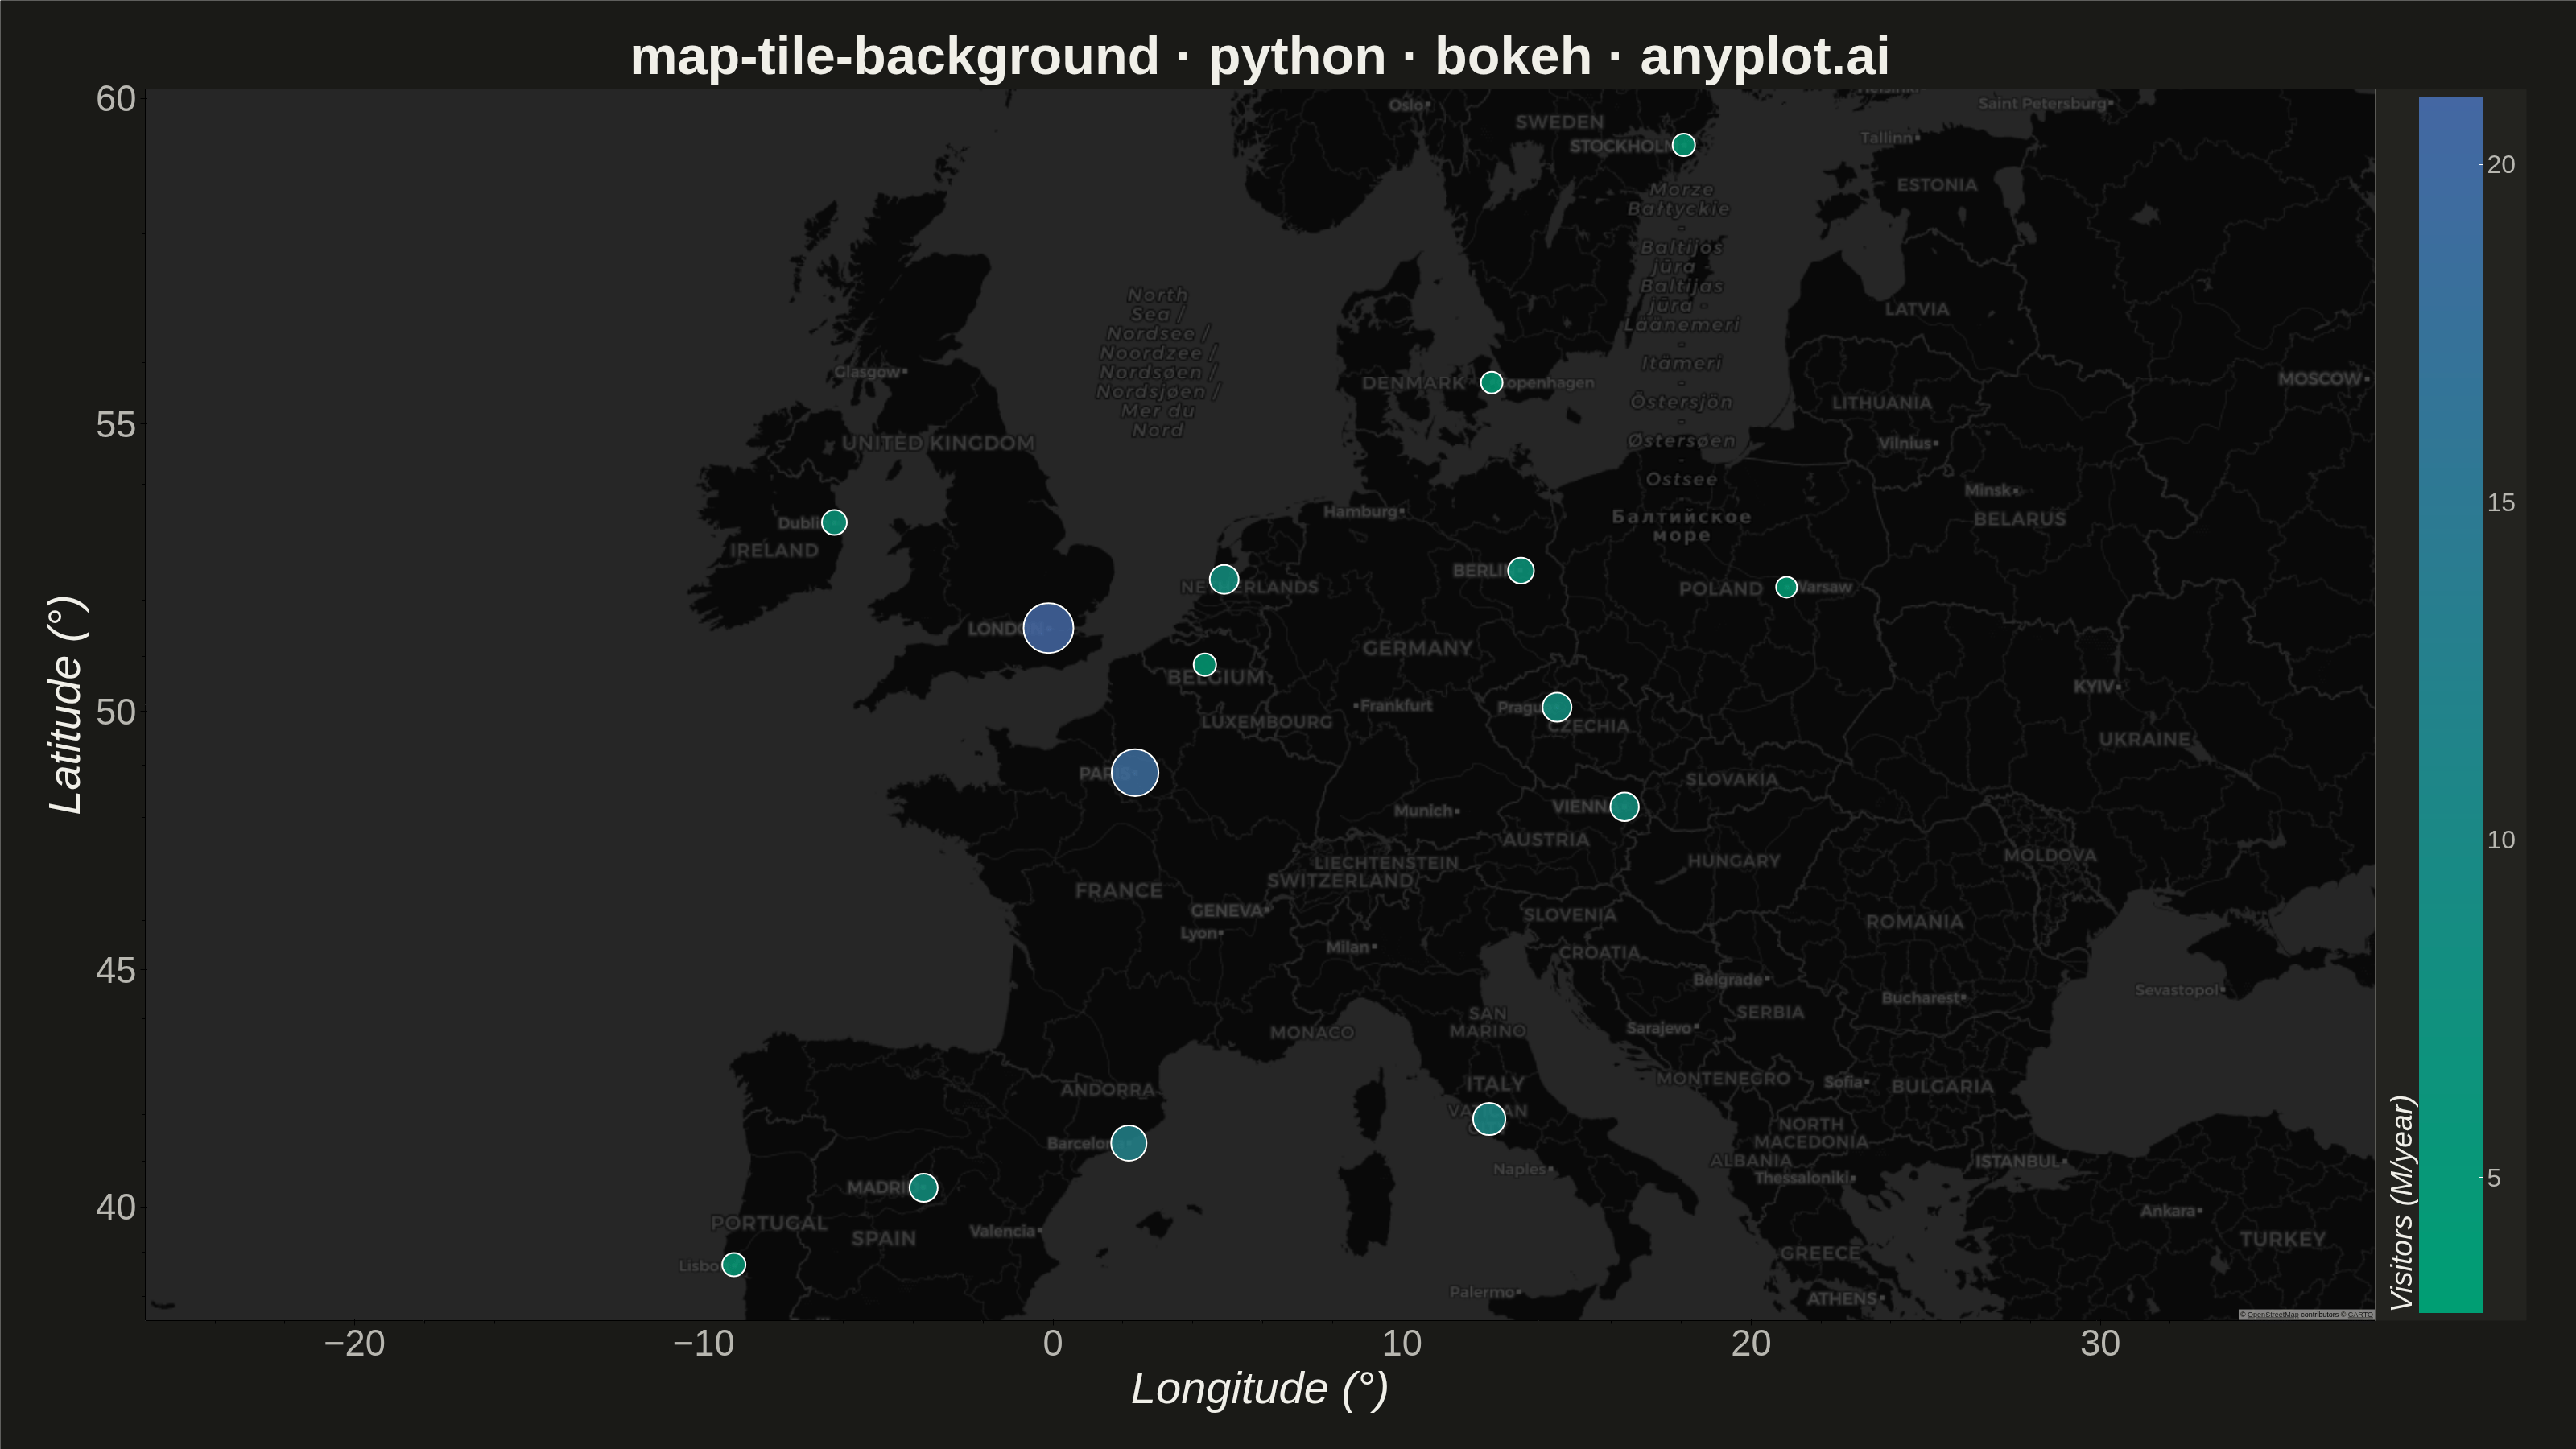
A map visualization that displays data points on top of tile-based backgrounds such as OpenStreetMap, Stamen, or satellite imagery. Unlike vector-based basemaps, tile backgrounds provide rich geographic context including street-level detail, terrain, or satellite imagery that loads dynamically as the user navigates. This visualization is essential for location-based analysis where real-world geographic context enhances data interpretation.
""" anyplot.ai
map-tile-background: Map with Tile Background
Library: bokeh 3.9.0 | Python 3.13.13
Quality: 90/100 | Updated: 2026-05-27
"""

import os
import sys


# bokeh.py shadows the installed bokeh package — remove script dir from sys.path
_here = os.path.abspath(os.path.dirname(__file__))
sys.path = [p for p in sys.path if os.path.abspath(p or ".") != _here]

import time
from pathlib import Path

import numpy as np
import xyzservices.providers as xyz
from bokeh.io import output_file, save
from bokeh.models import ColorBar, ColumnDataSource, HoverTool, LinearColorMapper
from bokeh.plotting import figure
from selenium import webdriver
from selenium.webdriver.chrome.options import Options


THEME = os.getenv("ANYPLOT_THEME", "light")
PAGE_BG = "#FAF8F1" if THEME == "light" else "#1A1A17"
ELEVATED_BG = "#FFFDF6" if THEME == "light" else "#242420"
INK = "#1A1A17" if THEME == "light" else "#F0EFE8"
INK_SOFT = "#4A4A44" if THEME == "light" else "#B8B7B0"

# Data: European capital cities with annual visitor counts (millions)
cities = {
    "Paris": (2.3522, 48.8566),
    "London": (-0.1276, 51.5074),
    "Rome": (12.4964, 41.9028),
    "Barcelona": (2.1734, 41.3851),
    "Amsterdam": (4.9041, 52.3676),
    "Berlin": (13.4050, 52.5200),
    "Prague": (14.4378, 50.0755),
    "Vienna": (16.3738, 48.2082),
    "Madrid": (-3.7038, 40.4168),
    "Lisbon": (-9.1393, 38.7223),
    "Brussels": (4.3517, 50.8503),
    "Dublin": (-6.2603, 53.3498),
    "Copenhagen": (12.5683, 55.6761),
    "Stockholm": (18.0686, 59.3293),
    "Warsaw": (21.0122, 52.2297),
}

names = list(cities.keys())
lons = np.array([cities[c][0] for c in names])
lats = np.array([cities[c][1] for c in names])
visitors = np.array([19.1, 21.0, 10.1, 12.0, 8.0, 6.1, 8.0, 7.7, 7.5, 4.5, 4.0, 5.5, 3.5, 4.0, 3.0])

# Web Mercator projection (required for tile maps)
k = 6378137
x_merc = lons * (k * np.pi / 180.0)
y_merc = np.log(np.tan((90 + lats) * np.pi / 360.0)) * k

source = ColumnDataSource(
    data={
        "x": x_merc,
        "y": y_merc,
        "lon": lons,
        "lat": lats,
        "name": names,
        "visitors": visitors,
        "size": visitors * 2.0 + 20,
    }
)

# imprint_seq colormap: #009E73 (brand green) → #4467A3 (blue)
ANYPLOT_SEQ256 = [
    "#{:02X}{:02X}{:02X}".format(
        int(round(0 + 68 * t / 255)), int(round(158 - 55 * t / 255)), int(round(115 + 48 * t / 255))
    )
    for t in range(256)
]
color_mapper = LinearColorMapper(palette=ANYPLOT_SEQ256, low=visitors.min(), high=visitors.max())

tile_provider = xyz.CartoDB.Positron if THEME == "light" else xyz.CartoDB.DarkMatter

title = "map-tile-background · python · bokeh · anyplot.ai"
n = len(title)
title_pt = max(34, round(50 * 67 / n)) if n > 67 else 50

p = figure(
    width=3200,
    height=1800,
    x_axis_type="mercator",
    y_axis_type="mercator",
    title=title,
    tools="pan,wheel_zoom,box_zoom,reset",
    active_scroll="wheel_zoom",
    toolbar_location=None,
    min_border_bottom=160,
    min_border_left=180,
    min_border_top=110,
    min_border_right=250,
)

p.add_tile(tile_provider)

p.scatter(
    "x",
    "y",
    source=source,
    size="size",
    fill_color={"field": "visitors", "transform": color_mapper},
    fill_alpha=0.85,
    line_color="white",
    line_width=2,
)

color_bar = ColorBar(
    color_mapper=color_mapper,
    title="Visitors (M/year)",
    title_text_font_size="28pt",
    title_text_color=INK,
    major_label_text_font_size="24pt",
    major_label_text_color=INK_SOFT,
    background_fill_color=ELEVATED_BG,
    width=80,
)
p.add_layout(color_bar, "right")

hover = HoverTool(
    tooltips=[("City", "@name"), ("Visitors", "@visitors{0.0}M/year"), ("Location", "@lat{0.00}°N, @lon{0.00}°E")]
)
p.add_tools(hover)

p.title.text_font_size = f"{title_pt}pt"
p.title.align = "center"
p.title.text_color = INK

p.xaxis.axis_label = "Longitude (°)"
p.yaxis.axis_label = "Latitude (°)"
p.xaxis.axis_label_text_font_size = "42pt"
p.yaxis.axis_label_text_font_size = "42pt"
p.xaxis.axis_label_text_color = INK
p.yaxis.axis_label_text_color = INK
p.xaxis.major_label_text_font_size = "34pt"
p.yaxis.major_label_text_font_size = "34pt"
p.xaxis.major_label_text_color = INK_SOFT
p.yaxis.major_label_text_color = INK_SOFT

p.xgrid.grid_line_color = None
p.ygrid.grid_line_color = None

p.background_fill_color = PAGE_BG
p.border_fill_color = PAGE_BG
p.outline_line_color = INK_SOFT

output_file(f"plot-{THEME}.html")
save(p)

W, H = 3200, 1800
opts = Options()
for arg in (
    "--headless=new",
    "--no-sandbox",
    "--disable-dev-shm-usage",
    "--disable-gpu",
    f"--window-size={W},{H}",
    "--hide-scrollbars",
):
    opts.add_argument(arg)
driver = webdriver.Chrome(options=opts)
driver.execute_cdp_cmd(
    "Emulation.setDeviceMetricsOverride", {"width": W, "height": H, "deviceScaleFactor": 1, "mobile": False}
)
driver.get(f"file://{Path(f'plot-{THEME}.html').resolve()}")
time.sleep(3)
driver.save_screenshot(f"plot-{THEME}.png")
driver.quit()
Runnable source as JSON, for any HTTP client: https://api.anyplot.ai/specs/map-tile-background/bokeh/code. Any spec id and library id listed in llms-full.txt fit the same URL shape; every URL below is complete and callable.
{
  "spec_id": "map-tile-background",
  "language": "python",
  "library": "bokeh",
  "page": "https://anyplot.ai/map-tile-background/python/bokeh",
  "hub": "https://anyplot.ai/map-tile-background",
  "code_json": "https://api.anyplot.ai/specs/map-tile-background/bokeh/code",
  "spec_json": "https://api.anyplot.ai/specs/map-tile-background",
  "render_light_png": "https://storage.googleapis.com/anyplot-images/plots/map-tile-background/python/bokeh/plot-light.png",
  "render_dark_png": "https://storage.googleapis.com/anyplot-images/plots/map-tile-background/python/bokeh/plot-dark.png",
  "interactive_light_html": "https://storage.googleapis.com/anyplot-images/plots/map-tile-background/python/bokeh/plot-light.html",
  "interactive_dark_html": "https://storage.googleapis.com/anyplot-images/plots/map-tile-background/python/bokeh/plot-dark.html",
  "quality_score": 90.0,
  "license": "MIT",
  "guide": "https://anyplot.ai/llms.txt"
}
Part of Map with Tile Background on anyplot.ai.