The same plot in 14 other libraries — JavaScript: D3.js, Apache ECharts, Highcharts, MUI X Charts; Python: Altair, Bokeh, lets-plot, Matplotlib, Plotly, plotnine, Pygal, Seaborn; R: ggplot2; Julia: Makie.jl. Compare all 15 side by side: Force-Directed Graph in Python, R, Julia and JavaScript.
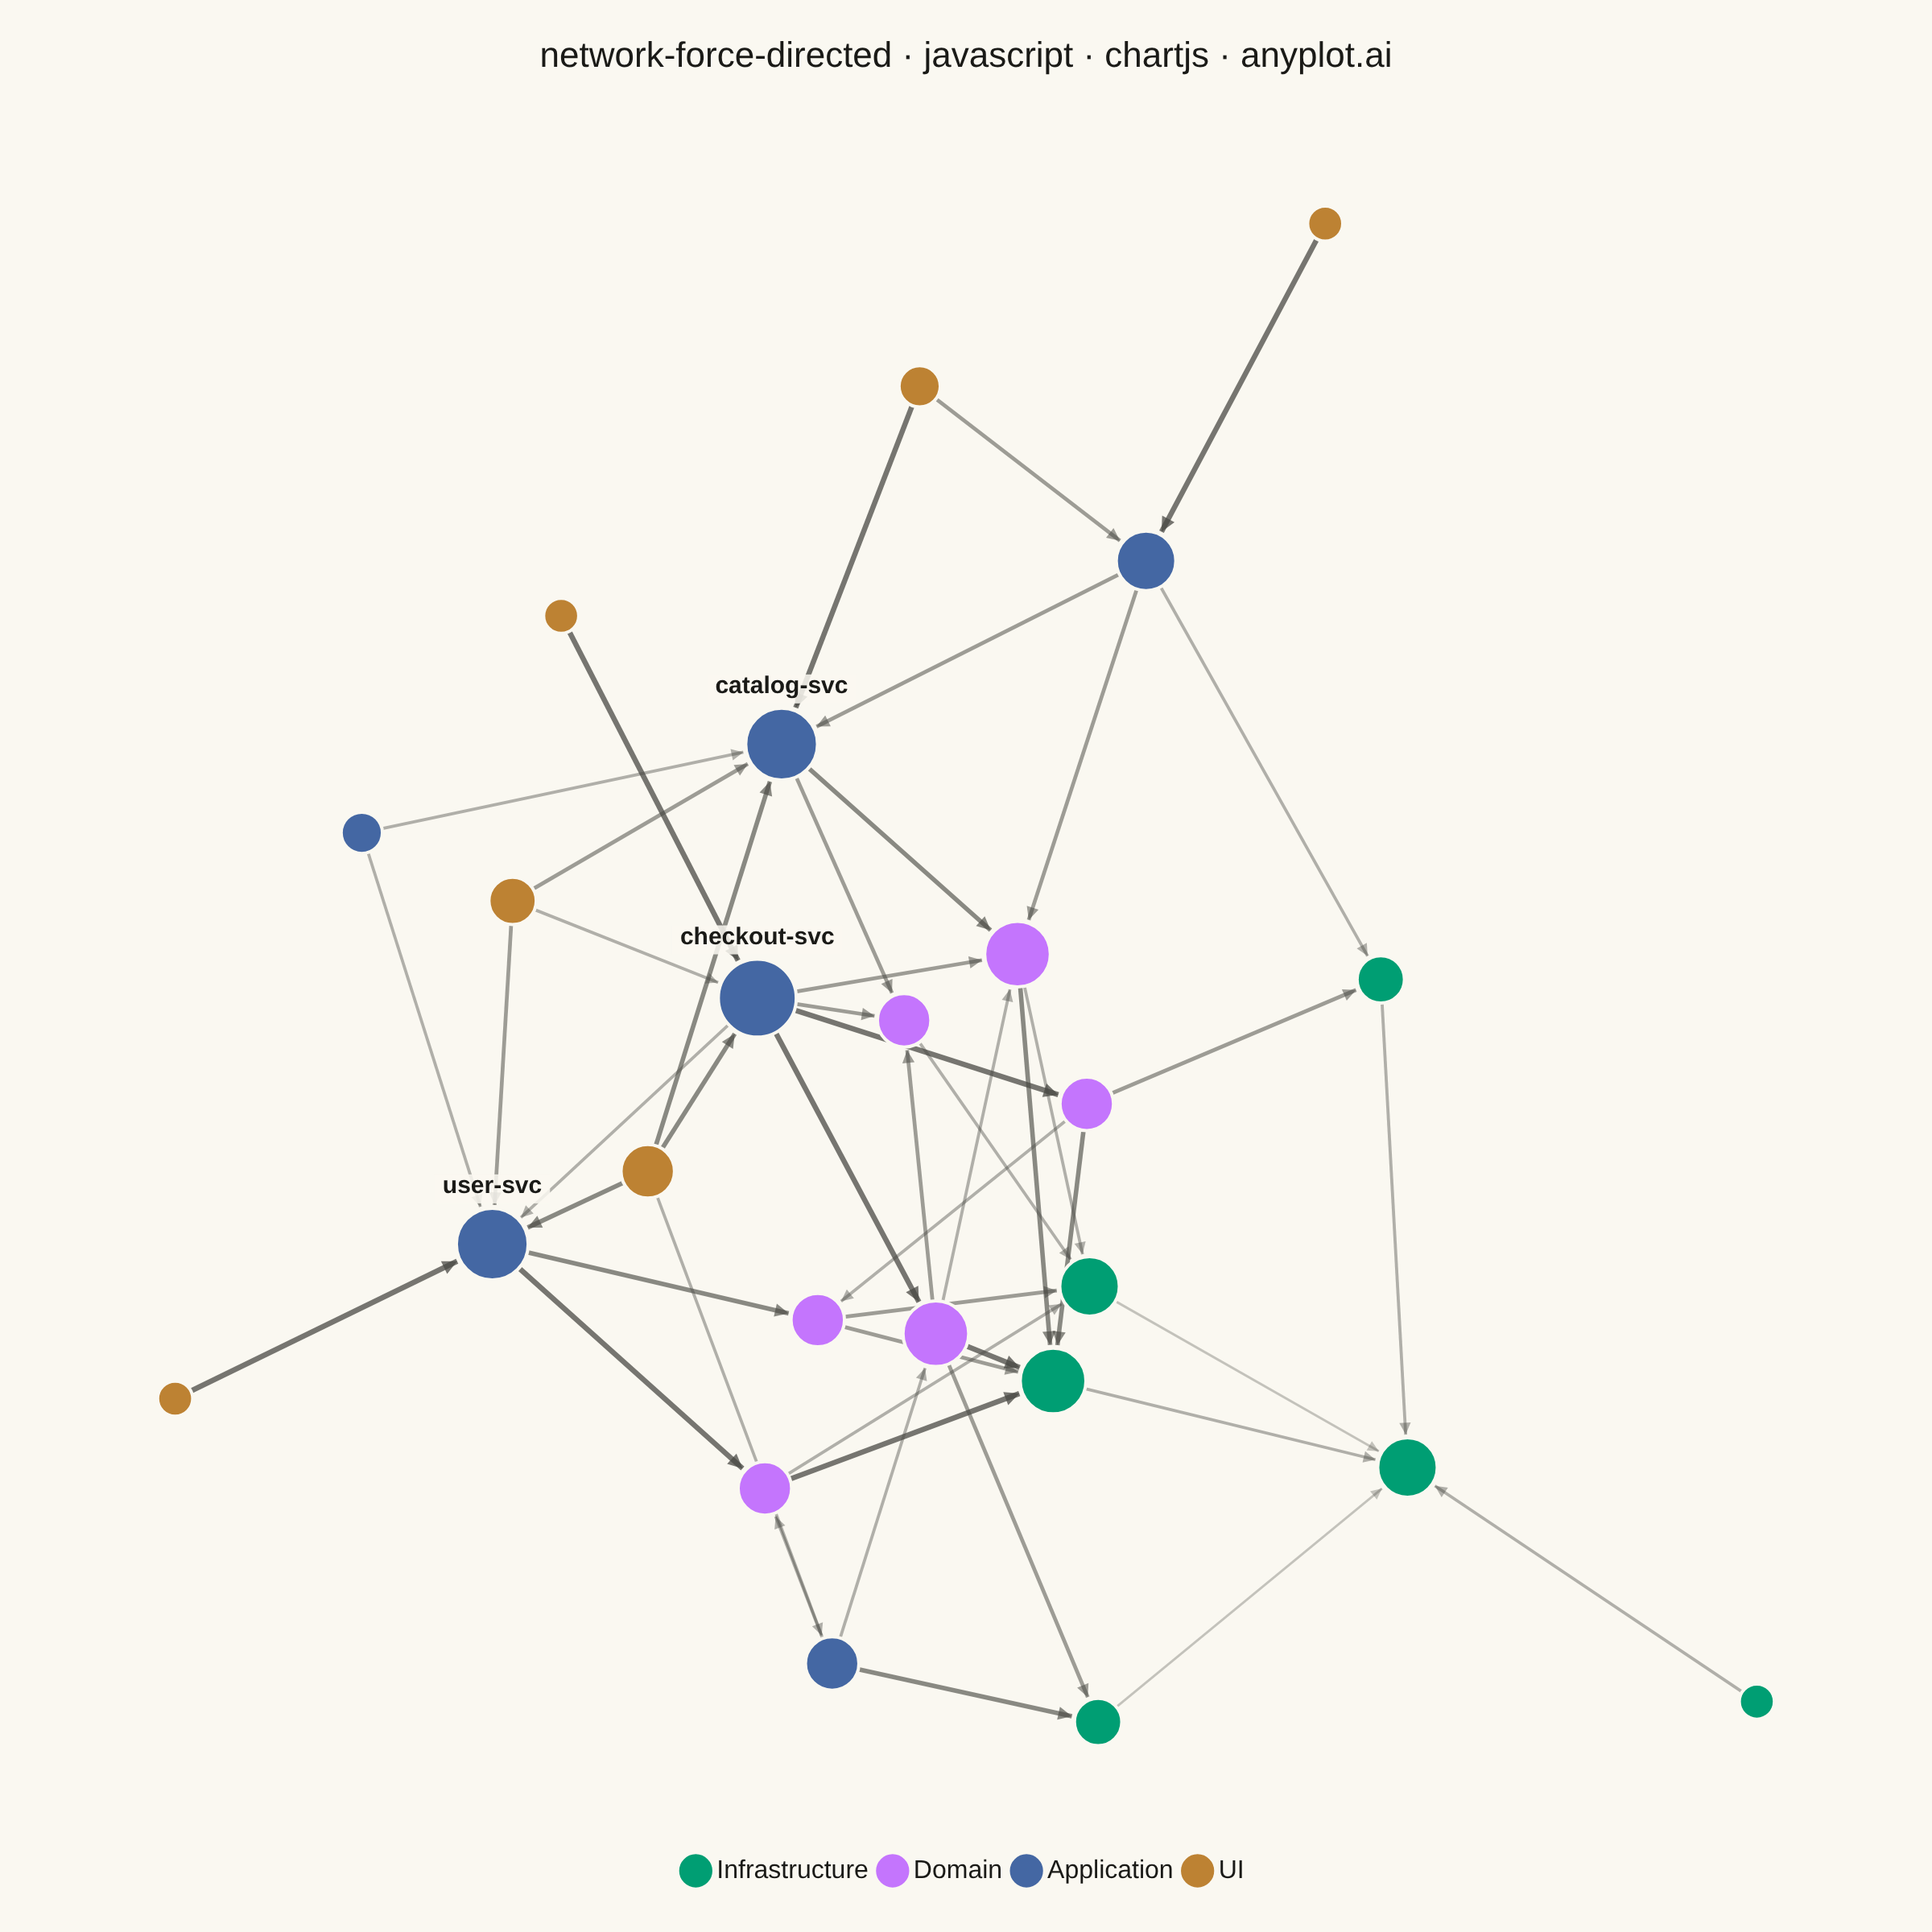
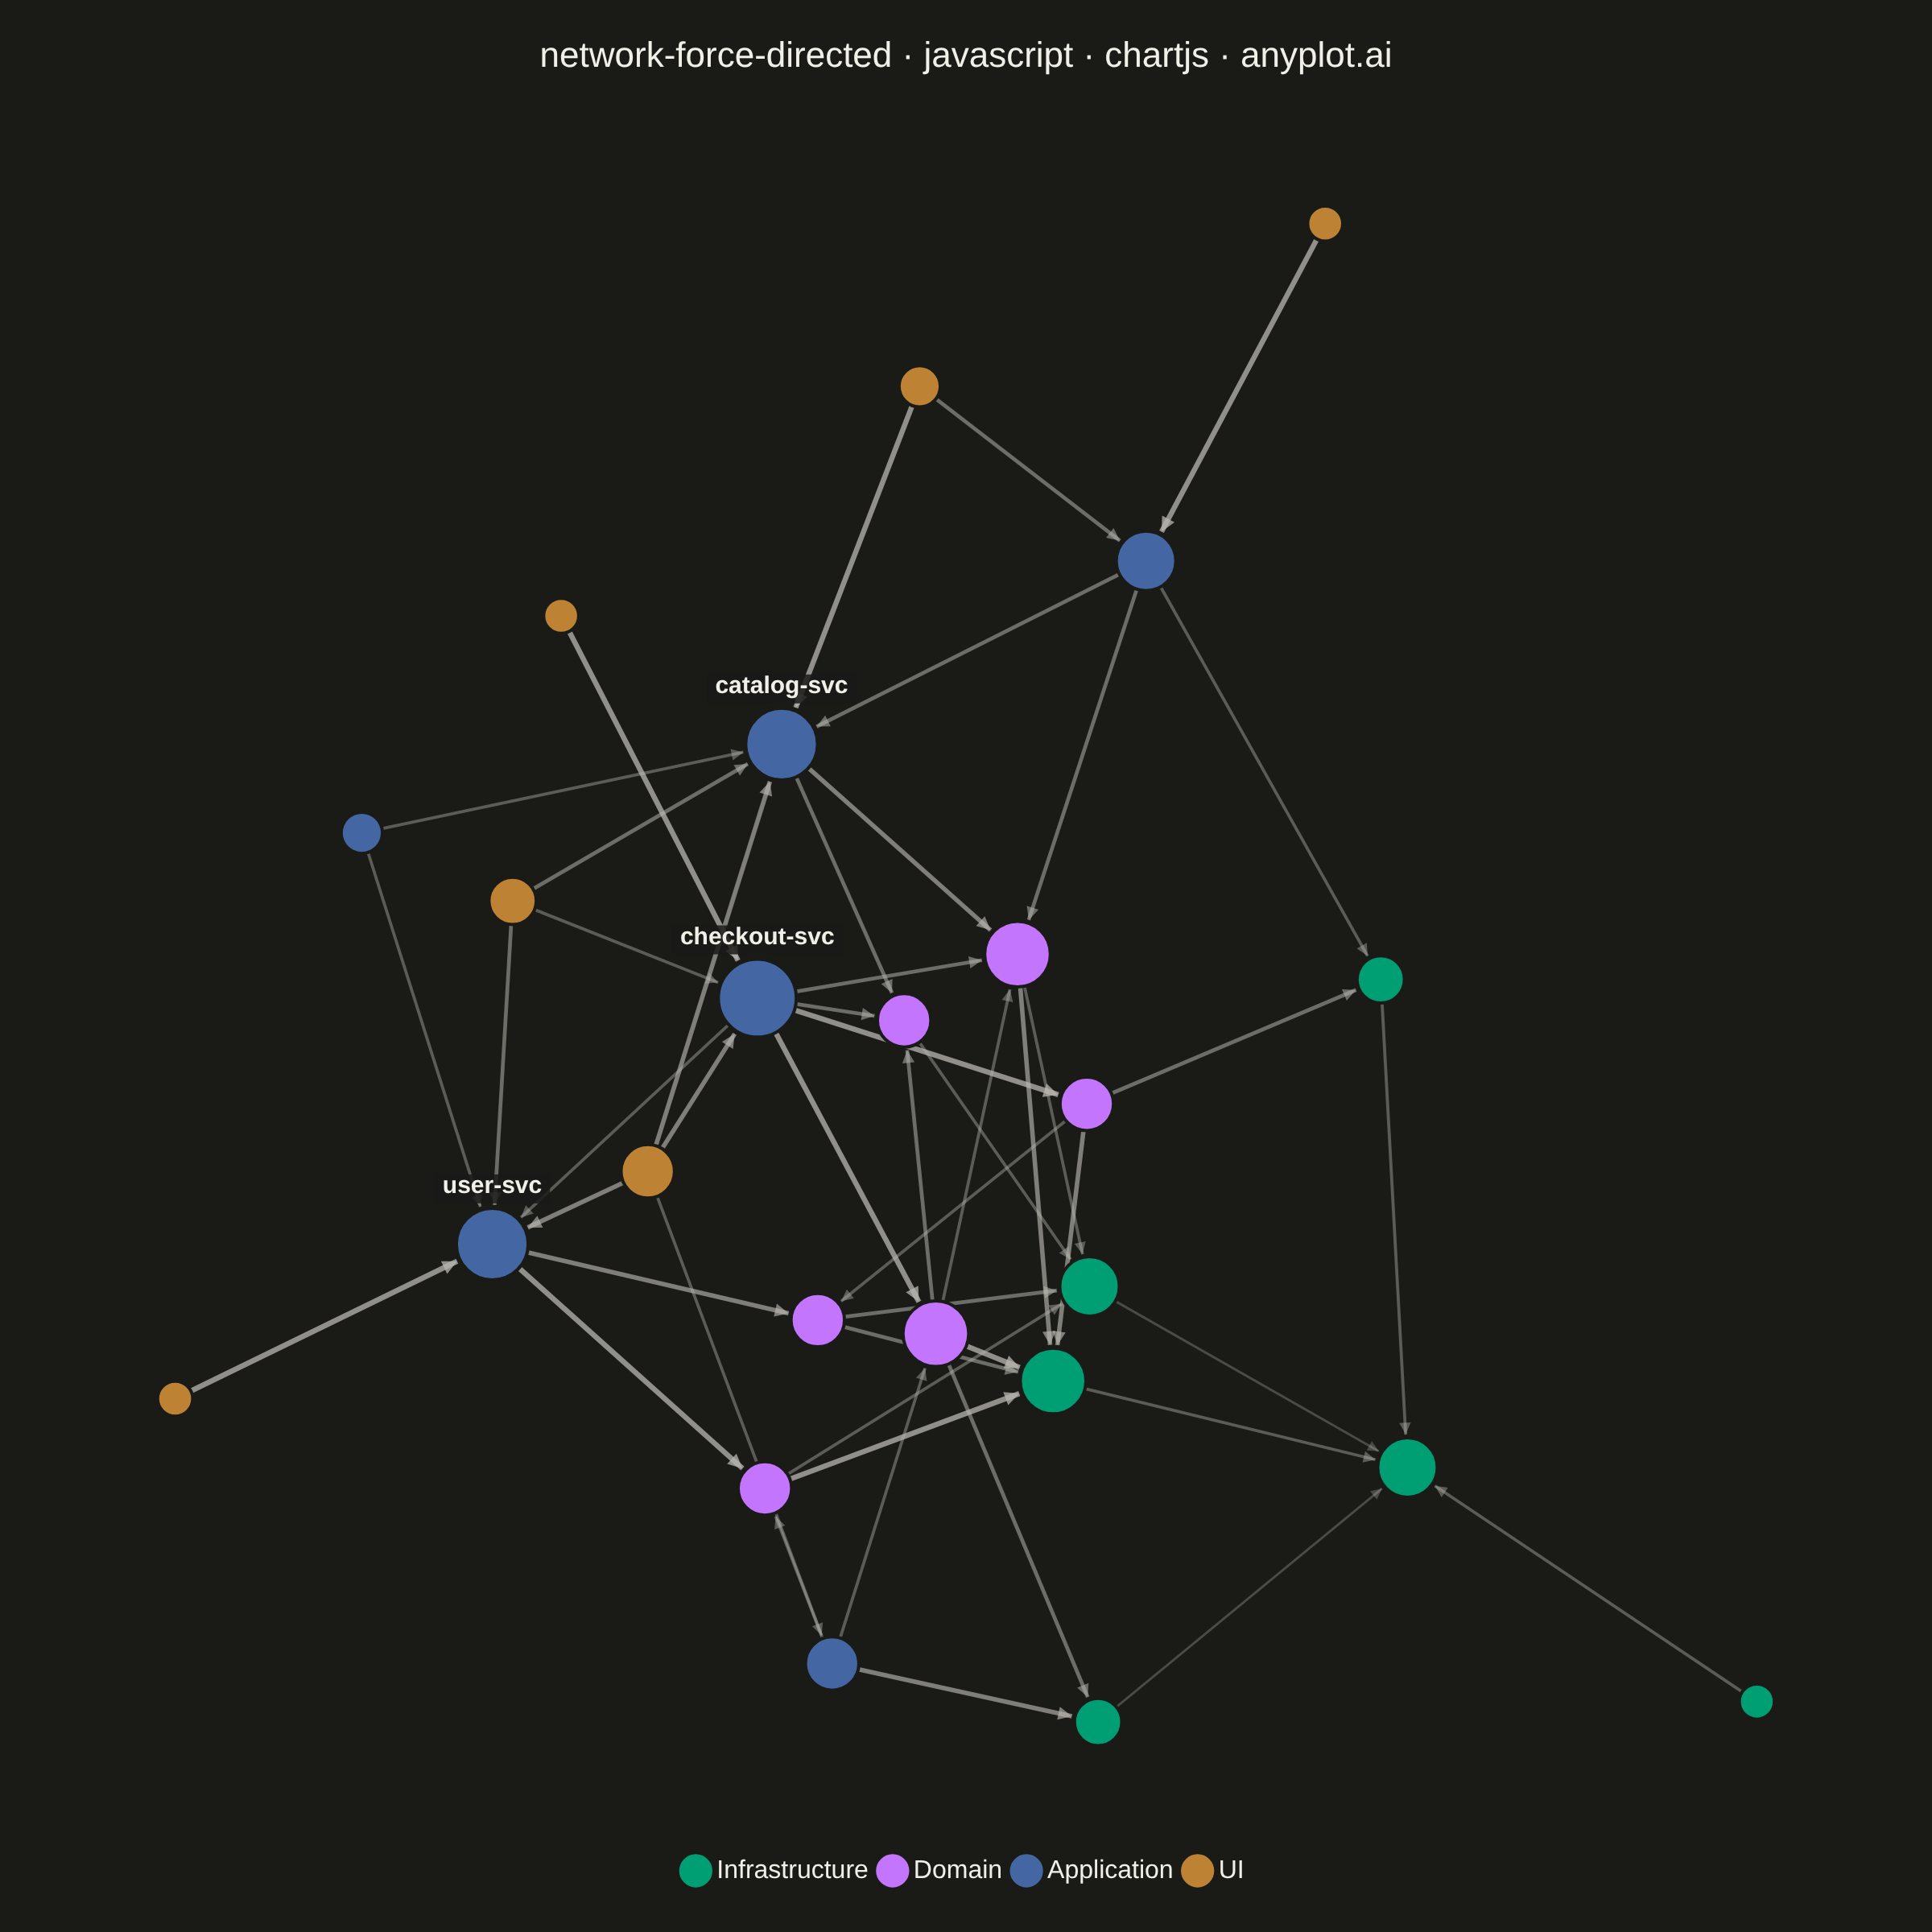
A force-directed graph uses physics simulation to position nodes, where connected nodes attract each other and all nodes repel. This creates organic layouts that naturally reveal community structure, central nodes, and overall network topology without manual positioning. The algorithm balances attractive forces (edges pulling connected nodes together) and repulsive forces (nodes pushing apart) until reaching equilibrium.
// anyplot.ai
// network-force-directed: Force-Directed Graph
// Library: chartjs 4.4.7 | JavaScript 22.23.2
// Quality: 89/100 | Created: 2026-08-24
//# anyplot-orientation: square

const t = window.ANYPLOT_TOKENS;

// --- Data: a layered software dependency graph ------------------------------
// Layers follow a typical service architecture; edges point from a dependent
// module to the module it depends on. Weight (1-5) is the coupling strength —
// how many call sites/imports tie the two modules together.
const LAYER_NAMES = ["Infrastructure", "Domain", "Application", "UI"];

const nodes = [
  { id: 0, name: "db-driver", layer: 0 },
  { id: 1, name: "cache", layer: 0 },
  { id: 2, name: "queue", layer: 0 },
  { id: 3, name: "logger", layer: 0 },
  { id: 4, name: "config", layer: 0 },
  { id: 5, name: "http-client", layer: 0 },
  { id: 6, name: "user-repo", layer: 1 },
  { id: 7, name: "order-repo", layer: 1 },
  { id: 8, name: "payment-repo", layer: 1 },
  { id: 9, name: "inventory-repo", layer: 1 },
  { id: 10, name: "pricing-rules", layer: 1 },
  { id: 11, name: "auth-domain", layer: 1 },
  { id: 12, name: "checkout-svc", layer: 2 },
  { id: 13, name: "catalog-svc", layer: 2 },
  { id: 14, name: "user-svc", layer: 2 },
  { id: 15, name: "notification-svc", layer: 2 },
  { id: 16, name: "search-svc", layer: 2 },
  { id: 17, name: "recommender-svc", layer: 2 },
  { id: 18, name: "checkout-ui", layer: 3 },
  { id: 19, name: "catalog-ui", layer: 3 },
  { id: 20, name: "account-ui", layer: 3 },
  { id: 21, name: "admin-ui", layer: 3 },
  { id: 22, name: "search-ui", layer: 3 },
  { id: 23, name: "mobile-app", layer: 3 },
];

// Directed edges [dependent, dependency, weight] — arrow points at the module
// being depended on.
const edges = [
  [3, 4, 2], [5, 4, 2], [2, 4, 1], [1, 4, 1], [0, 4, 2],
  [6, 0, 5], [6, 1, 2],
  [7, 0, 5], [7, 2, 3],
  [8, 0, 4], [8, 5, 3],
  [9, 0, 4], [9, 1, 2],
  [10, 1, 2],
  [11, 0, 3], [11, 1, 3],
  [7, 10, 3], [7, 9, 2], [8, 11, 2],
  [12, 7, 5], [12, 8, 5], [12, 10, 3], [12, 9, 3], [12, 14, 2],
  [13, 9, 4], [13, 10, 3],
  [14, 6, 5], [14, 11, 4],
  [15, 6, 2], [15, 7, 2], [15, 2, 4],
  [16, 9, 3], [16, 13, 3], [16, 5, 2],
  [17, 13, 2], [17, 14, 2],
  [18, 12, 5],
  [19, 13, 5], [19, 16, 3],
  [20, 14, 5],
  [21, 14, 3], [21, 13, 3], [21, 12, 2],
  [22, 16, 5],
  [23, 12, 4], [23, 13, 4], [23, 14, 4], [23, 15, 2],
];

// Degree (in + out) per node — drives marker size and hub-label selection
const degree = new Array(nodes.length).fill(0);
edges.forEach(([a, b]) => {
  degree[a] += 1;
  degree[b] += 1;
});
const nodeRadius = (id) => 9 + degree[id] * 1.9;

// Top-3 most-connected modules — labeled directly since the full 24-name set
// would clutter the canvas, but the central hubs are worth naming.
const hubs = [...nodes].sort((a, b) => degree[b.id] - degree[a.id]).slice(0, 3);

// --- Force-directed layout (Fruchterman-Reingold), deterministic via a
// fixed-seed LCG. Edge weight scales the attractive force so tightly-coupled
// modules are pulled closer together than loosely-coupled ones. ---
function lcg(seed) {
  let s = seed;
  return () => {
    s = (s * 1664525 + 1013904223) % 4294967296;
    return s / 4294967296;
  };
}
const rand = lcg(42);

const nodeCount = nodes.length;
const area = 4; // layout unfolds inside a [-1, 1] x [-1, 1] square
// A slightly stronger repulsion constant than the classic sqrt(area/n) gives
// dense hub neighborhoods (catalog-svc/checkout-svc/user-svc + shared infra)
// more breathing room so individual edges stay traceable at a glance.
const k = Math.sqrt(area / nodeCount) * 1.3;
const pos = nodes.map(() => ({ x: rand() * 2 - 1, y: rand() * 2 - 1 }));

let temperature = 0.15;
const iterations = 400;
for (let iter = 0; iter < iterations; iter++) {
  const disp = pos.map(() => ({ x: 0, y: 0 }));

  // Repulsion between every pair of nodes keeps clusters from collapsing
  for (let i = 0; i < nodeCount; i++) {
    for (let j = i + 1; j < nodeCount; j++) {
      let dx = pos[i].x - pos[j].x;
      let dy = pos[i].y - pos[j].y;
      const dist = Math.max(Math.sqrt(dx * dx + dy * dy), 0.01);
      const force = (k * k) / dist;
      dx = (dx / dist) * force;
      dy = (dy / dist) * force;
      disp[i].x += dx;
      disp[i].y += dy;
      disp[j].x -= dx;
      disp[j].y -= dy;
    }
  }

  // Attraction along edges, scaled by coupling weight
  edges.forEach(([a, b, weight]) => {
    let dx = pos[a].x - pos[b].x;
    let dy = pos[a].y - pos[b].y;
    const dist = Math.max(Math.sqrt(dx * dx + dy * dy), 0.01);
    const force = ((dist * dist) / k) * (0.5 + weight / 5);
    dx = (dx / dist) * force;
    dy = (dy / dist) * force;
    disp[a].x -= dx;
    disp[a].y -= dy;
    disp[b].x += dx;
    disp[b].y += dy;
  });

  // Weak centering (gravity) force pulls every node gently toward the
  // origin so no straggling branch drifts the whole point cloud toward one
  // corner, which otherwise leaves the opposite quadrant of the canvas
  // empty once the layout stabilizes.
  for (let i = 0; i < nodeCount; i++) {
    disp[i].x -= pos[i].x * 0.02;
    disp[i].y -= pos[i].y * 0.02;
  }

  // Apply displacement, capped by the cooling temperature
  for (let i = 0; i < nodeCount; i++) {
    const d = Math.max(Math.sqrt(disp[i].x ** 2 + disp[i].y ** 2), 0.0001);
    pos[i].x += (disp[i].x / d) * Math.min(d, temperature);
    pos[i].y += (disp[i].y / d) * Math.min(d, temperature);
  }
  temperature *= 0.99;
}

// Fit each axis to its own extent (rather than a shared symmetric bound) so
// a single peripheral node on one axis doesn't force empty padding on the
// other — network layout coordinates are arbitrary, so independent x/y
// scaling fills the canvas without implying a false distance metric.
const minX = Math.min(...pos.map((p) => p.x));
const maxX = Math.max(...pos.map((p) => p.x));
const minY = Math.min(...pos.map((p) => p.y));
const maxY = Math.max(...pos.map((p) => p.y));
const padX = (maxX - minX) * 0.08;
const padY = (maxY - minY) * 0.08;
const xRange = { min: minX - padX, max: maxX + padX };
const yRange = { min: minY - padY, max: maxY + padY };
nodes.forEach((node, i) => {
  node.x = pos[i].x;
  node.y = pos[i].y;
});

// --- Mount ---
const canvas = document.createElement("canvas");
document.getElementById("container").appendChild(canvas);

// --- Edges: drawn under the node markers via a lightweight inline plugin.
// Each edge carries a small arrowhead at the dependency (target) end so the
// static PNG conveys direction, not just adjacency. Thickness and opacity
// scale with coupling weight. ---
const edgePlugin = {
  id: "networkEdges",
  beforeDatasetsDraw(chart) {
    const { ctx, scales } = chart;
    ctx.save();
    ctx.strokeStyle = t.inkSoft;
    ctx.fillStyle = t.inkSoft;
    edges.forEach(([a, b, weight]) => {
      const x1 = scales.x.getPixelForValue(nodes[a].x);
      const y1 = scales.y.getPixelForValue(nodes[a].y);
      const x2 = scales.x.getPixelForValue(nodes[b].x);
      const y2 = scales.y.getPixelForValue(nodes[b].y);
      const angle = Math.atan2(y2 - y1, x2 - x1);
      const rTarget = nodeRadius(b) + 2;
      const tipX = x2 - Math.cos(angle) * rTarget;
      const tipY = y2 - Math.sin(angle) * rTarget;

      ctx.globalAlpha = 0.2 + weight * 0.11;
      ctx.lineWidth = 1 + weight * 0.45;
      ctx.beginPath();
      ctx.moveTo(x1, y1);
      ctx.lineTo(tipX, tipY);
      ctx.stroke();

      const arrowLen = 7 + weight * 0.6;
      ctx.beginPath();
      ctx.moveTo(tipX, tipY);
      ctx.lineTo(tipX - arrowLen * Math.cos(angle - Math.PI / 7), tipY - arrowLen * Math.sin(angle - Math.PI / 7));
      ctx.lineTo(tipX - arrowLen * Math.cos(angle + Math.PI / 7), tipY - arrowLen * Math.sin(angle + Math.PI / 7));
      ctx.closePath();
      ctx.fill();
    });
    ctx.restore();
  },
};

// --- Hub labels: name tags for the three highest-degree modules, drawn on
// top of everything so the static PNG identifies the central dependencies ---
const hubLabelPlugin = {
  id: "networkHubLabels",
  afterDatasetsDraw(chart) {
    const { ctx, scales } = chart;
    ctx.save();
    ctx.font = "600 15px sans-serif";
    ctx.textAlign = "center";
    ctx.textBaseline = "bottom";
    hubs.forEach((node) => {
      const x = scales.x.getPixelForValue(node.x);
      const y = scales.y.getPixelForValue(node.y) - nodeRadius(node.id) - 6;
      const text = node.name;
      const padX = 5;
      const { width } = ctx.measureText(text);
      ctx.fillStyle = t.pageBg;
      ctx.globalAlpha = 0.85;
      ctx.fillRect(x - width / 2 - padX, y - 15, width + padX * 2, 18);
      ctx.globalAlpha = 1;
      ctx.fillStyle = t.ink;
      ctx.fillText(text, x, y);
    });
    ctx.restore();
  },
};

// --- Nodes: one dataset per architectural layer so the legend reads as
// layer color ---
const layerNodes = LAYER_NAMES.map((_, l) => nodes.filter((node) => node.layer === l));
const datasets = layerNodes.map((layer, l) => ({
  label: LAYER_NAMES[l],
  data: layer.map((node) => ({ x: node.x, y: node.y })),
  backgroundColor: t.palette[l],
  borderColor: t.pageBg,
  borderWidth: 2,
  pointRadius: layer.map((node) => nodeRadius(node.id)),
  pointHoverRadius: layer.map((node) => nodeRadius(node.id) + 4),
  showLine: false,
}));

// --- Chart ---
new Chart(canvas, {
  type: "scatter",
  data: { datasets },
  plugins: [edgePlugin, hubLabelPlugin],
  options: {
    responsive: true,
    maintainAspectRatio: false,
    animation: false,
    layout: {
      padding: { top: 10, right: 30, bottom: 20, left: 30 },
    },
    plugins: {
      title: {
        display: true,
        text: "network-force-directed · javascript · chartjs · anyplot.ai",
        color: t.ink,
        font: { size: 22, weight: "normal" },
        padding: { top: 12, bottom: 16 },
      },
      legend: {
        display: true,
        position: "bottom",
        labels: { color: t.ink, font: { size: 16 }, usePointStyle: true, boxWidth: 10 },
      },
      tooltip: {
        callbacks: {
          title: (items) => (items.length ? LAYER_NAMES[items[0].datasetIndex] : ""),
          label: (item) => {
            const node = layerNodes[item.datasetIndex][item.dataIndex];
            return `${node.name} — ${degree[node.id]} dependencies`;
          },
        },
      },
    },
    scales: {
      x: { display: false, min: xRange.min, max: xRange.max },
      y: { display: false, min: yRange.min, max: yRange.max },
    },
  },
});
Runnable source as JSON, for any HTTP client: https://api.anyplot.ai/specs/network-force-directed/chartjs/code. Any spec id and library id listed in llms-full.txt fit the same URL shape; every URL below is complete and callable.
{
  "spec_id": "network-force-directed",
  "language": "javascript",
  "library": "chartjs",
  "page": "https://anyplot.ai/network-force-directed/javascript/chartjs",
  "hub": "https://anyplot.ai/network-force-directed",
  "code_json": "https://api.anyplot.ai/specs/network-force-directed/chartjs/code",
  "spec_json": "https://api.anyplot.ai/specs/network-force-directed",
  "render_light_png": "https://storage.googleapis.com/anyplot-images/plots/network-force-directed/javascript/chartjs/plot-light.png",
  "render_dark_png": "https://storage.googleapis.com/anyplot-images/plots/network-force-directed/javascript/chartjs/plot-dark.png",
  "interactive_light_html": "https://storage.googleapis.com/anyplot-images/plots/network-force-directed/javascript/chartjs/plot-light.html",
  "interactive_dark_html": "https://storage.googleapis.com/anyplot-images/plots/network-force-directed/javascript/chartjs/plot-dark.html",
  "quality_score": 89.0,
  "license": "MIT",
  "guide": "https://anyplot.ai/llms.txt"
}
Part of Force-Directed Graph on anyplot.ai.