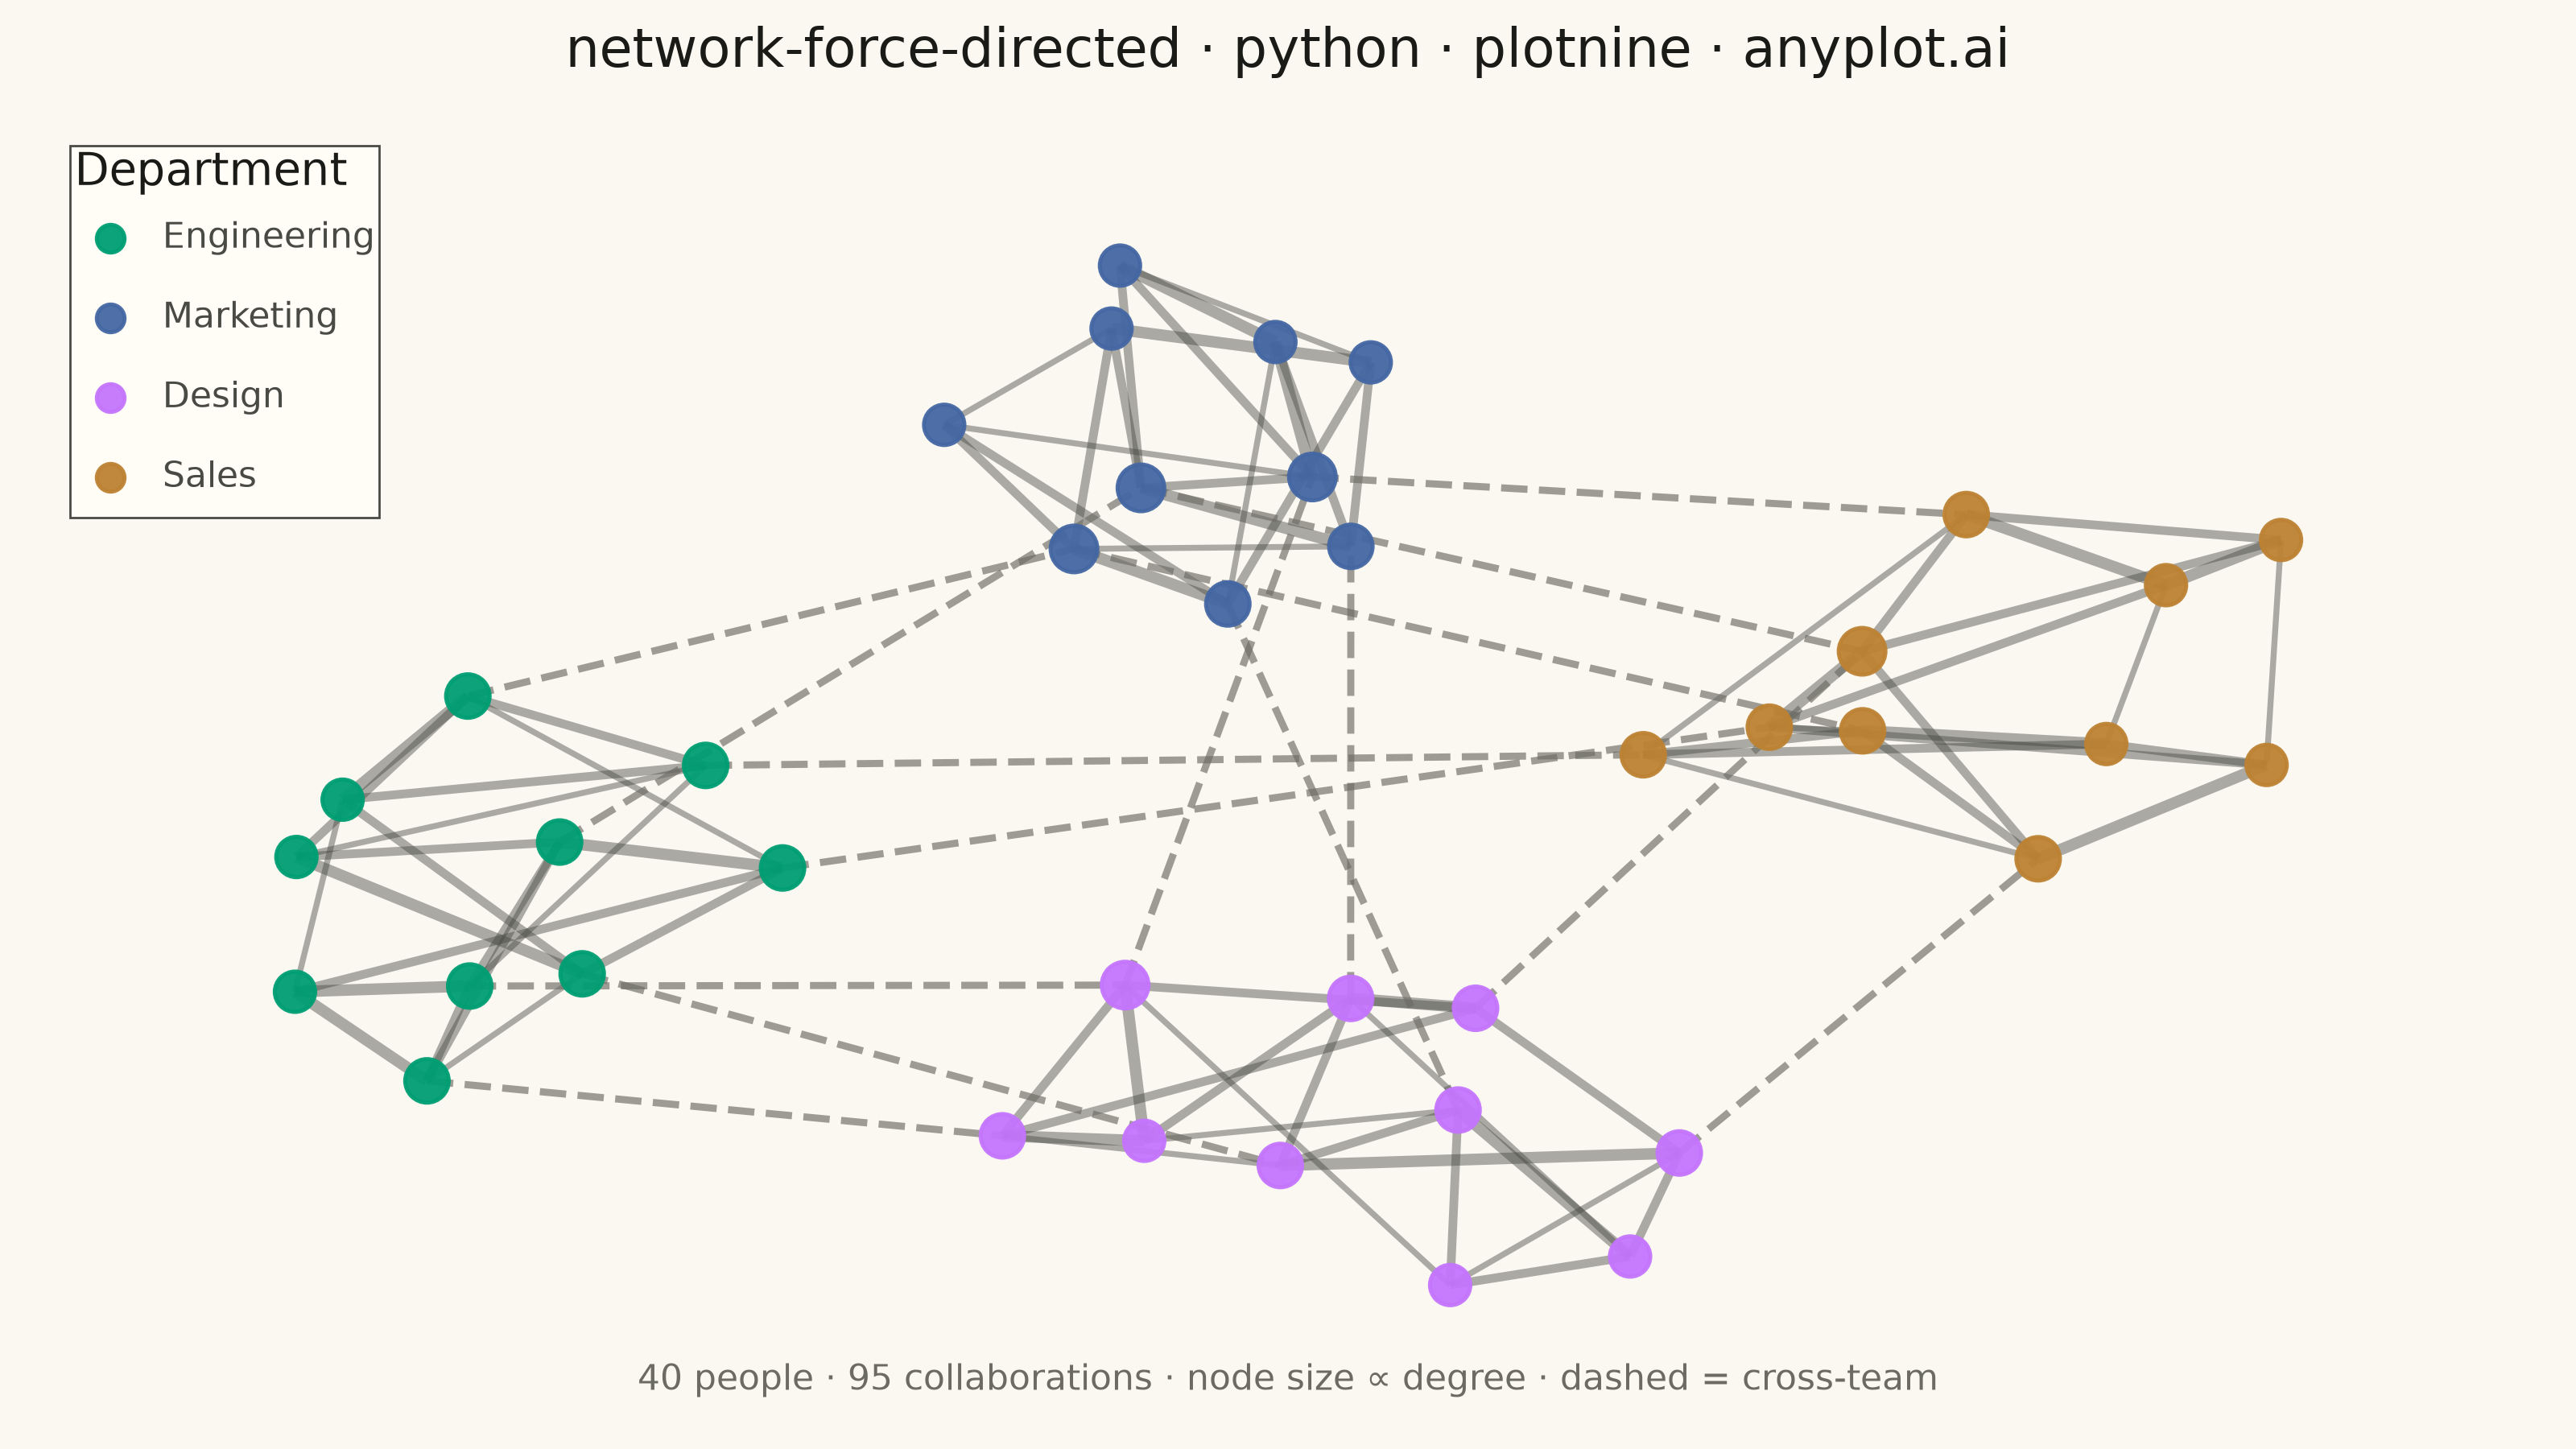
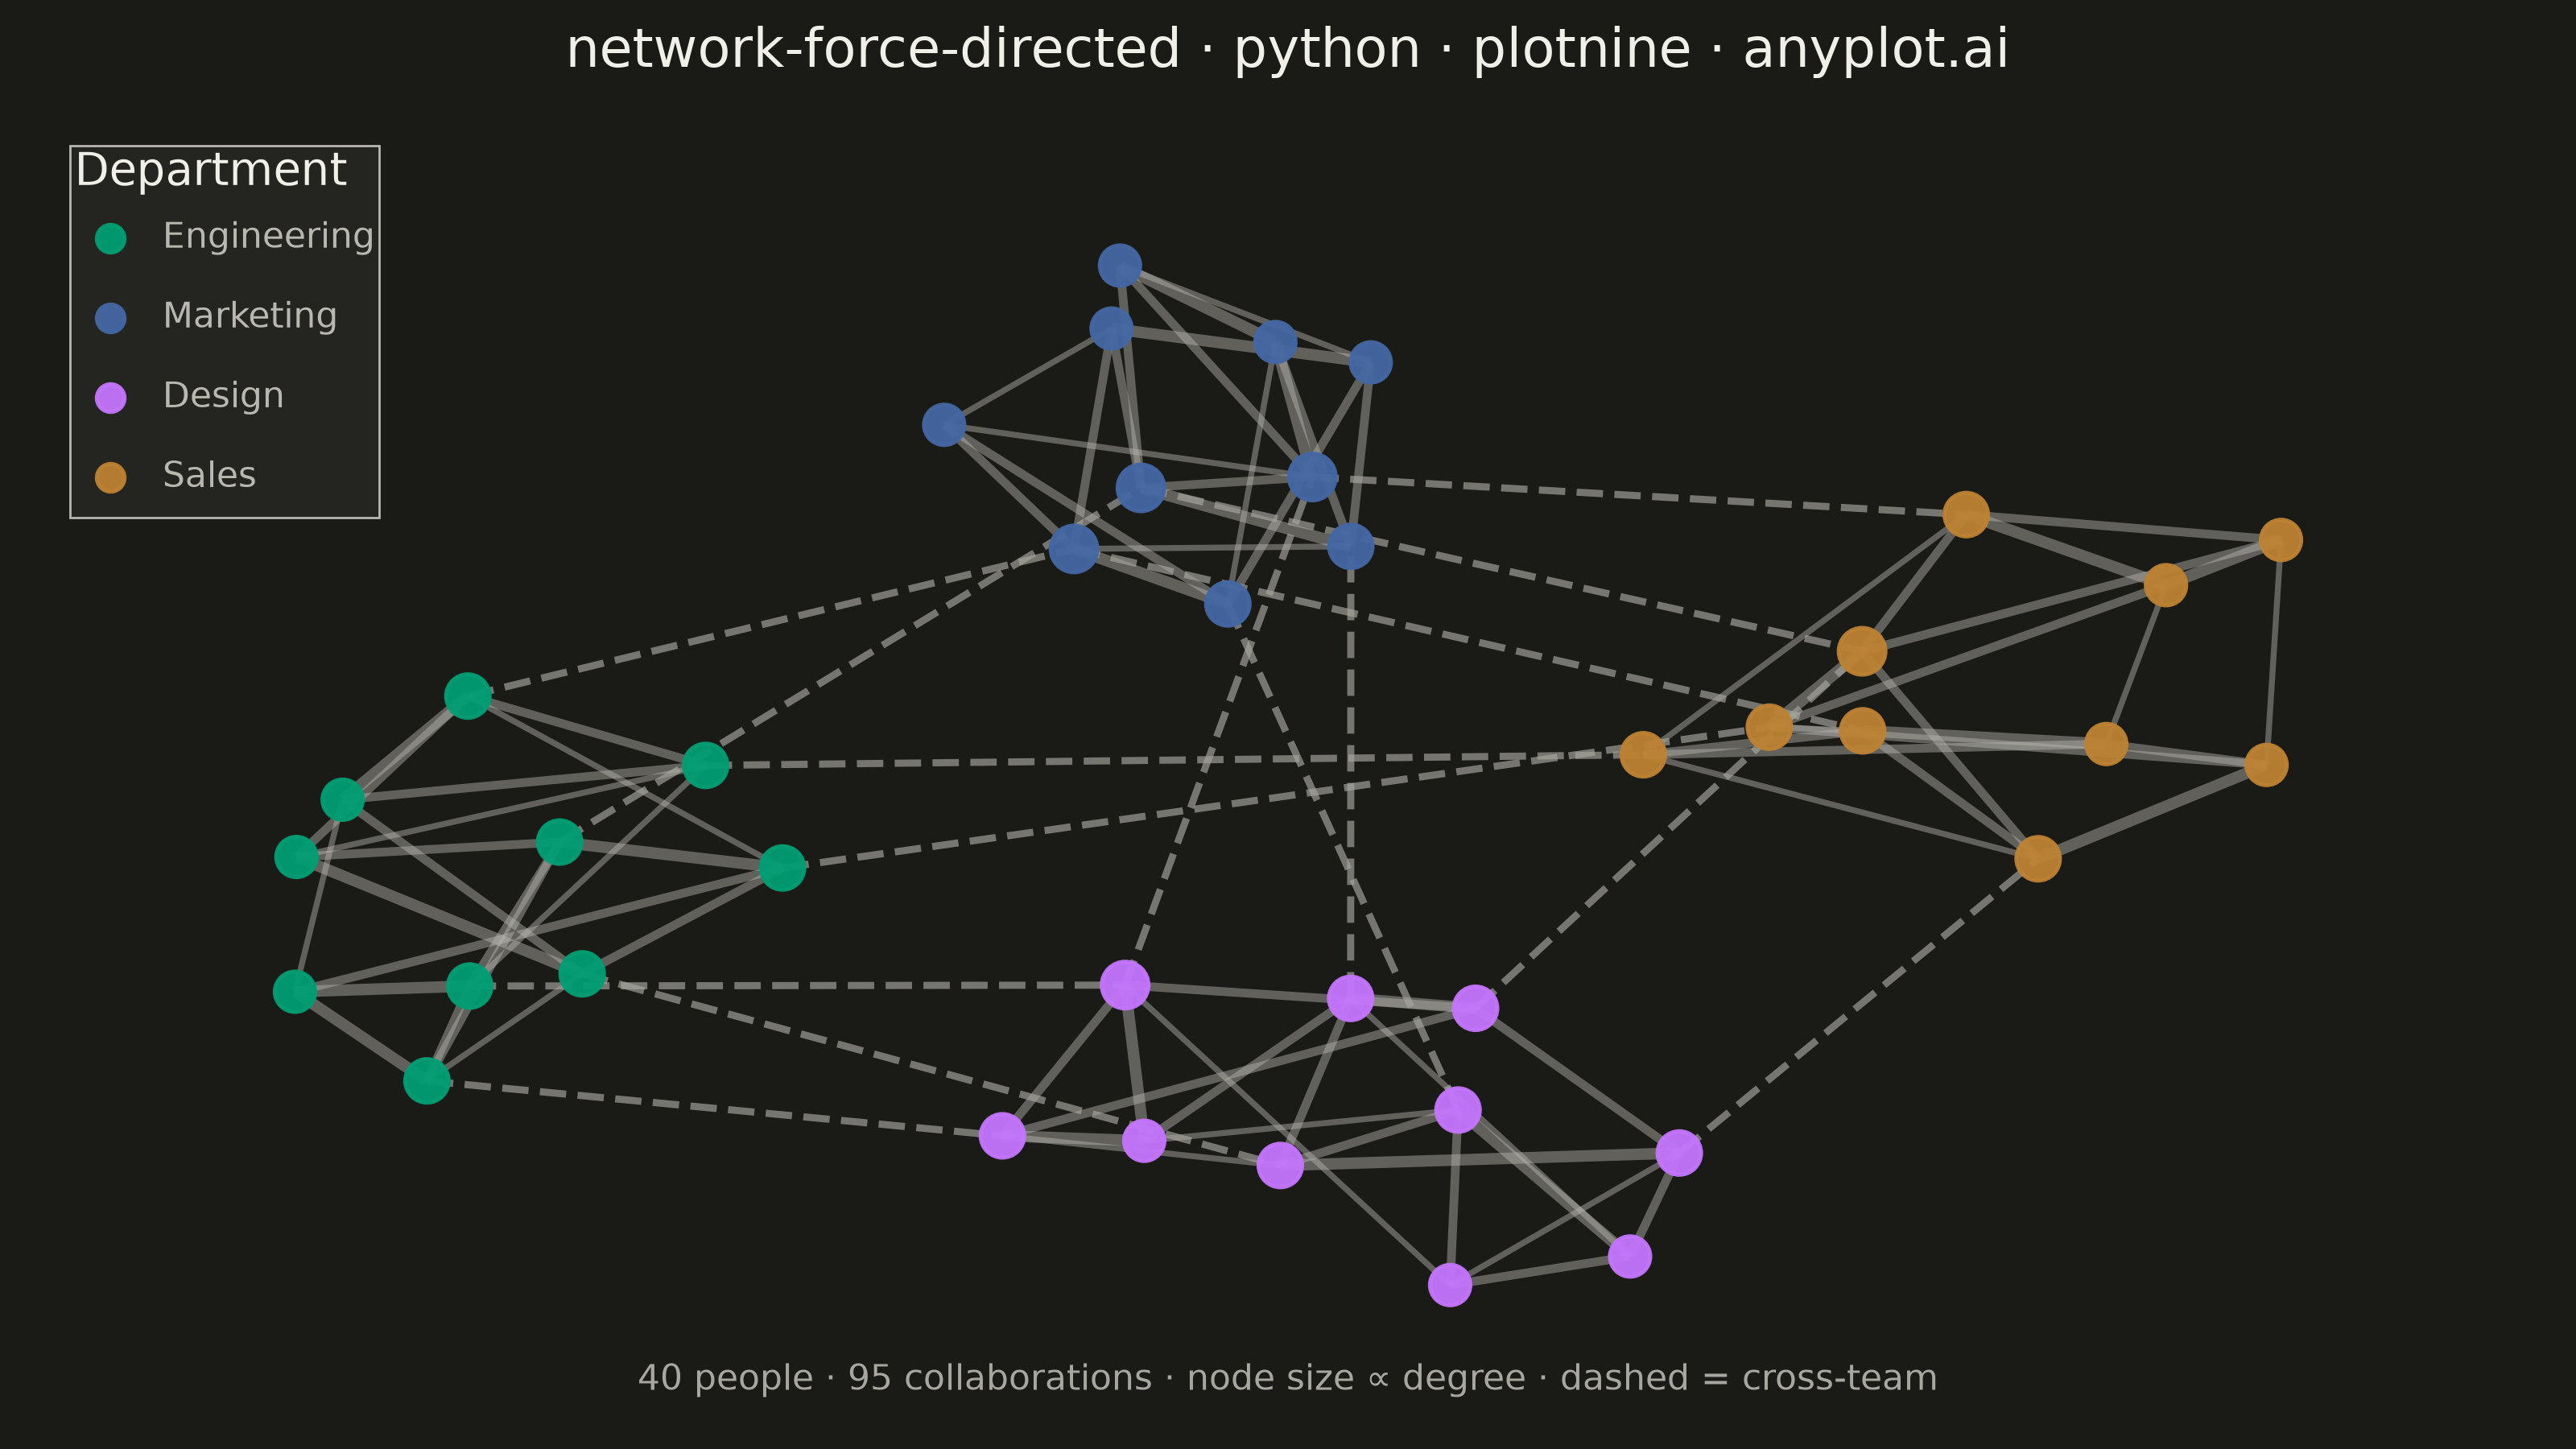
A force-directed graph uses physics simulation to position nodes, where connected nodes attract each other and all nodes repel. This creates organic layouts that naturally reveal community structure, central nodes, and overall network topology without manual positioning. The algorithm balances attractive forces (edges pulling connected nodes together) and repulsive forces (nodes pushing apart) until reaching equilibrium.
""" anyplot.ai
network-force-directed: Force-Directed Graph
Library: plotnine 0.15.7 | Python 3.13.14
Quality: 85/100 | Updated: 2026-07-01
"""

import os

import numpy as np
import pandas as pd
from plotnine import (
    aes,
    annotate,
    element_blank,
    element_rect,
    element_text,
    geom_point,
    geom_segment,
    ggplot,
    guide_legend,
    guides,
    labs,
    scale_color_manual,
    scale_size_identity,
    theme,
    xlim,
    ylim,
)


# Theme tokens (see prompts/default-style-guide.md)
THEME = os.getenv("ANYPLOT_THEME", "light")
PAGE_BG = "#FAF8F1" if THEME == "light" else "#1A1A17"
ELEVATED_BG = "#FFFDF6" if THEME == "light" else "#242420"
INK = "#1A1A17" if THEME == "light" else "#F0EFE8"
INK_SOFT = "#4A4A44" if THEME == "light" else "#B8B7B0"
INK_MUTED = "#6B6A63" if THEME == "light" else "#A8A79F"

# Imprint palette — first series is always #009E73
DEPARTMENT_NAMES = ["Engineering", "Design", "Marketing", "Sales"]
DEPARTMENT_COLORS = {"Engineering": "#009E73", "Design": "#C475FD", "Marketing": "#4467A3", "Sales": "#BD8233"}

np.random.seed(42)

# Data: 40-person organization across 4 departments (10 each)
nodes = [{"id": i, "group": i // 10} for i in range(40)]

# Intra-department edges (dense clique-like pattern, repeated per department)
edges: list[tuple[int, int, int]] = []
for s in (0, 10, 20, 30):
    edges.extend(
        [
            (s + 0, s + 1, 3),
            (s + 0, s + 2, 2),
            (s + 0, s + 3, 2),
            (s + 1, s + 2, 3),
            (s + 1, s + 4, 2),
            (s + 2, s + 3, 2),
            (s + 2, s + 5, 1),
            (s + 3, s + 4, 3),
            (s + 3, s + 6, 2),
            (s + 4, s + 5, 2),
            (s + 4, s + 7, 1),
            (s + 5, s + 6, 3),
            (s + 5, s + 8, 2),
            (s + 6, s + 7, 2),
            (s + 6, s + 9, 1),
            (s + 7, s + 8, 3),
            (s + 7, s + 9, 2),
            (s + 8, s + 9, 2),
            (s + 0, s + 9, 1),
            (s + 1, s + 8, 1),
        ]
    )

# Cross-department bridges (weaker connections)
edges.extend(
    [
        (0, 10, 1),
        (2, 12, 1),
        (5, 15, 1),  # Engineering ↔ Design
        (10, 20, 1),
        (14, 24, 1),
        (18, 28, 1),  # Design ↔ Marketing
        (20, 30, 1),
        (23, 33, 1),
        (27, 37, 1),  # Marketing ↔ Sales
        (9, 39, 1),
        (4, 34, 1),  # Engineering ↔ Sales
        (3, 23, 1),
        (7, 27, 1),  # Engineering ↔ Marketing
        (13, 33, 1),
        (16, 36, 1),  # Design ↔ Sales
    ]
)

# Fruchterman-Reingold layout with weak centering gravity to avoid empty core
n = len(nodes)
positions = np.random.rand(n, 2) * 2 - 1
k = 0.28
gravity = 0.06
iterations = 250
temperature = 1.0

for iteration in range(iterations):
    displacement = np.zeros((n, 2))

    # Repulsive forces between all node pairs
    for i in range(n):
        for j in range(i + 1, n):
            diff = positions[i] - positions[j]
            dist = max(np.linalg.norm(diff), 0.01)
            force = (k * k / dist) * (diff / dist)
            displacement[i] += force
            displacement[j] -= force

    # Attractive forces along edges, scaled by collaboration weight
    for src, tgt, weight in edges:
        diff = positions[src] - positions[tgt]
        dist = max(np.linalg.norm(diff), 0.01)
        force = (dist * dist / k) * (weight / 3) * (diff / dist)
        displacement[src] -= force
        displacement[tgt] += force

    # Weak gravity toward origin pulls clusters inward
    for i in range(n):
        displacement[i] += gravity * (-positions[i])

    # Simulated annealing cooling
    cooling = temperature * (1 - iteration / iterations)
    for i in range(n):
        disp_norm = np.linalg.norm(displacement[i])
        if disp_norm > 0:
            positions[i] += (displacement[i] / disp_norm) * min(disp_norm, cooling * 0.1)

# Normalize to [0.05, 0.95]
pos_min = positions.min(axis=0)
pos_max = positions.max(axis=0)
positions = (positions - pos_min) / (pos_max - pos_min + 1e-6) * 0.9 + 0.05
pos = {node["id"]: positions[i] for i, node in enumerate(nodes)}

# Node degrees for size scaling
degrees = {node["id"]: 0 for node in nodes}
for src, tgt, _ in edges:
    degrees[src] += 1
    degrees[tgt] += 1

# Department centroids — order legend spatially (left → right)
centroids = {}
for dept_idx, dept_name in enumerate(DEPARTMENT_NAMES):
    member_ids = [node["id"] for node in nodes if node["group"] == dept_idx]
    centroids[dept_name] = np.mean([pos[i] for i in member_ids], axis=0)
legend_order = sorted(DEPARTMENT_NAMES, key=lambda name: centroids[name][0])

node_df = pd.DataFrame(
    {
        "x": [pos[node["id"]][0] for node in nodes],
        "y": [pos[node["id"]][1] for node in nodes],
        "group": pd.Categorical(
            [DEPARTMENT_NAMES[node["group"]] for node in nodes], categories=legend_order, ordered=True
        ),
        "size": [3.0 + degrees[node["id"]] * 0.4 for node in nodes],
    }
)

# Split edges into internal (solid) vs. cross-department bridges (dashed)
edge_records = []
for src, tgt, weight in edges:
    is_internal = nodes[src]["group"] == nodes[tgt]["group"]
    edge_records.append(
        {
            "x": pos[src][0],
            "y": pos[src][1],
            "xend": pos[tgt][0],
            "yend": pos[tgt][1],
            "thickness": 0.40 + weight * 0.35 if is_internal else 0.55 + weight * 0.35,
            "edge_type": "internal" if is_internal else "bridge",
        }
    )
edge_df = pd.DataFrame(edge_records)
internal_edges = edge_df[edge_df["edge_type"] == "internal"]
bridge_edges = edge_df[edge_df["edge_type"] == "bridge"]

EDGE_COLOR = INK_SOFT
BRIDGE_COLOR = INK_MUTED

plot = (
    ggplot()
    # Internal edges — solid, theme-adaptive
    + geom_segment(
        data=internal_edges,
        mapping=aes(x="x", y="y", xend="xend", yend="yend", size="thickness"),
        color=EDGE_COLOR,
        alpha=0.45,
    )
    # Cross-department bridges — dashed, lighter
    + geom_segment(
        data=bridge_edges,
        mapping=aes(x="x", y="y", xend="xend", yend="yend", size="thickness"),
        color=BRIDGE_COLOR,
        alpha=0.65,
        linetype="dashed",
    )
    # Nodes on top, sized by degree
    + geom_point(data=node_df, mapping=aes(x="x", y="y", color="group", size="size"), alpha=0.95, stroke=0.5)
    + scale_color_manual(values=DEPARTMENT_COLORS, breaks=legend_order)
    + scale_size_identity()
    + guides(color=guide_legend(override_aes={"size": 3}))
    + labs(title="network-force-directed · python · plotnine · anyplot.ai", color="Department")
    + xlim(-0.02, 1.02)
    + ylim(-0.02, 1.02)
    + annotate(
        "text",
        x=0.5,
        y=-0.015,
        label=f"{len(nodes)} people · {len(edges)} collaborations · node size ∝ degree · dashed = cross-team",
        size=8,
        color=INK_MUTED,
        ha="center",
        va="top",
    )
    + theme(
        figure_size=(8, 4.5),
        plot_title=element_text(size=12, color=INK, ha="center", margin={"b": 6}),
        legend_title=element_text(size=10, color=INK),
        legend_text=element_text(size=8, color=INK_SOFT),
        legend_position=(0.02, 0.98),
        legend_direction="vertical",
        legend_background=element_rect(fill=ELEVATED_BG, color=INK_SOFT, size=0.5),
        legend_key=element_rect(fill=ELEVATED_BG, color=ELEVATED_BG),
        axis_title=element_blank(),
        axis_text=element_blank(),
        axis_ticks=element_blank(),
        panel_grid=element_blank(),
        panel_background=element_rect(fill=PAGE_BG, color=PAGE_BG),
        plot_background=element_rect(fill=PAGE_BG, color=PAGE_BG),
    )
)

plot.save(f"plot-{THEME}.png", dpi=400, width=8, height=4.5, units="in")
Runnable source as JSON, for any HTTP client: https://api.anyplot.ai/specs/network-force-directed/plotnine/code. Any spec id and library id listed in llms-full.txt fit the same URL shape; every URL below is complete and callable.
{
  "spec_id": "network-force-directed",
  "language": "python",
  "library": "plotnine",
  "page": "https://anyplot.ai/network-force-directed/python/plotnine",
  "hub": "https://anyplot.ai/network-force-directed",
  "code_json": "https://api.anyplot.ai/specs/network-force-directed/plotnine/code",
  "spec_json": "https://api.anyplot.ai/specs/network-force-directed",
  "render_light_png": "https://storage.googleapis.com/anyplot-images/plots/network-force-directed/python/plotnine/plot-light.png",
  "render_dark_png": "https://storage.googleapis.com/anyplot-images/plots/network-force-directed/python/plotnine/plot-dark.png",
  "quality_score": 85.0,
  "license": "MIT",
  "guide": "https://anyplot.ai/llms.txt"
}
Part of Force-Directed Graph on anyplot.ai.