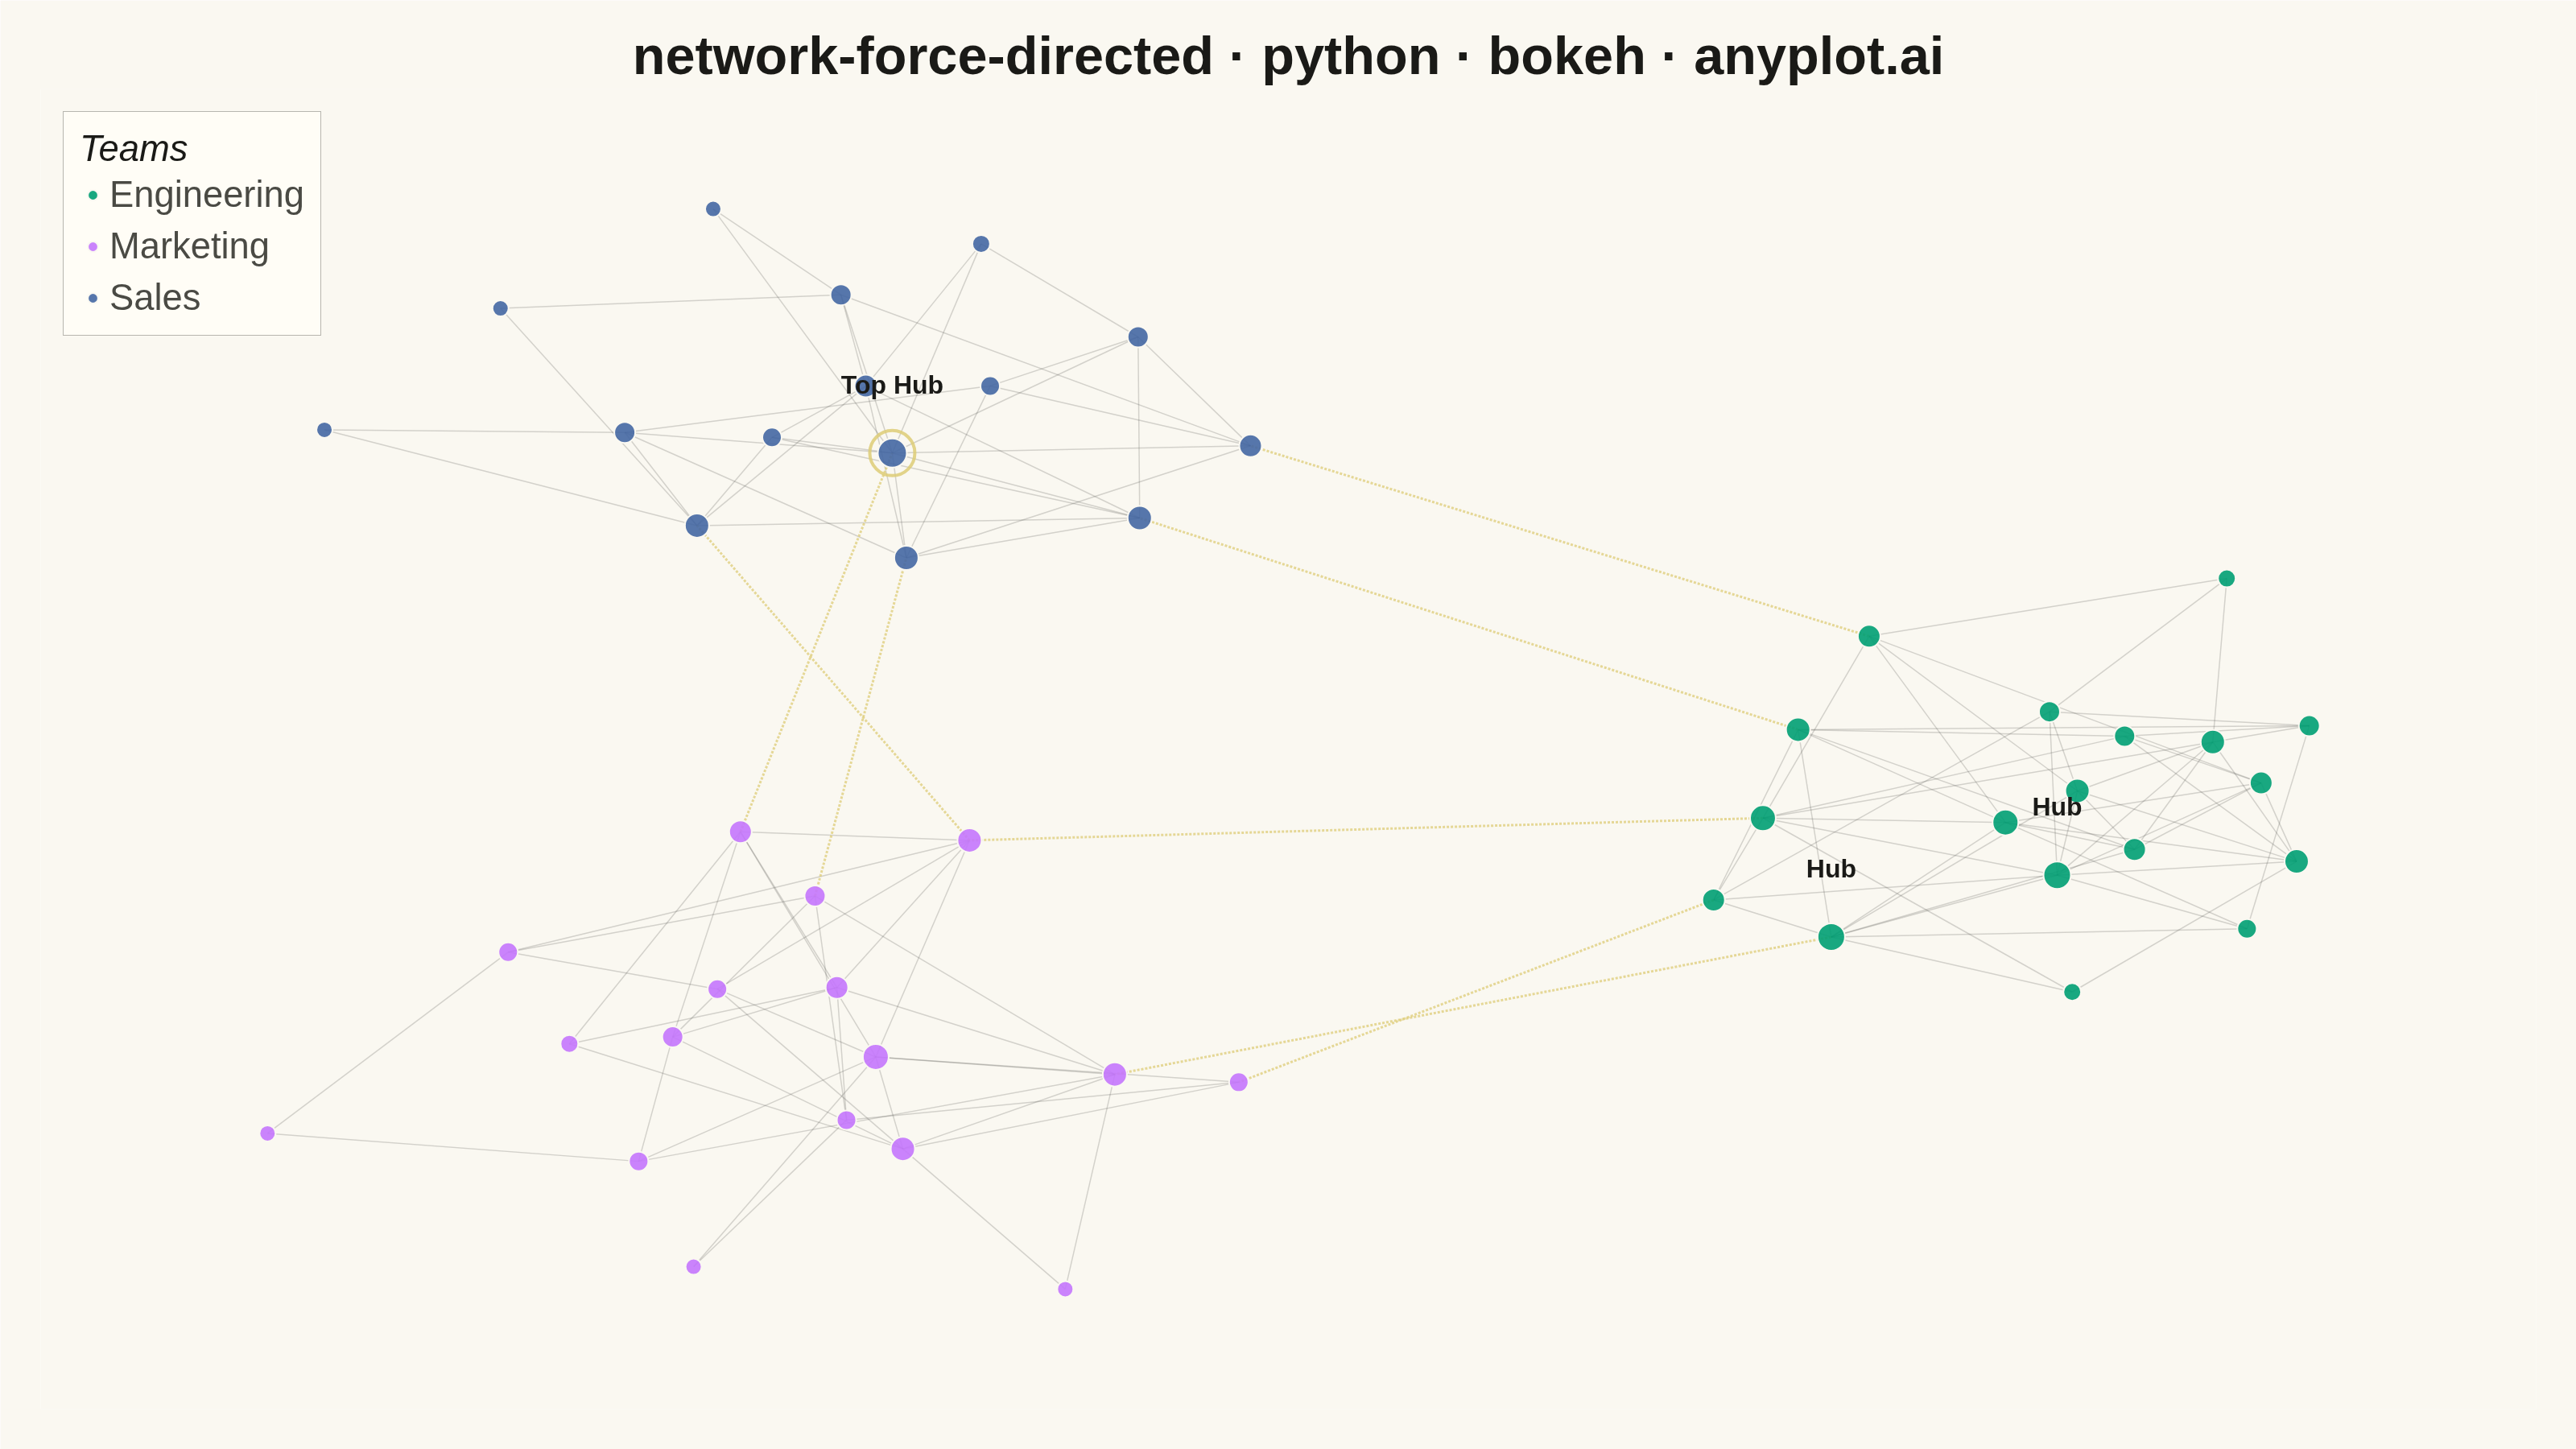
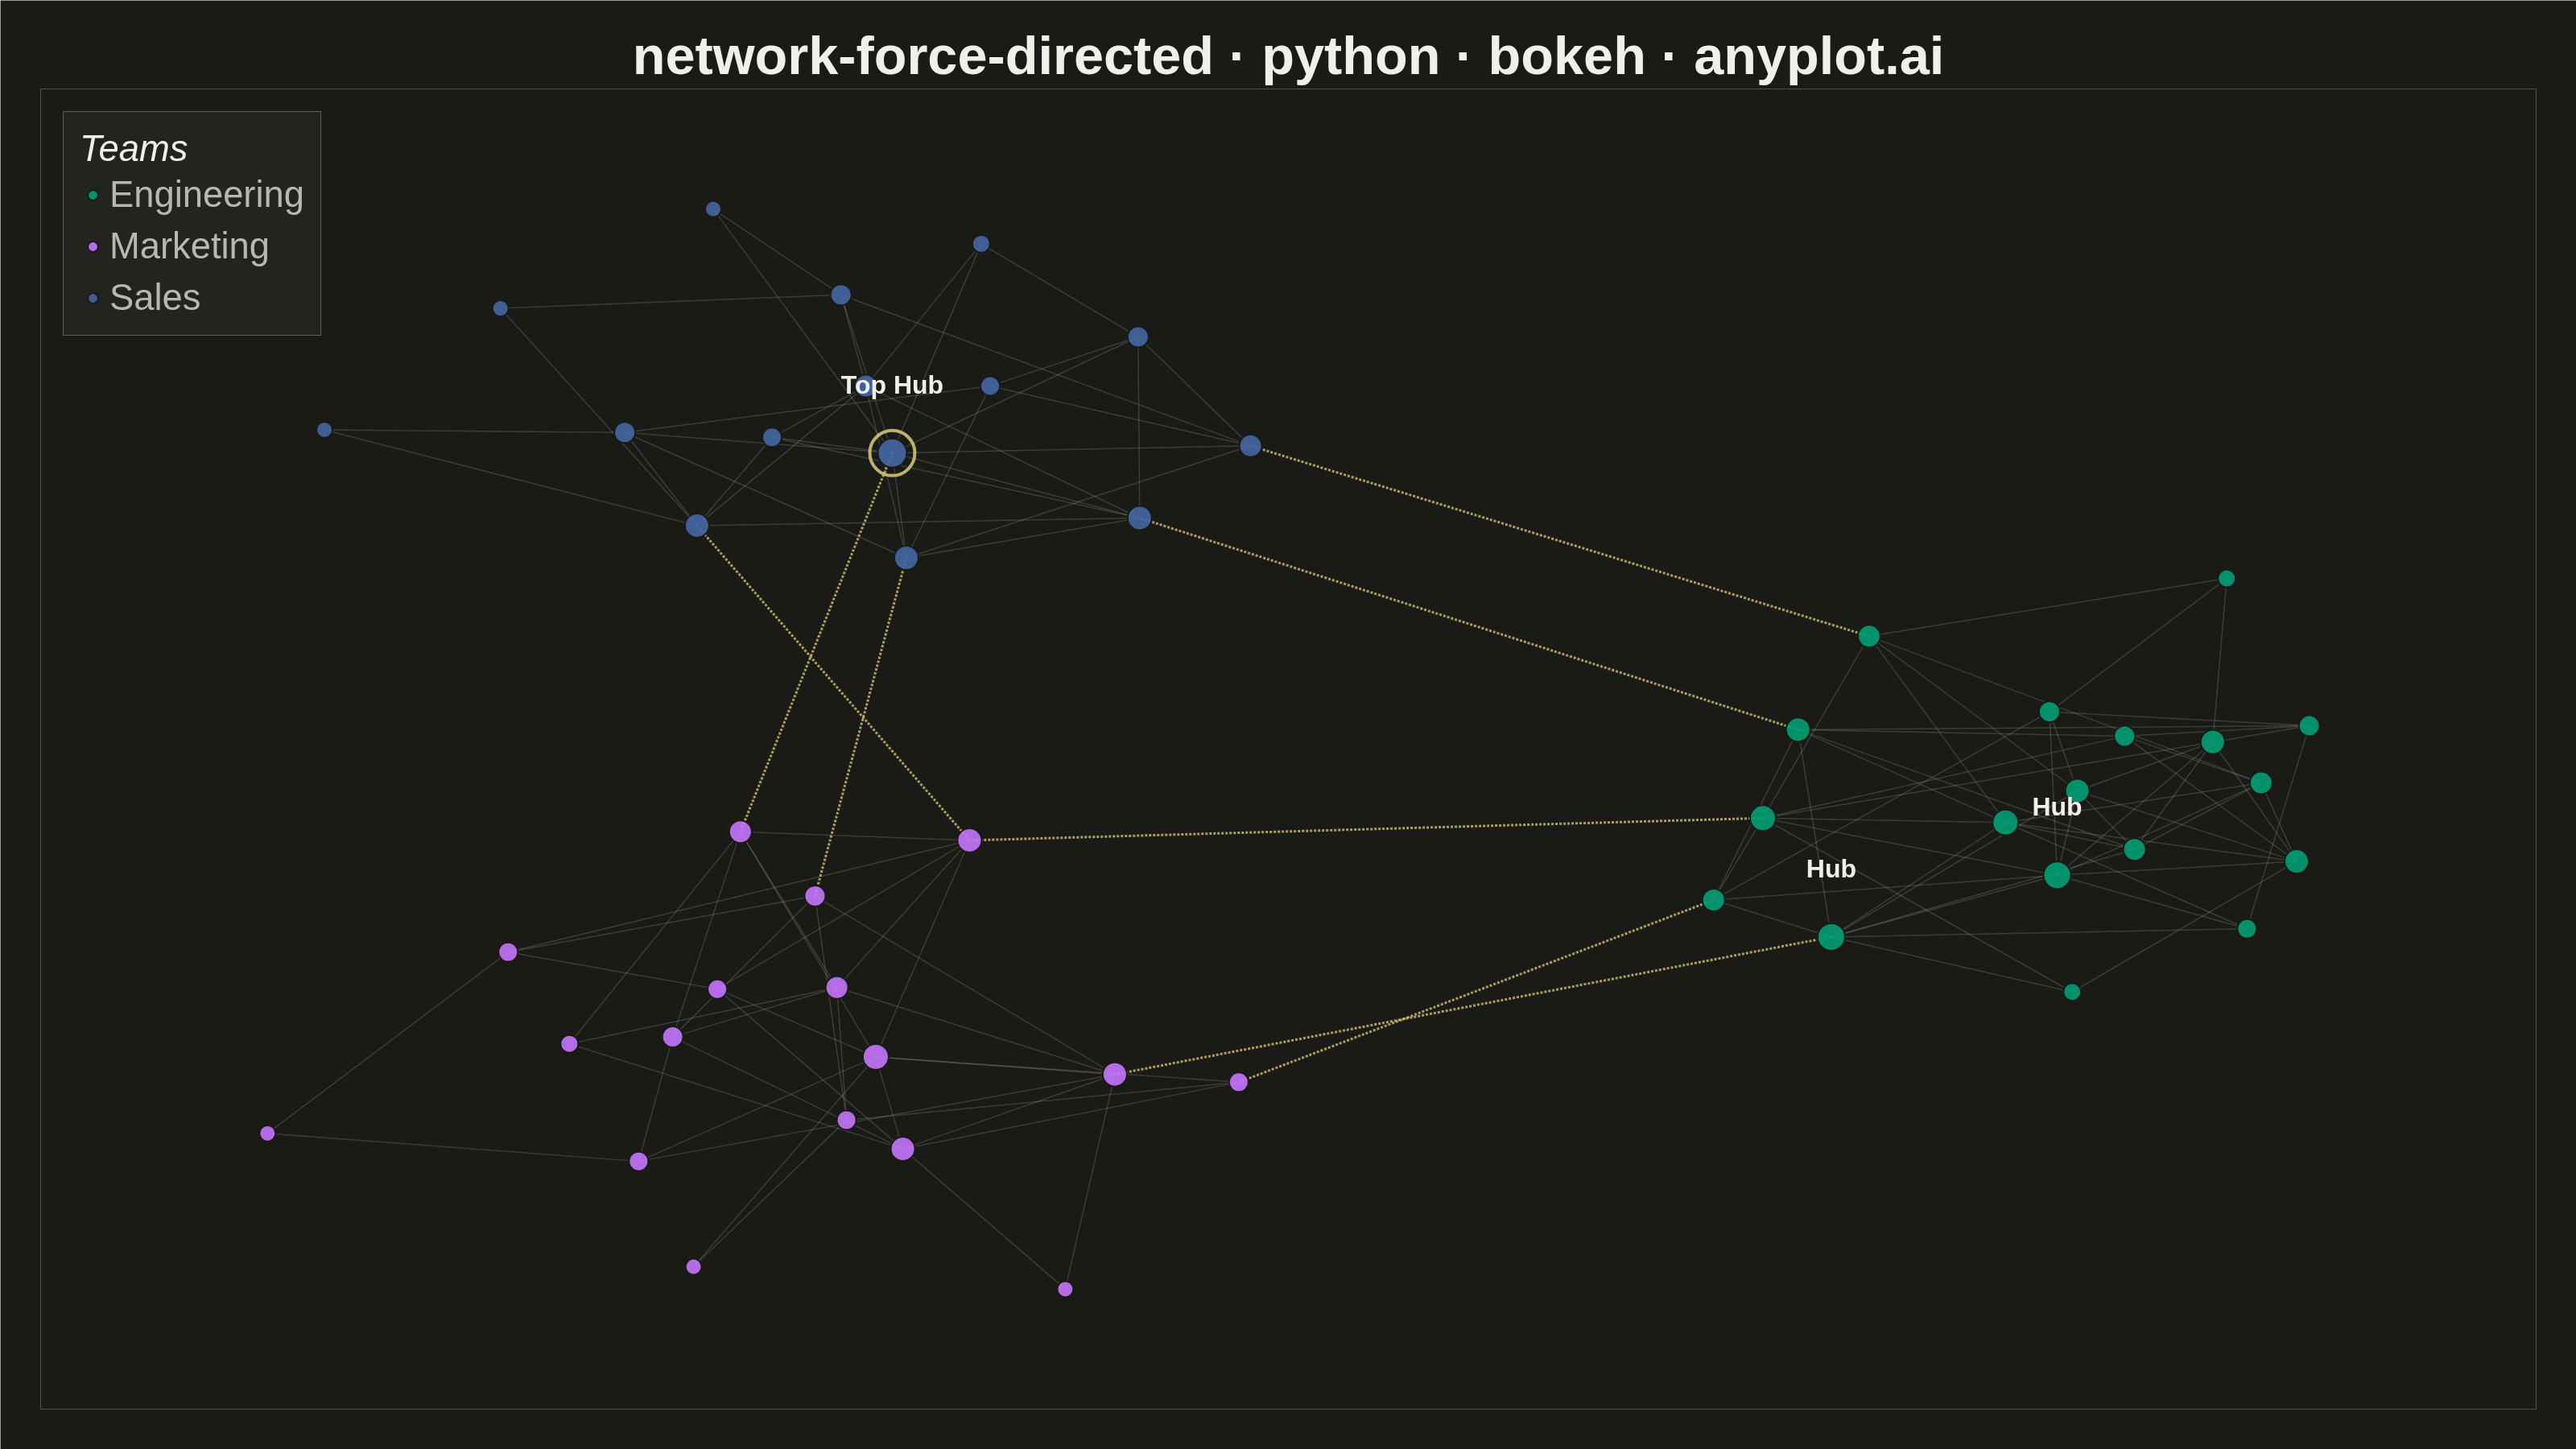
A force-directed graph uses physics simulation to position nodes, where connected nodes attract each other and all nodes repel. This creates organic layouts that naturally reveal community structure, central nodes, and overall network topology without manual positioning. The algorithm balances attractive forces (edges pulling connected nodes together) and repulsive forces (nodes pushing apart) until reaching equilibrium.
""" anyplot.ai
network-force-directed: Force-Directed Graph
Library: bokeh 3.9.1 | Python 3.13.14
Quality: 87/100 | Updated: 2026-07-01
"""

# Remove the script's own directory from sys.path so 'bokeh.py' doesn't shadow
# the installed bokeh package (this file is named bokeh.py).
import os as _os
import sys as _sys


_script_dir = _os.path.dirname(_os.path.abspath(__file__))
_sys.path = [p for p in _sys.path if _os.path.abspath(p or ".") != _script_dir]
del _sys, _os

import os
import time
from pathlib import Path

import numpy as np
from bokeh.io import output_file, save
from bokeh.models import ColumnDataSource, HoverTool
from bokeh.plotting import figure
from selenium import webdriver
from selenium.webdriver.chrome.options import Options


# Theme tokens
THEME = os.getenv("ANYPLOT_THEME", "light")
PAGE_BG = "#FAF8F1" if THEME == "light" else "#1A1A17"
ELEVATED_BG = "#FFFDF6" if THEME == "light" else "#242420"
INK = "#1A1A17" if THEME == "light" else "#F0EFE8"
INK_SOFT = "#4A4A44" if THEME == "light" else "#B8B7B0"

# Imprint palette — positions 1, 2, 3 for the three communities
IMPRINT_PALETTE = ["#009E73", "#C475FD", "#4467A3", "#BD8233", "#AE3030", "#2ABCCD", "#954477", "#99B314"]
ANYPLOT_AMBER = "#DDCC77"  # bridge edges — cross-community connections

# Data — 50-node company social network with 3 communities
np.random.seed(42)

community_sizes = [18, 17, 15]
community_names = ["Engineering", "Marketing", "Sales"]
community_colors = [IMPRINT_PALETTE[0], IMPRINT_PALETTE[1], IMPRINT_PALETTE[2]]

nodes = []
node_id = 0
for comm_idx, size in enumerate(community_sizes):
    for _ in range(size):
        nodes.append({"id": node_id, "community": comm_idx})
        node_id += 1

# Intra-community edges (dense within each team)
boundaries = [0, 18, 35, 50]
intra_edges = []
for c in range(3):
    start, end = boundaries[c], boundaries[c + 1]
    for i in range(start, end):
        for j in range(i + 1, end):
            if np.random.random() < 0.3:
                intra_edges.append((i, j))

# Inter-community bridge edges (sparse — highlight cross-team links)
bridge_edges = [(0, 18), (5, 20), (10, 25), (18, 35), (22, 40), (30, 45), (8, 38), (15, 48)]
all_edges = intra_edges + bridge_edges

# Force-directed layout (Fruchterman-Reingold)
n = len(nodes)
positions = np.random.rand(n, 2) * 2 - 1
k = 0.5
iterations = 200

for iteration in range(iterations):
    displacement = np.zeros((n, 2))
    for i in range(n):
        for j in range(i + 1, n):
            diff = positions[i] - positions[j]
            dist = max(np.linalg.norm(diff), 0.01)
            repulsive = (k * k / dist) * (diff / dist)
            displacement[i] += repulsive
            displacement[j] -= repulsive
    for src, tgt in all_edges:
        diff = positions[src] - positions[tgt]
        dist = max(np.linalg.norm(diff), 0.01)
        attractive = (dist * dist / k) * (diff / dist)
        displacement[src] -= attractive
        displacement[tgt] += attractive
    temperature = 1 - iteration / iterations
    for i in range(n):
        d = np.linalg.norm(displacement[i])
        if d > 0:
            positions[i] += (displacement[i] / d) * min(d, 0.15 * temperature)

# Normalize positions to [0.05, 0.95]
pos_min = positions.min(axis=0)
pos_max = positions.max(axis=0)
positions = (positions - pos_min) / (pos_max - pos_min + 1e-6) * 0.9 + 0.05
pos = {node["id"]: positions[i] for i, node in enumerate(nodes)}

# Node degrees
degrees = {node["id"]: 0 for node in nodes}
for src, tgt in all_edges:
    degrees[src] += 1
    degrees[tgt] += 1

# Figure — canonical 3200×1800 landscape, toolbar disabled for correct PNG dimensions
p = figure(
    width=3200,
    height=1800,
    title="network-force-directed · python · bokeh · anyplot.ai",
    x_range=(-0.05, 1.05),
    y_range=(-0.05, 1.05),
    toolbar_location=None,
    background_fill_color=PAGE_BG,
    border_fill_color=PAGE_BG,
    min_border_bottom=50,
    min_border_left=50,
    min_border_top=110,
    min_border_right=50,
)

p.title.text_font_size = "50pt"
p.title.text_color = INK
p.title.align = "center"
p.axis.visible = False
p.grid.visible = False
p.outline_line_color = None

# Intra-community edges — subtle, thin
p.segment(
    x0=[pos[src][0] for src, _ in intra_edges],
    y0=[pos[src][1] for src, _ in intra_edges],
    x1=[pos[tgt][0] for _, tgt in intra_edges],
    y1=[pos[tgt][1] for _, tgt in intra_edges],
    line_color=INK_SOFT,
    line_alpha=0.22,
    line_width=1.5,
)

# Bridge edges — amber, dashed, more prominent to show cross-team connections
p.segment(
    x0=[pos[src][0] for src, _ in bridge_edges],
    y0=[pos[src][1] for src, _ in bridge_edges],
    x1=[pos[tgt][0] for _, tgt in bridge_edges],
    y1=[pos[tgt][1] for _, tgt in bridge_edges],
    line_color=ANYPLOT_AMBER,
    line_alpha=0.75,
    line_width=3.0,
    line_dash="dashed",
)

# Nodes — one renderer per community for legend and hover
node_renderers = []
for comm_idx, color, name in zip(range(3), community_colors, community_names, strict=True):
    comm_nodes = [node for node in nodes if node["community"] == comm_idx]
    x_vals = [pos[node["id"]][0] for node in comm_nodes]
    y_vals = [pos[node["id"]][1] for node in comm_nodes]
    size_vals = [16 + degrees[node["id"]] * 2 for node in comm_nodes]
    degree_vals = [degrees[node["id"]] for node in comm_nodes]
    node_ids = [node["id"] for node in comm_nodes]

    source = ColumnDataSource(
        data={
            "x": x_vals,
            "y": y_vals,
            "size": size_vals,
            "degree": degree_vals,
            "node_id": node_ids,
            "team": [name] * len(comm_nodes),
        }
    )

    renderer = p.scatter(
        x="x",
        y="y",
        size="size",
        source=source,
        fill_color=color,
        fill_alpha=0.9,
        line_color=PAGE_BG,
        line_width=2,
        legend_label=name,
    )
    node_renderers.append(renderer)

# Hover tool scoped to node renderers
p.add_tools(
    HoverTool(
        renderers=node_renderers, tooltips=[("Team", "@team"), ("Node ID", "@node_id"), ("Connections", "@degree")]
    )
)

# Spotlight — draw a glow ring around the single highest-degree hub node
top_hub_id = max(degrees, key=degrees.get)
top_hub_x = pos[top_hub_id][0]
top_hub_y = pos[top_hub_id][1]
top_hub_size = 16 + degrees[top_hub_id] * 2
p.scatter(
    x=[top_hub_x],
    y=[top_hub_y],
    size=[top_hub_size + 20],
    fill_color=None,
    line_color=ANYPLOT_AMBER,
    line_width=4,
    line_alpha=0.85,
)

# Hub labels — threshold 9 keeps only the top hubs to avoid label crowding
hub_x, hub_y, hub_labels = [], [], []
for node in nodes:
    if degrees[node["id"]] >= 9:
        hub_x.append(pos[node["id"]][0])
        hub_y.append(pos[node["id"]][1] + 0.045)
        hub_labels.append("Top Hub" if node["id"] == top_hub_id else "Hub")

if hub_x:
    hub_source = ColumnDataSource(data={"x": hub_x, "y": hub_y, "text": hub_labels})
    p.text(
        x="x",
        y="y",
        text="text",
        source=hub_source,
        text_font_size="24pt",
        text_font_style="bold",
        text_align="center",
        text_baseline="bottom",
        text_color=INK,
    )

# Legend — inside plot frame, top-left
p.legend.title = "Teams"
p.legend.location = "top_left"
p.legend.label_text_font_size = "34pt"
p.legend.title_text_font_size = "34pt"
p.legend.label_text_color = INK_SOFT
p.legend.title_text_color = INK
p.legend.background_fill_color = ELEVATED_BG
p.legend.background_fill_alpha = 0.95
p.legend.border_line_color = INK_SOFT
p.legend.border_line_alpha = 0.4
p.legend.spacing = 12
p.legend.padding = 20
p.legend.margin = 28
p.legend.glyph_height = 32
p.legend.glyph_width = 32

# Save HTML (interactive artifact)
output_file(f"plot-{THEME}.html", title="network-force-directed · python · bokeh · anyplot.ai")
save(p)

# Screenshot via headless Chrome — CDP sets exact viewport (set_window_size alone is insufficient)
W, H = 3200, 1800
opts = Options()
for arg in (
    "--headless=new",
    "--no-sandbox",
    "--disable-dev-shm-usage",
    "--disable-gpu",
    f"--window-size={W},{H}",
    "--hide-scrollbars",
):
    opts.add_argument(arg)
driver = webdriver.Chrome(options=opts)
driver.execute_cdp_cmd(
    "Emulation.setDeviceMetricsOverride", {"width": W, "height": H, "deviceScaleFactor": 1, "mobile": False}
)
driver.get(f"file://{Path(f'plot-{THEME}.html').resolve()}")
time.sleep(3)
driver.save_screenshot(f"plot-{THEME}.png")
driver.quit()
Runnable source as JSON, for any HTTP client: https://api.anyplot.ai/specs/network-force-directed/bokeh/code. Any spec id and library id listed in llms-full.txt fit the same URL shape; every URL below is complete and callable.
{
  "spec_id": "network-force-directed",
  "language": "python",
  "library": "bokeh",
  "page": "https://anyplot.ai/network-force-directed/python/bokeh",
  "hub": "https://anyplot.ai/network-force-directed",
  "code_json": "https://api.anyplot.ai/specs/network-force-directed/bokeh/code",
  "spec_json": "https://api.anyplot.ai/specs/network-force-directed",
  "render_light_png": "https://storage.googleapis.com/anyplot-images/plots/network-force-directed/python/bokeh/plot-light.png",
  "render_dark_png": "https://storage.googleapis.com/anyplot-images/plots/network-force-directed/python/bokeh/plot-dark.png",
  "interactive_light_html": "https://storage.googleapis.com/anyplot-images/plots/network-force-directed/python/bokeh/plot-light.html",
  "interactive_dark_html": "https://storage.googleapis.com/anyplot-images/plots/network-force-directed/python/bokeh/plot-dark.html",
  "quality_score": 87.0,
  "license": "MIT",
  "guide": "https://anyplot.ai/llms.txt"
}
Part of Force-Directed Graph on anyplot.ai.