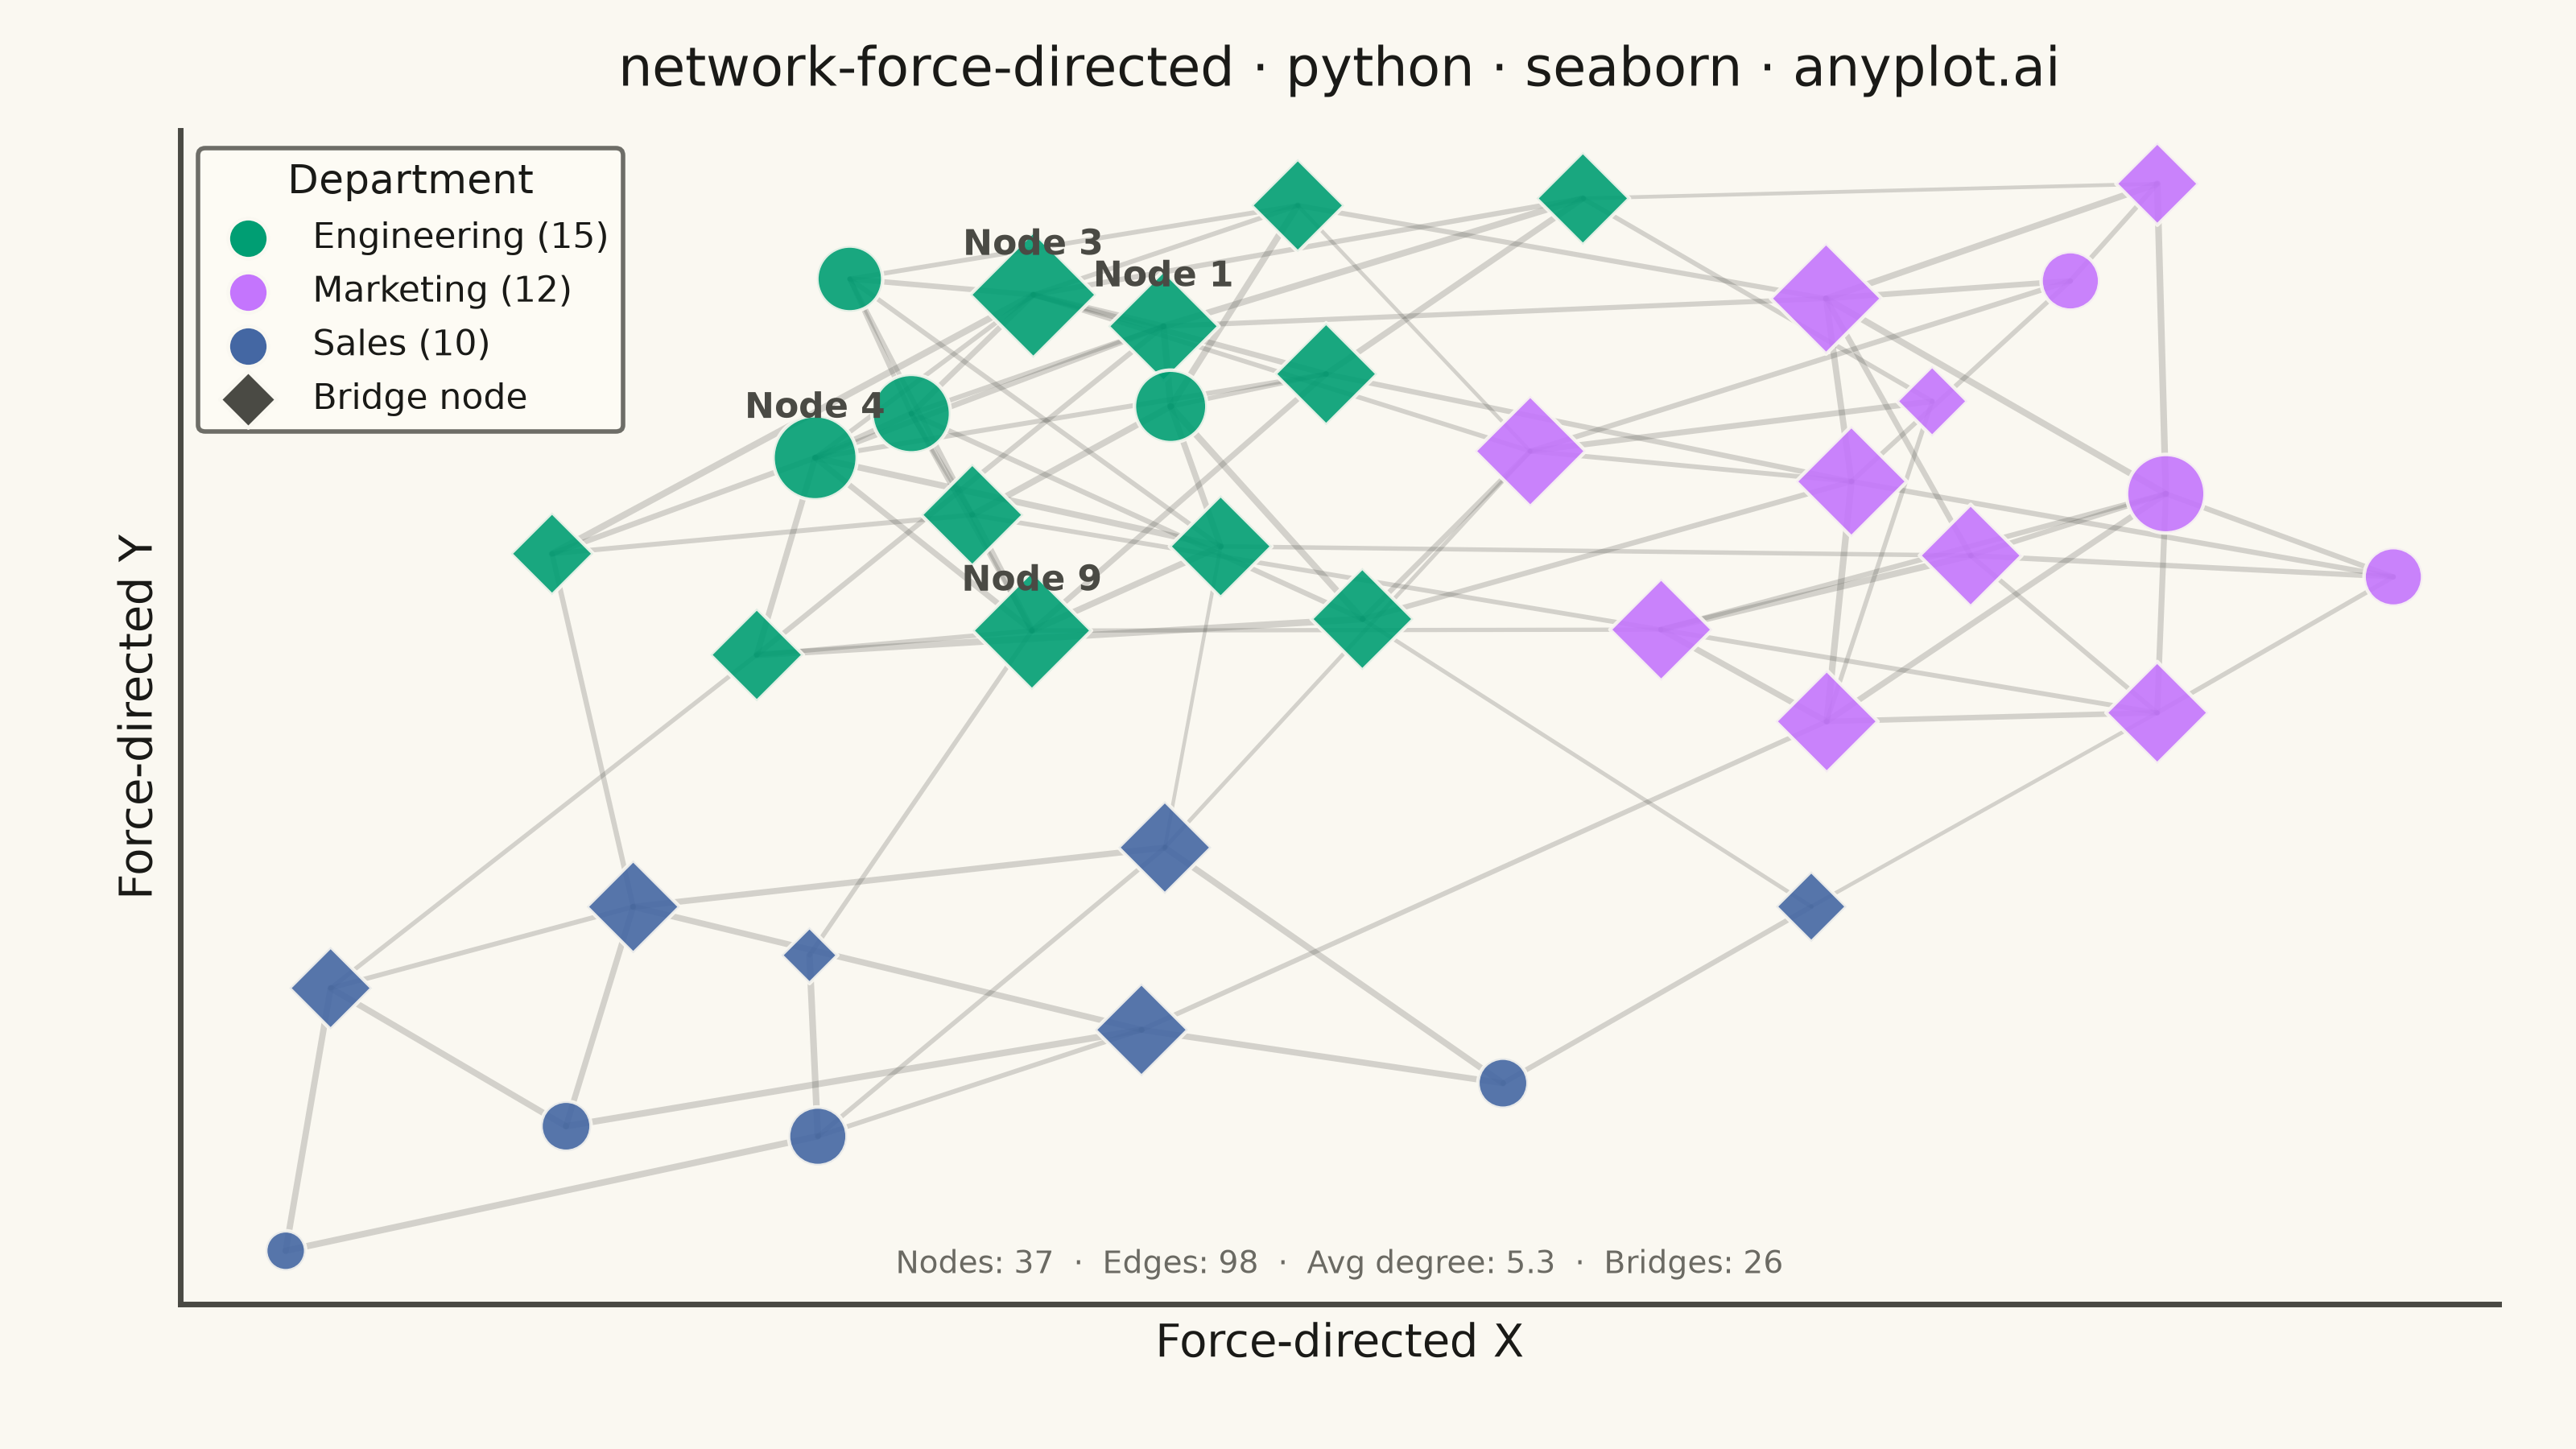
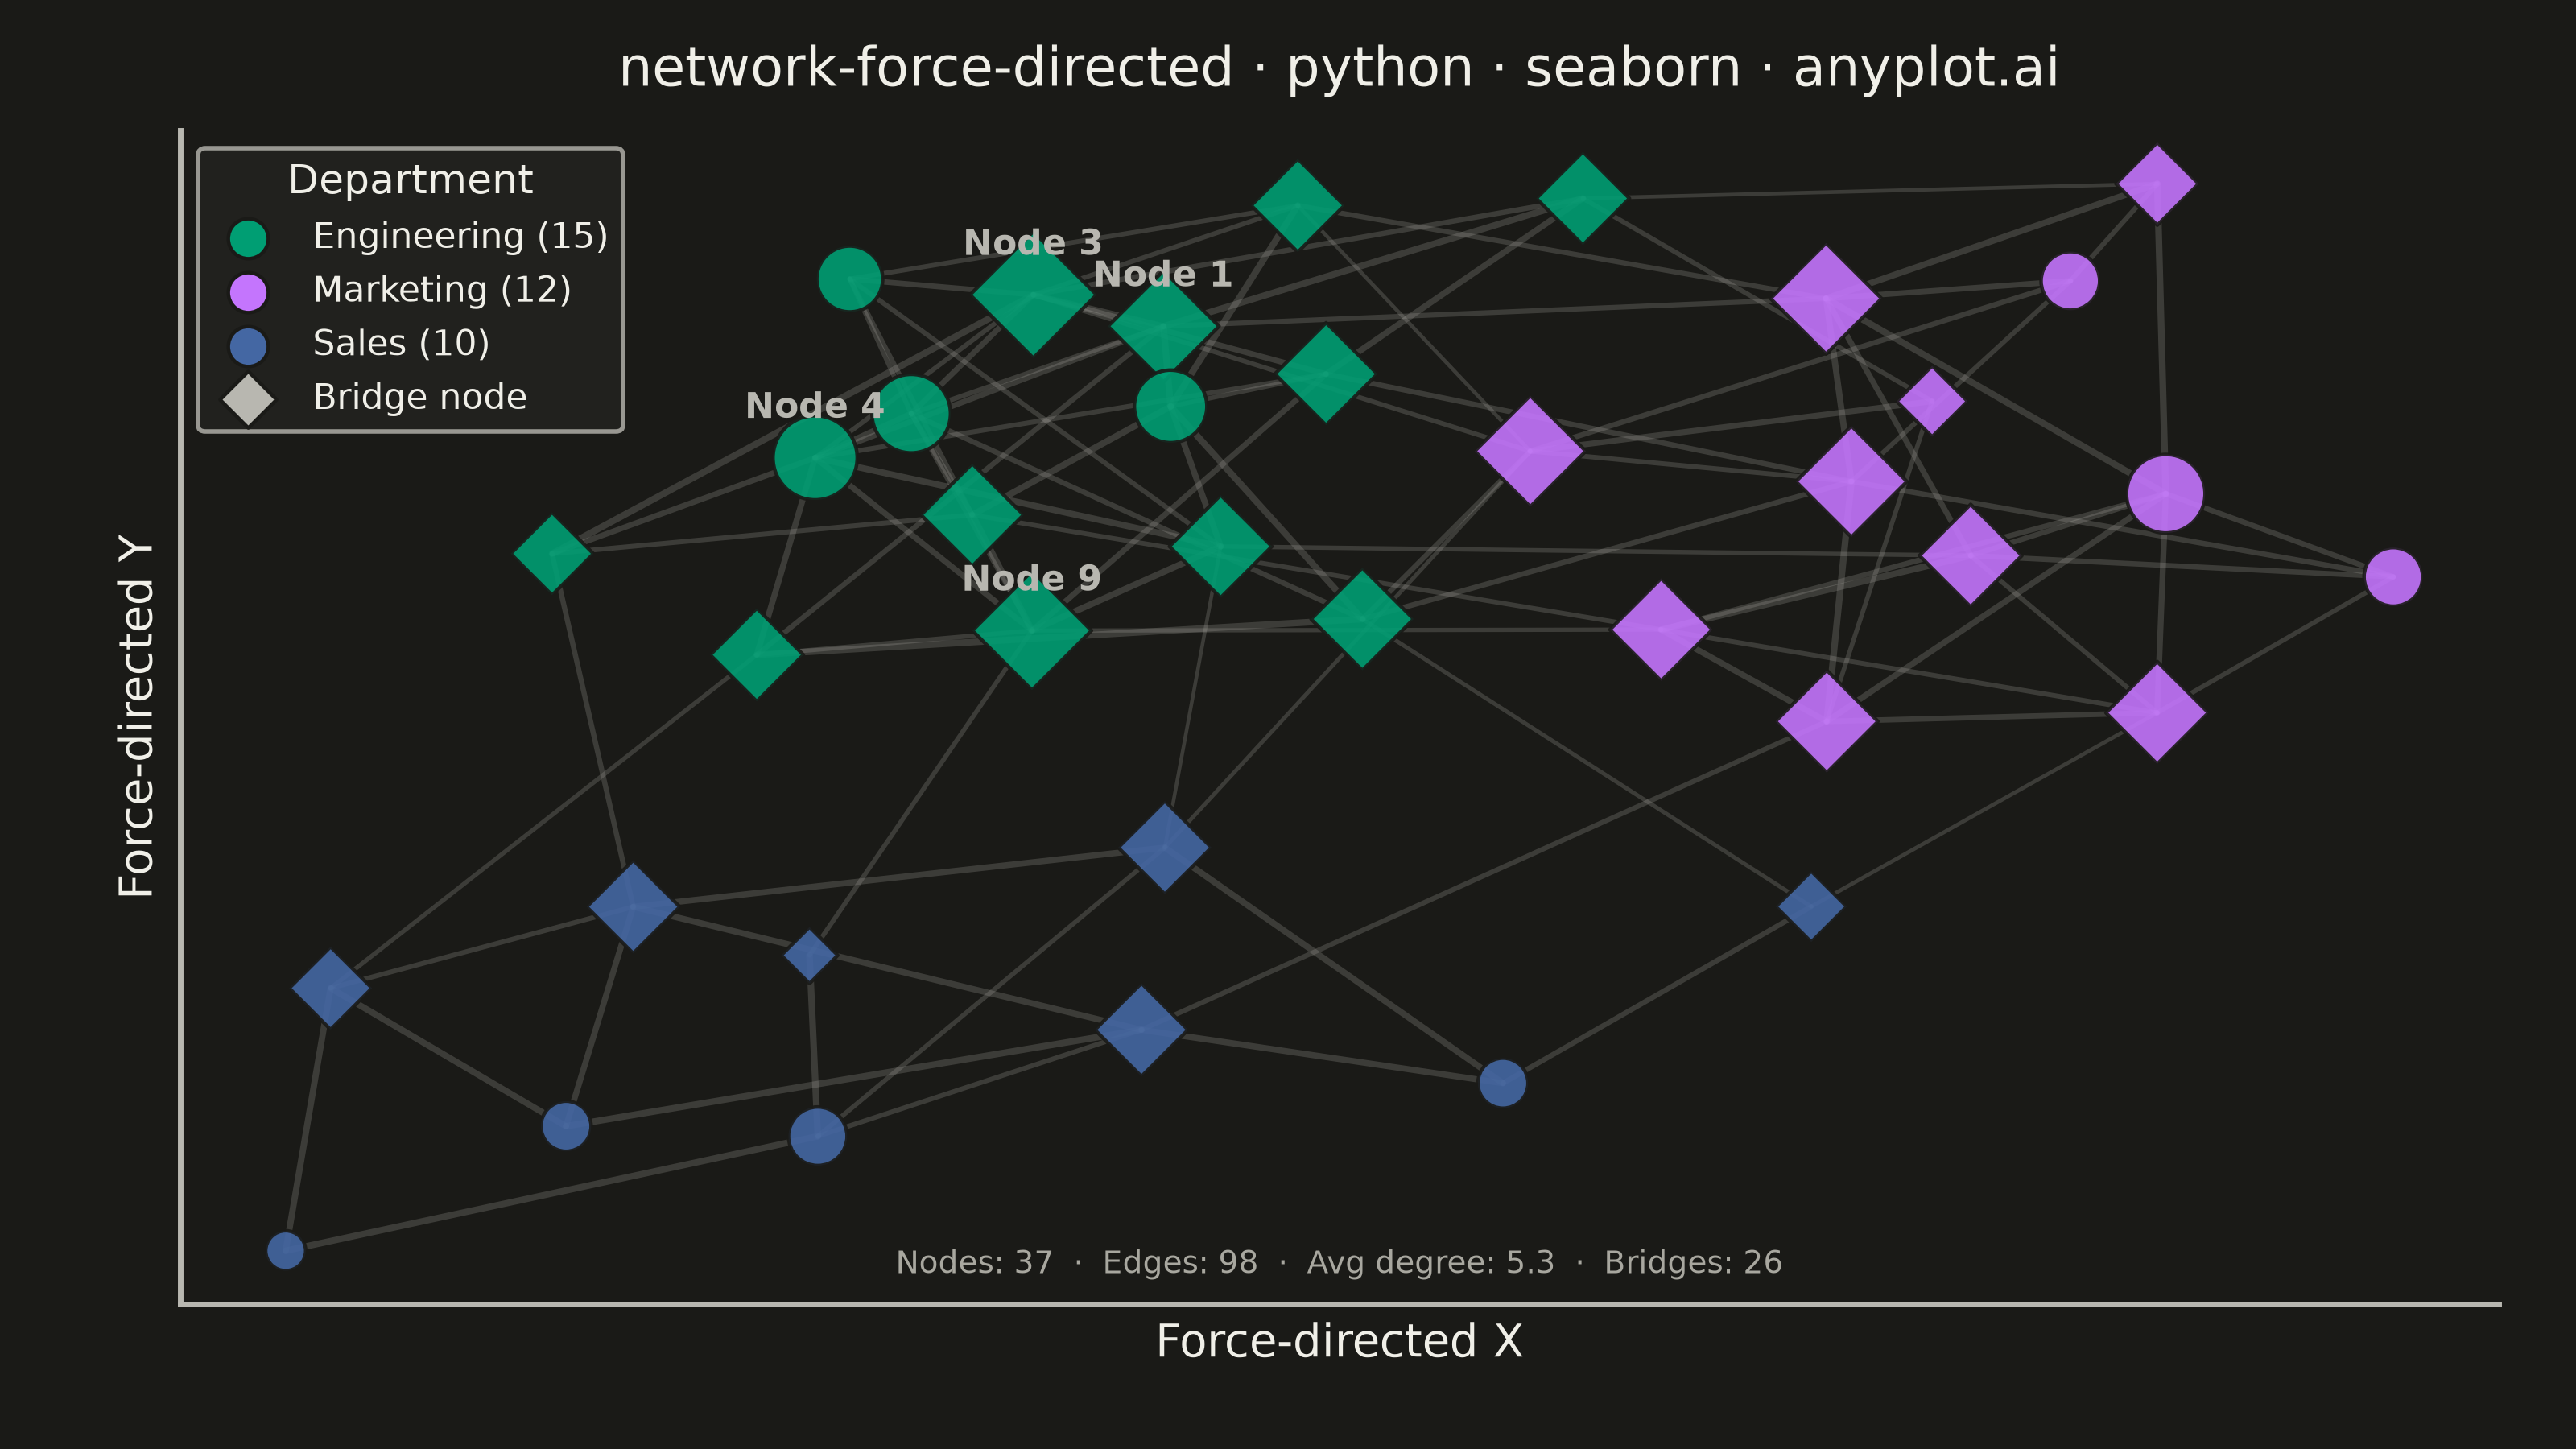
A force-directed graph uses physics simulation to position nodes, where connected nodes attract each other and all nodes repel. This creates organic layouts that naturally reveal community structure, central nodes, and overall network topology without manual positioning. The algorithm balances attractive forces (edges pulling connected nodes together) and repulsive forces (nodes pushing apart) until reaching equilibrium.
""" anyplot.ai
network-force-directed: Force-Directed Graph
Library: seaborn 0.13.2 | Python 3.13.14
Quality: 88/100 | Updated: 2026-07-01
"""

import os

import matplotlib.pyplot as plt
import numpy as np
import pandas as pd
import seaborn as sns


# Theme-adaptive chrome
THEME = os.getenv("ANYPLOT_THEME", "light")
PAGE_BG = "#FAF8F1" if THEME == "light" else "#1A1A17"
ELEVATED_BG = "#FFFDF6" if THEME == "light" else "#242420"
INK = "#1A1A17" if THEME == "light" else "#F0EFE8"
INK_SOFT = "#4A4A44" if THEME == "light" else "#B8B7B0"
INK_MUTED = "#6B6A63" if THEME == "light" else "#A8A79F"
EDGE_COLOR = "#4A4A44" if THEME == "light" else "#B8B7B0"

sns.set_theme(
    style="ticks",
    rc={
        "figure.facecolor": PAGE_BG,
        "axes.facecolor": PAGE_BG,
        "axes.edgecolor": INK_SOFT,
        "axes.labelcolor": INK,
        "text.color": INK,
        "xtick.color": INK_SOFT,
        "ytick.color": INK_SOFT,
        "grid.color": INK,
        "grid.alpha": 0.10,
        "legend.facecolor": ELEVATED_BG,
        "legend.edgecolor": INK_SOFT,
    },
)

np.random.seed(42)

# Imprint categorical palette — canonical order, first series always #009E73
IMPRINT = ["#009E73", "#C475FD", "#4467A3"]

# Data — organizational social network: 3 departments
num_nodes = 37
community_sizes = [15, 12, 10]
community_names = ["Engineering", "Marketing", "Sales"]
communities = []
for comm_idx, size in enumerate(community_sizes):
    communities.extend([comm_idx] * size)

# Generate edges with community structure
edges = []
for i in range(num_nodes):
    for j in range(i + 1, num_nodes):
        if communities[i] == communities[j]:
            if np.random.random() < 0.35:
                weight = np.random.uniform(0.5, 1.0)
                edges.append((i, j, weight))
        else:
            if np.random.random() < 0.05:
                weight = np.random.uniform(0.3, 0.7)
                edges.append((i, j, weight))

# Calculate node degrees
degrees = [0] * num_nodes
for src, tgt, _ in edges:
    degrees[src] += 1
    degrees[tgt] += 1

# Identify bridge nodes (cross-community edges)
bridge_nodes = set()
for src, tgt, _ in edges:
    if communities[src] != communities[tgt]:
        bridge_nodes.add(src)
        bridge_nodes.add(tgt)

# Force-directed layout (Fruchterman-Reingold inline)
n = num_nodes
k = 0.5
iterations = 150
pos = np.random.rand(n, 2) * 2 - 1
t = 1.0
dt = t / (iterations + 1)

for _ in range(iterations):
    disp = np.zeros((n, 2))
    for i in range(n):
        for j in range(i + 1, n):
            delta = pos[i] - pos[j]
            dist = max(np.linalg.norm(delta), 0.01)
            force = (k * k) / dist
            force_vec = (delta / dist) * force
            disp[i] += force_vec
            disp[j] -= force_vec
    for src, tgt, _ in edges:
        delta = pos[src] - pos[tgt]
        dist = max(np.linalg.norm(delta), 0.01)
        force = (dist * dist) / k
        force_vec = (delta / dist) * force
        disp[src] -= force_vec
        disp[tgt] += force_vec
    for i in range(n):
        disp_norm = max(np.linalg.norm(disp[i]), 0.01)
        pos[i] += (disp[i] / disp_norm) * min(disp_norm, t)
    t -= dt

# Normalize positions to [-1, 1]
pos -= pos.mean(axis=0)
max_coord = np.abs(pos).max()
if max_coord > 0:
    pos /= max_coord

x_coords = pos[:, 0]
y_coords = pos[:, 1]

# Node DataFrame for seaborn three-way encoding (hue + size + style)
node_df = pd.DataFrame(
    {
        "x": x_coords,
        "y": y_coords,
        "department": [community_names[c] for c in communities],
        "degree": degrees,
        "node_type": ["Bridge" if i in bridge_nodes else "Member" for i in range(num_nodes)],
    }
)

# Plot — 3200×1800 px landscape (figsize=(8,4.5) × dpi=400)
fig, ax = plt.subplots(figsize=(8, 4.5), dpi=400, facecolor=PAGE_BG)
ax.set_facecolor(PAGE_BG)

# Edges
for src, tgt, weight in edges:
    x0, y0 = pos[src]
    x1, y1 = pos[tgt]
    ax.plot([x0, x1], [y0, y1], color=EDGE_COLOR, linewidth=0.5 + weight * 1.0, alpha=0.22, zorder=1)

# Nodes via seaborn three-way encoding: hue=department, size=degree, style=node_type
# Diamond markers distinguish bridge nodes (cross-community connectors) from regular members
palette = {name: IMPRINT[i] for i, name in enumerate(community_names)}
sns.scatterplot(
    data=node_df,
    x="x",
    y="y",
    hue="department",
    hue_order=community_names,
    palette=palette,
    size="degree",
    sizes=(80, 400),
    style="node_type",
    style_order=["Member", "Bridge"],
    markers={"Member": "o", "Bridge": "D"},
    alpha=0.90,
    edgecolor=PAGE_BG,
    linewidth=0.8,
    ax=ax,
    legend=False,
    zorder=2,
)

# Label top 4 hubs by degree only — prevents center-cluster label overlap
top_hubs = sorted(range(num_nodes), key=lambda i: degrees[i], reverse=True)[:4]
for node in top_hubs:
    ax.annotate(
        f"Node {node}",
        (pos[node, 0], pos[node, 1]),
        fontsize=8,
        ha="center",
        va="bottom",
        xytext=(0, 7),
        textcoords="offset points",
        fontweight="bold",
        color=INK_SOFT,
    )

# Legend — departments (circle) + bridge node indicator (diamond)
legend_elements = []
for idx, name in enumerate(community_names):
    count = community_sizes[idx]
    legend_elements.append(
        plt.scatter(
            [], [], c=IMPRINT[idx], s=80, marker="o", label=f"{name} ({count})", edgecolor=PAGE_BG, linewidth=0.8
        )
    )
legend_elements.append(
    plt.scatter([], [], c=INK_SOFT, s=80, marker="D", edgecolor=PAGE_BG, linewidth=0.8, label="Bridge node")
)

ax.legend(
    handles=legend_elements,
    loc="upper left",
    fontsize=8,
    title="Department",
    title_fontsize=9,
    frameon=True,
    labelcolor=INK,
)

# Network summary inside the axes (bottom centre)
total_edges = len(edges)
avg_degree = sum(degrees) / num_nodes
stats_text = (
    f"Nodes: {num_nodes}  ·  Edges: {total_edges}  ·  Avg degree: {avg_degree:.1f}  ·  Bridges: {len(bridge_nodes)}"
)
ax.text(0.5, 0.02, stats_text, transform=ax.transAxes, fontsize=7, ha="center", va="bottom", color=INK_MUTED)

# Style
title = "network-force-directed · python · seaborn · anyplot.ai"
ax.set_title(title, fontsize=12, fontweight="medium", pad=10, color=INK)
ax.set_xlabel("Force-directed X", fontsize=10, color=INK)
ax.set_ylabel("Force-directed Y", fontsize=10, color=INK)
ax.set_xticks([])
ax.set_yticks([])
ax.spines["top"].set_visible(False)
ax.spines["right"].set_visible(False)
ax.spines["left"].set_color(INK_SOFT)
ax.spines["bottom"].set_color(INK_SOFT)

plt.subplots_adjust(left=0.07, right=0.97, top=0.91, bottom=0.10)
plt.savefig(f"plot-{THEME}.png", dpi=400, facecolor=PAGE_BG)
Runnable source as JSON, for any HTTP client: https://api.anyplot.ai/specs/network-force-directed/seaborn/code. Any spec id and library id listed in llms-full.txt fit the same URL shape; every URL below is complete and callable.
{
  "spec_id": "network-force-directed",
  "language": "python",
  "library": "seaborn",
  "page": "https://anyplot.ai/network-force-directed/python/seaborn",
  "hub": "https://anyplot.ai/network-force-directed",
  "code_json": "https://api.anyplot.ai/specs/network-force-directed/seaborn/code",
  "spec_json": "https://api.anyplot.ai/specs/network-force-directed",
  "render_light_png": "https://storage.googleapis.com/anyplot-images/plots/network-force-directed/python/seaborn/plot-light.png",
  "render_dark_png": "https://storage.googleapis.com/anyplot-images/plots/network-force-directed/python/seaborn/plot-dark.png",
  "quality_score": 88.0,
  "license": "MIT",
  "guide": "https://anyplot.ai/llms.txt"
}
Part of Force-Directed Graph on anyplot.ai.