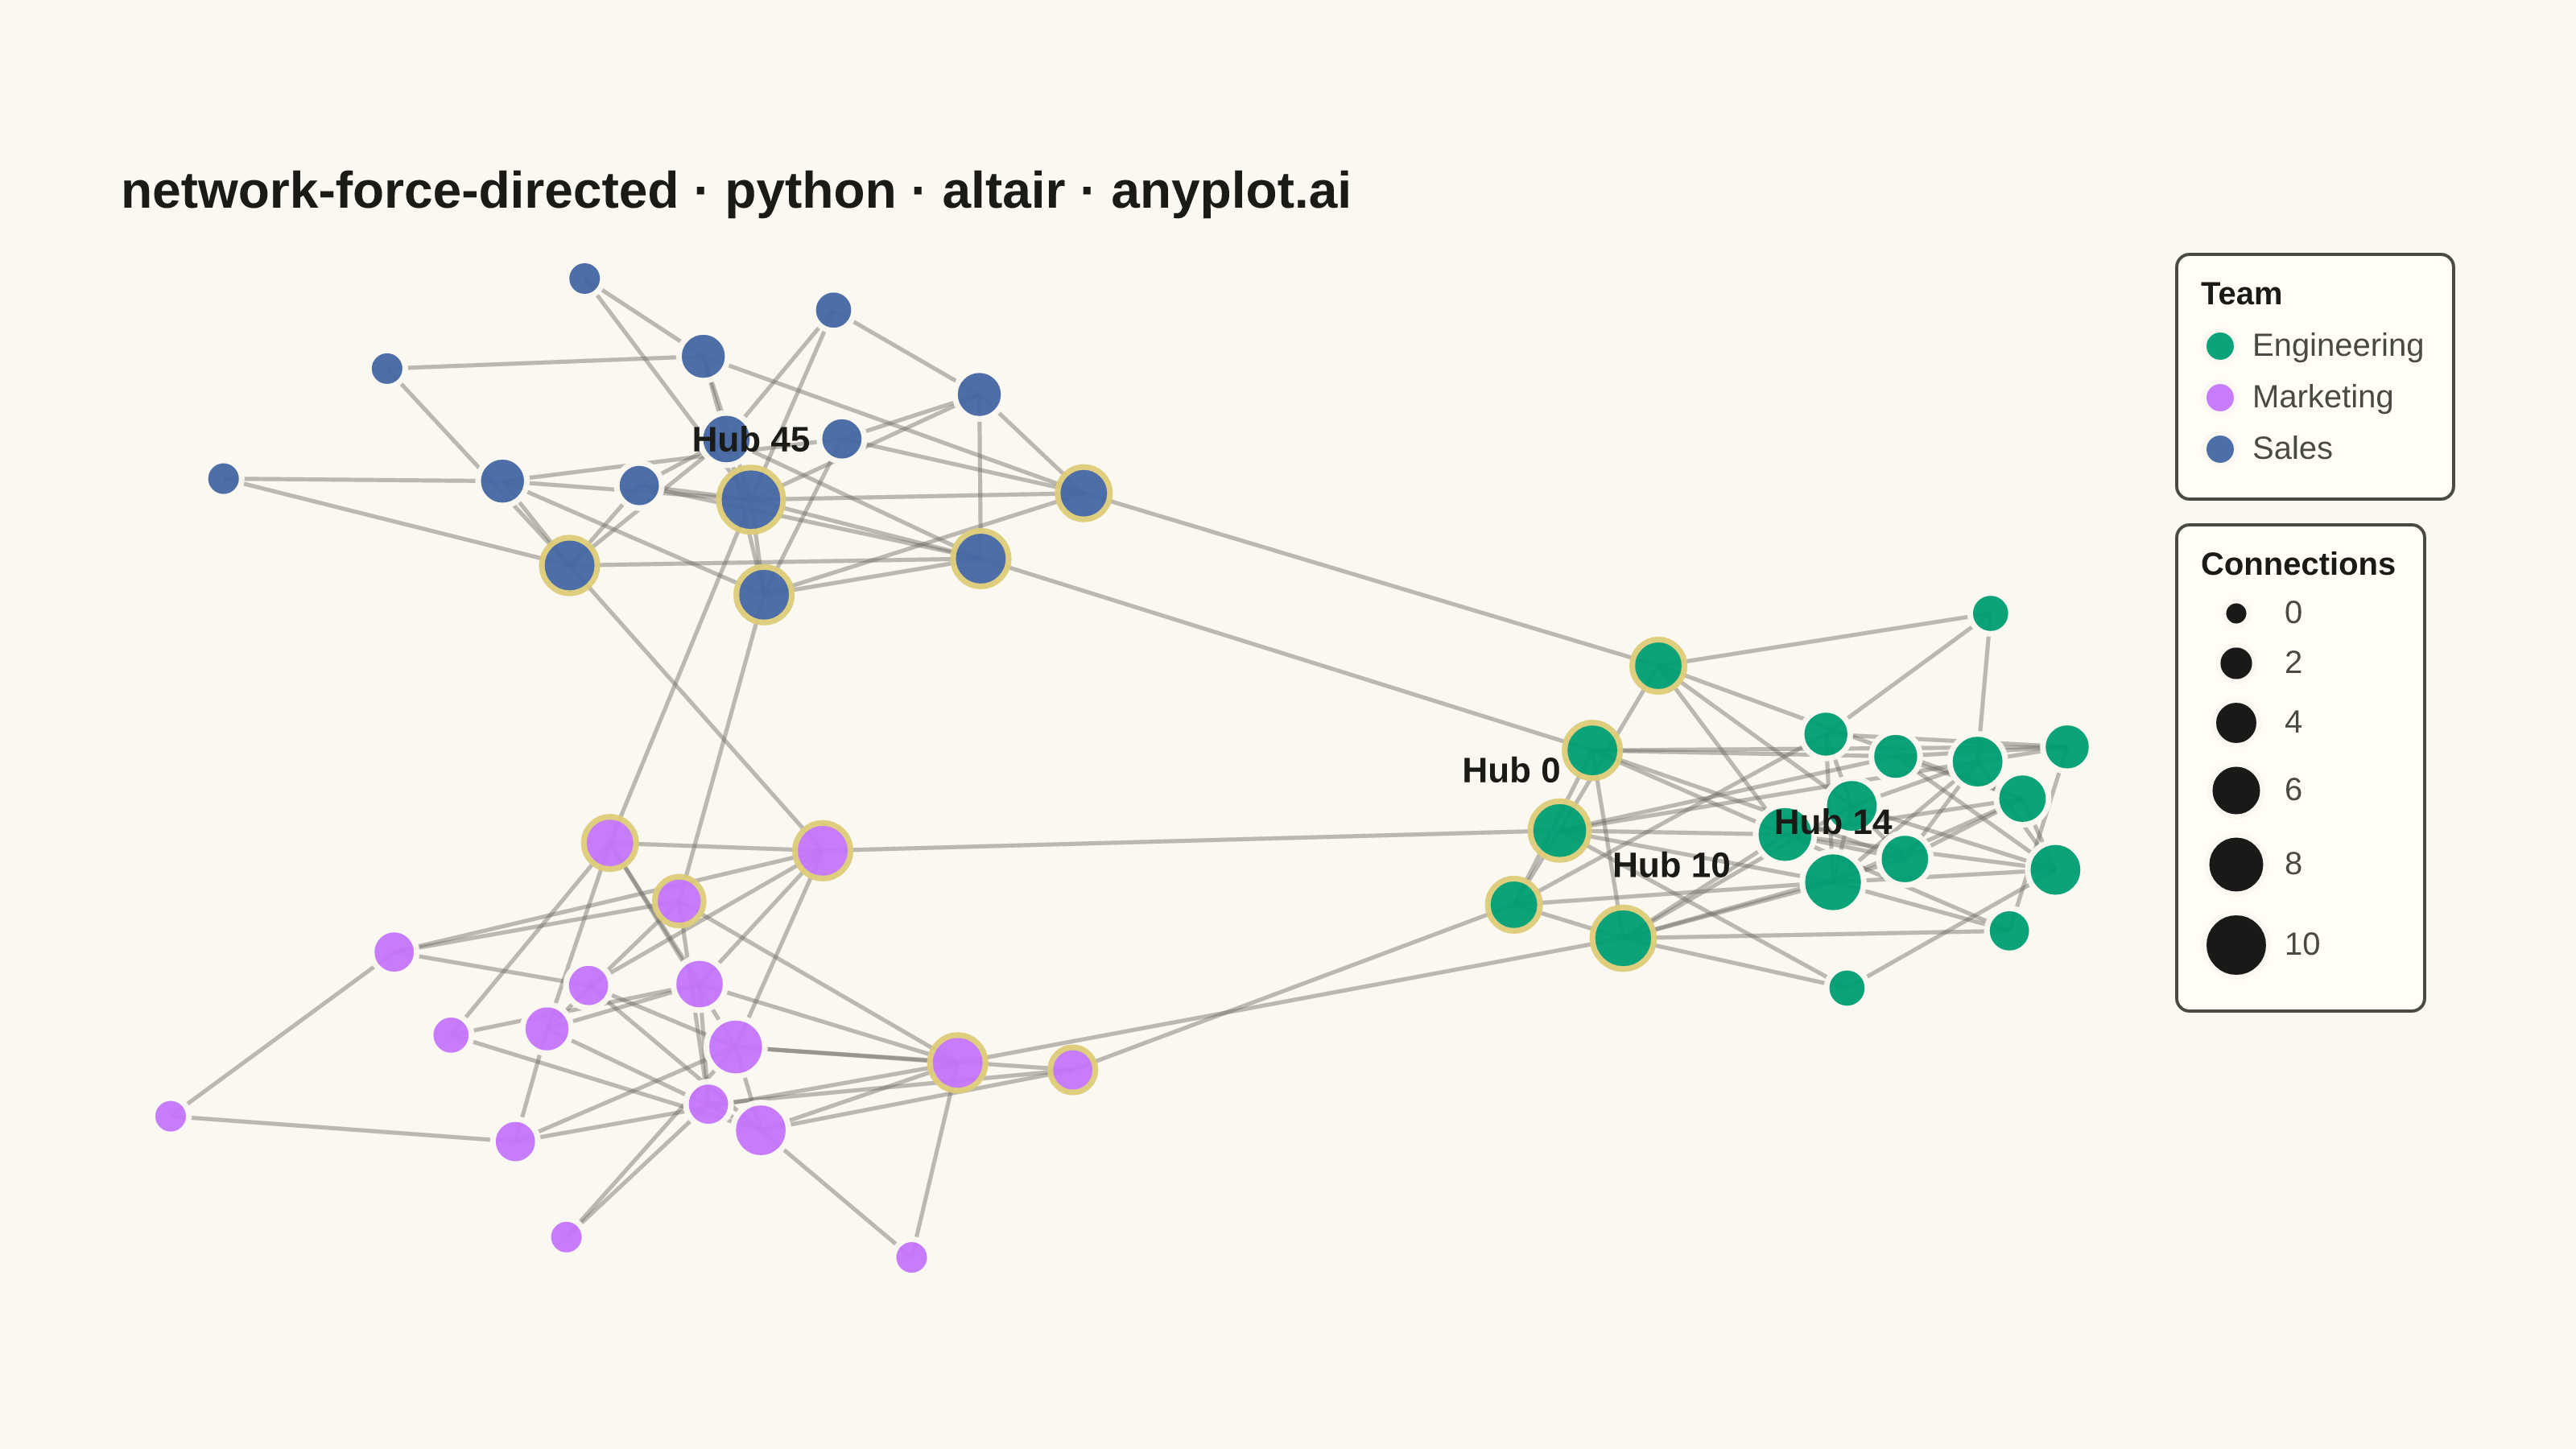
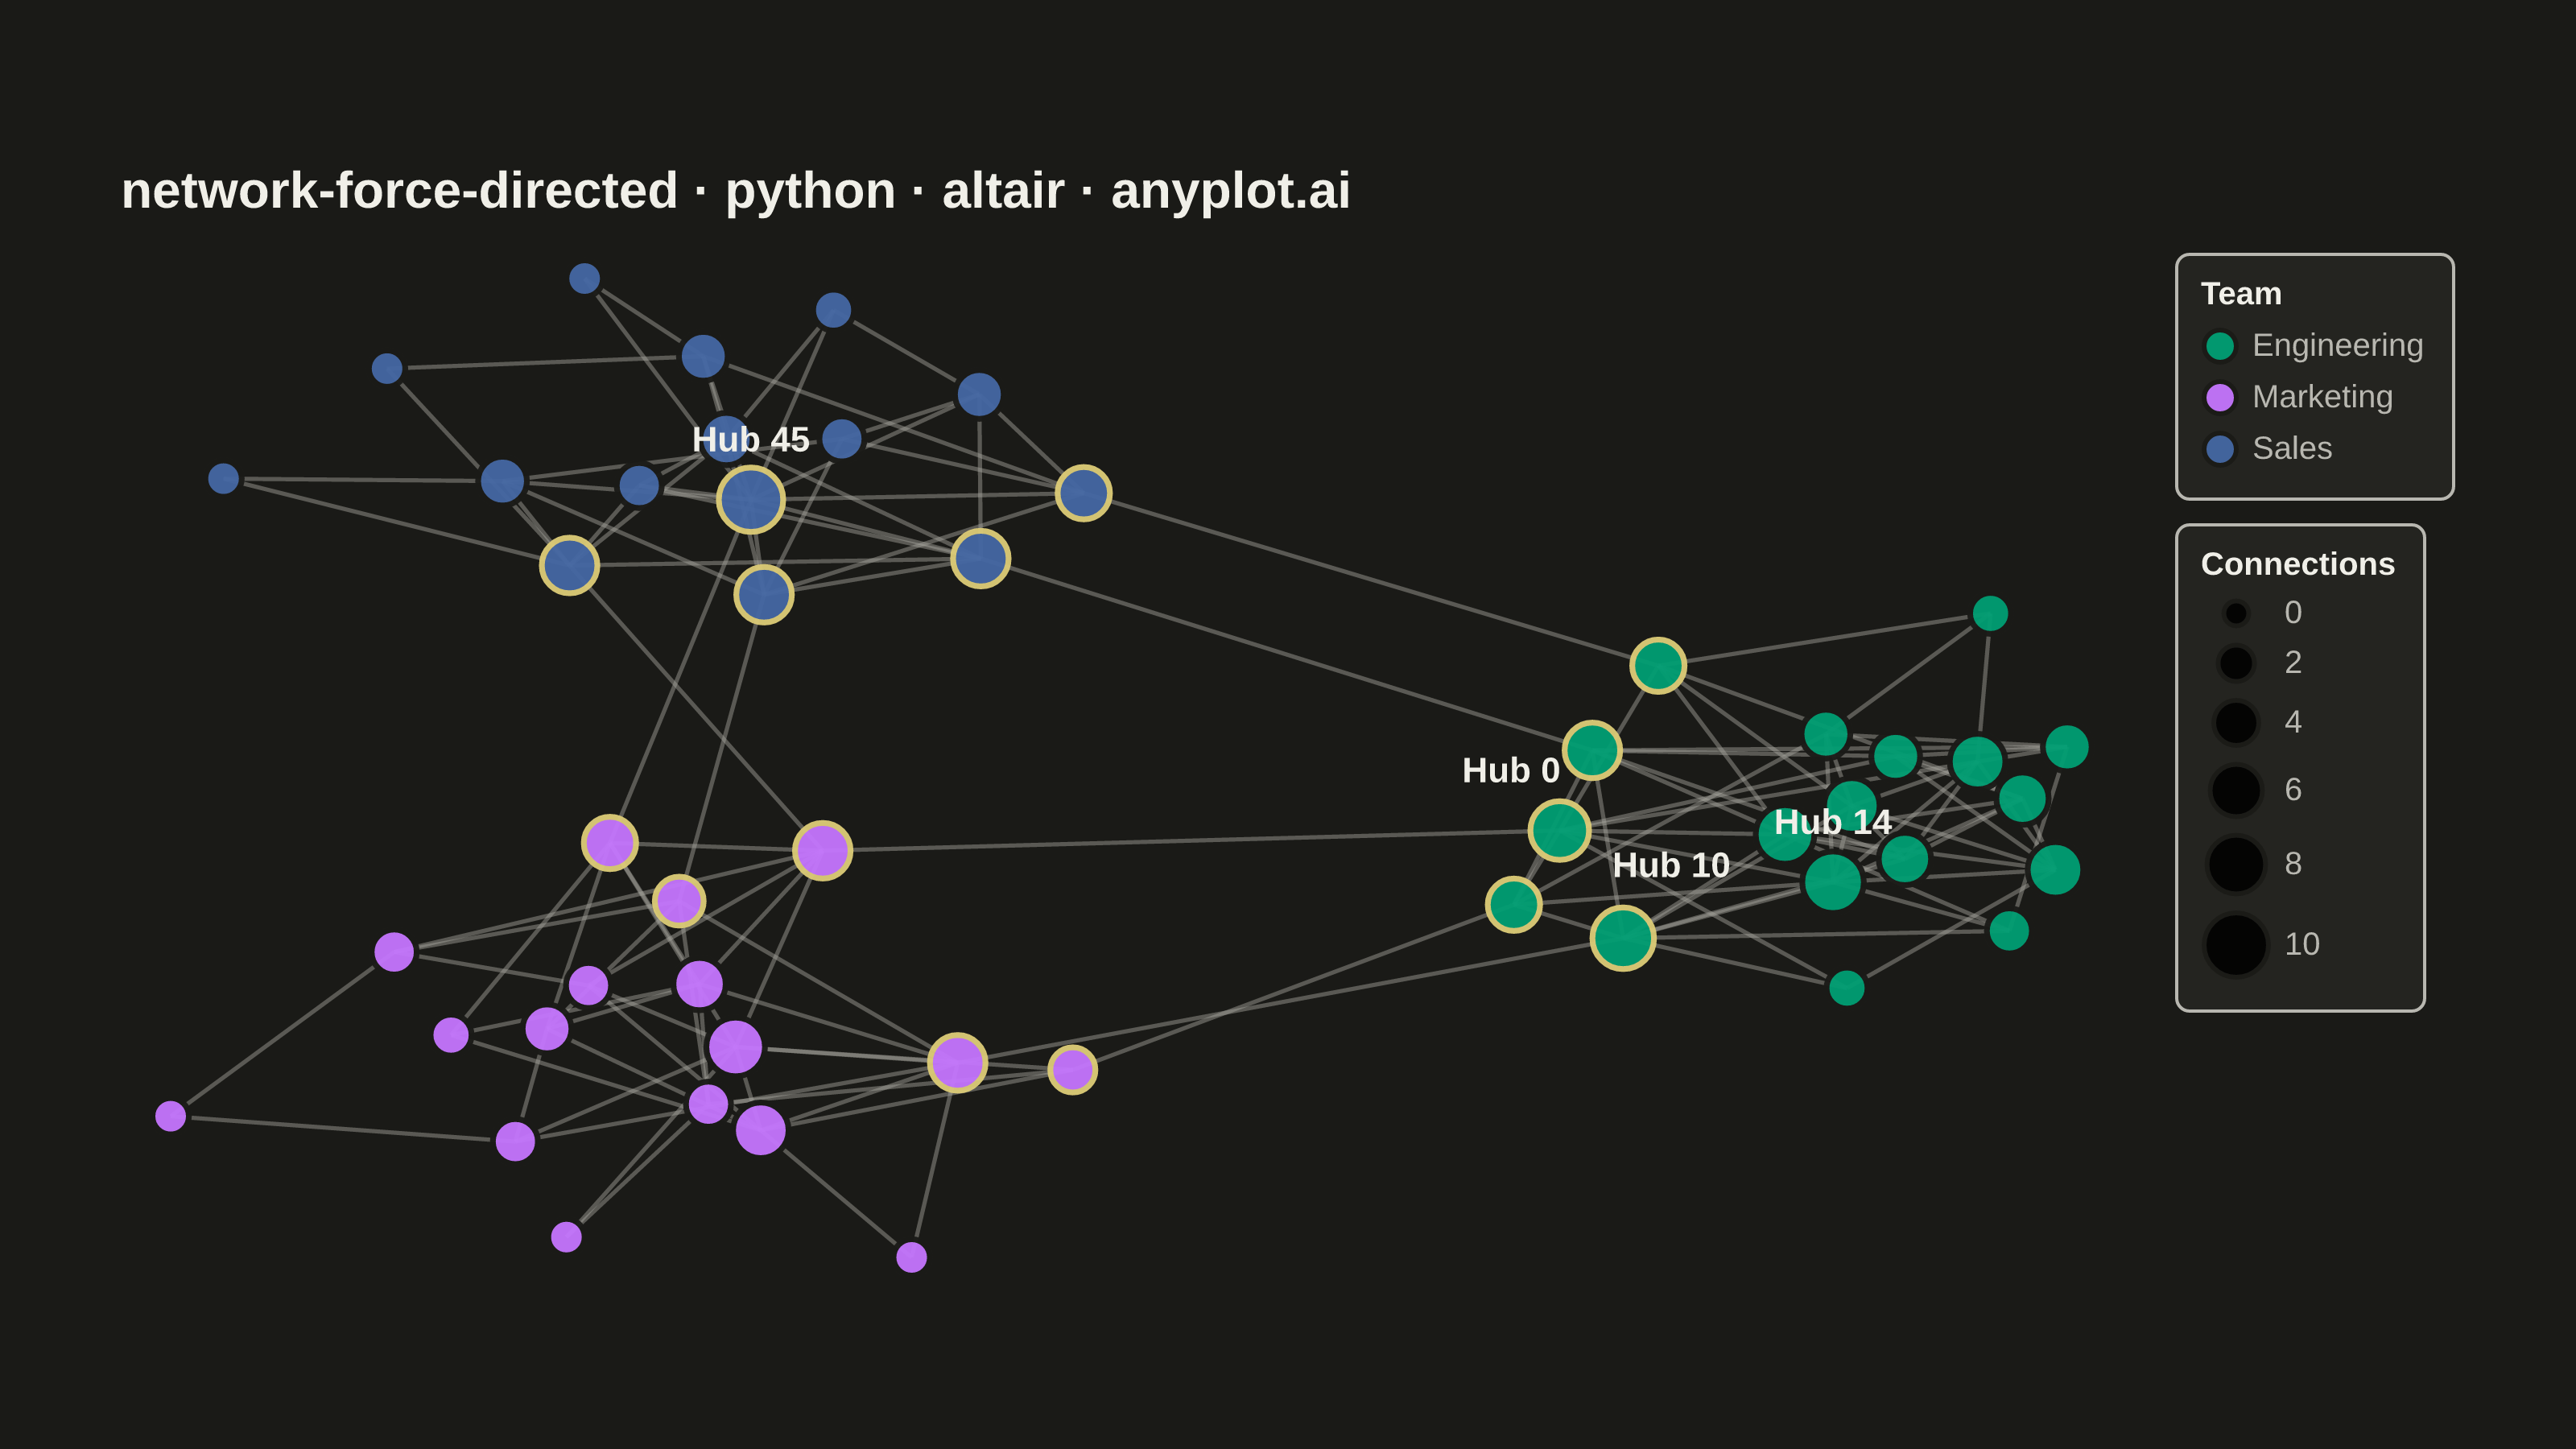
A force-directed graph uses physics simulation to position nodes, where connected nodes attract each other and all nodes repel. This creates organic layouts that naturally reveal community structure, central nodes, and overall network topology without manual positioning. The algorithm balances attractive forces (edges pulling connected nodes together) and repulsive forces (nodes pushing apart) until reaching equilibrium.
""" anyplot.ai
network-force-directed: Force-Directed Graph
Library: altair 6.2.2 | Python 3.13.14
Quality: 88/100 | Updated: 2026-07-01
"""

import os
import sys


# Prevent this file from shadowing the installed altair package (same filename as the library).
_here = os.path.dirname(os.path.abspath(__file__))
sys.path = [p for p in sys.path if not (p and os.path.abspath(p) == _here)]

import altair as alt
import numpy as np
import pandas as pd
from PIL import Image


# Theme tokens
THEME = os.getenv("ANYPLOT_THEME", "light")
PAGE_BG = "#FAF8F1" if THEME == "light" else "#1A1A17"
ELEVATED_BG = "#FFFDF6" if THEME == "light" else "#242420"
INK = "#1A1A17" if THEME == "light" else "#F0EFE8"
INK_SOFT = "#4A4A44" if THEME == "light" else "#B8B7B0"
EDGE_COLOR = "#6B6A63" if THEME == "light" else "#A8A79F"
BRIDGE_STROKE = "#DDCC77"  # amber accent for cross-community bridge nodes

# Imprint categorical palette (first series is always #009E73)
IMPRINT = ["#009E73", "#C475FD", "#4467A3"]

# Data: a 50-node organisational network with three communities
np.random.seed(42)

community_sizes = [18, 17, 15]
community_names = ["Engineering", "Marketing", "Sales"]

nodes = []
node_id = 0
for comm_idx, size in enumerate(community_sizes):
    for _ in range(size):
        nodes.append({"id": node_id, "community": community_names[comm_idx]})
        node_id += 1

# Intra-community edges (dense) + inter-community bridges (sparse)
intra_edges = []
for start, end in [(0, 18), (18, 35), (35, 50)]:
    for i in range(start, end):
        for j in range(i + 1, end):
            if np.random.random() < 0.3:
                intra_edges.append((i, j))

bridge_edges = [(0, 18), (5, 20), (10, 25), (18, 35), (22, 40), (30, 45), (8, 38), (15, 48)]
edges = intra_edges + bridge_edges

# Fruchterman-Reingold force-directed layout
n = len(nodes)
positions = np.random.rand(n, 2) * 2 - 1
k = 0.5
iterations = 200

for iteration in range(iterations):
    displacement = np.zeros((n, 2))
    for i in range(n):
        for j in range(i + 1, n):
            diff = positions[i] - positions[j]
            dist = max(np.linalg.norm(diff), 0.01)
            repulsive = (k * k / dist) * (diff / dist)
            displacement[i] += repulsive
            displacement[j] -= repulsive
    for src, tgt in edges:
        diff = positions[src] - positions[tgt]
        dist = max(np.linalg.norm(diff), 0.01)
        attractive = (dist * dist / k) * (diff / dist)
        displacement[src] -= attractive
        displacement[tgt] += attractive
    temperature = 1 - iteration / iterations
    for i in range(n):
        disp_norm = np.linalg.norm(displacement[i])
        if disp_norm > 0:
            positions[i] += (displacement[i] / disp_norm) * min(disp_norm, 0.15 * temperature)

# Normalize to 95% of canvas to maximize space utilization
pos_min = positions.min(axis=0)
pos_max = positions.max(axis=0)
positions = (positions - pos_min) / (pos_max - pos_min + 1e-6) * 0.95 + 0.025

# Node-level summary
degrees = {node["id"]: 0 for node in nodes}
for src, tgt in edges:
    degrees[src] += 1
    degrees[tgt] += 1

# Bridge nodes have cross-community connections
bridge_node_ids = set()
for src, tgt in bridge_edges:
    bridge_node_ids.add(src)
    bridge_node_ids.add(tgt)

node_df = pd.DataFrame(
    {
        "id": [node["id"] for node in nodes],
        "x": positions[:, 0],
        "y": positions[:, 1],
        "community": [node["community"] for node in nodes],
        "degree": [degrees[node["id"]] for node in nodes],
        "is_bridge": [node["id"] in bridge_node_ids for node in nodes],
    }
)

# Edge segments (long-form, two rows per edge)
edge_data = []
for src, tgt in edges:
    edge_data.append({"edge_id": f"{src}-{tgt}", "x": positions[src][0], "y": positions[src][1], "order": 0})
    edge_data.append({"edge_id": f"{src}-{tgt}", "x": positions[tgt][0], "y": positions[tgt][1], "order": 1})
edge_df = pd.DataFrame(edge_data)

# Label only the four most-connected nodes to avoid clutter
hub_df = node_df.nlargest(4, "degree").copy()
hub_df["label"] = "Hub " + hub_df["id"].astype(str)

# Edges layer — slightly thicker, compensated with lower opacity
edges_chart = (
    alt.Chart(edge_df)
    .mark_line(strokeWidth=1.3, opacity=0.45)
    .encode(
        x=alt.X("x:Q", axis=None),
        y=alt.Y("y:Q", axis=None),
        detail="edge_id:N",
        order="order:O",
        color=alt.value(EDGE_COLOR),
    )
)

# Nodes layer — bridge nodes highlighted with amber stroke
nodes_chart = (
    alt.Chart(node_df)
    .mark_circle(strokeWidth=1.8, opacity=0.95)
    .encode(
        x=alt.X("x:Q", axis=None),
        y=alt.Y("y:Q", axis=None),
        size=alt.Size(
            "degree:Q",
            scale=alt.Scale(range=[60, 400]),
            legend=alt.Legend(title="Connections", titleFontSize=10, labelFontSize=10),
        ),
        color=alt.Color(
            "community:N",
            scale=alt.Scale(domain=community_names, range=IMPRINT),
            legend=alt.Legend(title="Team", titleFontSize=10, labelFontSize=10, symbolSize=100),
        ),
        stroke=alt.condition("datum.is_bridge", alt.value(BRIDGE_STROKE), alt.value(PAGE_BG)),
        tooltip=[alt.Tooltip("community:N", title="Team"), alt.Tooltip("degree:Q", title="Connections")],
    )
)

# Hub labels — separate layer per hub enables per-label dx/dy to fan out dense clusters
_hub_offsets = {0: (-15, -18), 10: (15, -22), 14: (0, -18), 45: (0, -18)}
hub_label_layers = []
for hid in hub_df["id"].tolist():
    dx_off, dy_off = _hub_offsets.get(hid, (0, -18))
    hub_label_layers.append(
        alt.Chart(hub_df[hub_df["id"] == hid])
        .mark_text(fontSize=11, fontWeight="bold", color=INK, dx=dx_off, dy=dy_off)
        .encode(x=alt.X("x:Q", axis=None), y=alt.Y("y:Q", axis=None), text="label:N")
    )

chart = (
    alt.layer(edges_chart, nodes_chart, *hub_label_layers)
    .properties(
        width=620,
        height=320,
        padding={"left": 0, "right": 0, "top": 0, "bottom": 0},
        background=PAGE_BG,
        title=alt.Title(
            "network-force-directed · python · altair · anyplot.ai", fontSize=16, color=INK, anchor="start", offset=10
        ),
    )
    .configure_view(fill=PAGE_BG, strokeWidth=0, continuousWidth=620, continuousHeight=320)
    .configure_legend(
        fillColor=ELEVATED_BG, strokeColor=INK_SOFT, labelColor=INK_SOFT, titleColor=INK, padding=8, cornerRadius=4
    )
)

# Save PNG and pad to exact 3200 × 1800 landscape target
chart.save(f"plot-{THEME}.png", scale_factor=4.0)

TW, TH = 3200, 1800
_img = Image.open(f"plot-{THEME}.png").convert("RGB")
_w, _h = _img.size
if _w > TW or _h > TH:
    raise SystemExit(
        f"altair vl-convert produced {_w}×{_h}, exceeds target {TW}×{TH}. "
        f"Shrink chart .properties(width=, height=) values and re-render."
    )
if _w < TW or _h < TH:
    _canvas = Image.new("RGB", (TW, TH), PAGE_BG)
    _canvas.paste(_img, ((TW - _w) // 2, (TH - _h) // 2))
    _canvas.save(f"plot-{THEME}.png")

chart.save(f"plot-{THEME}.html")
Runnable source as JSON, for any HTTP client: https://api.anyplot.ai/specs/network-force-directed/altair/code. Any spec id and library id listed in llms-full.txt fit the same URL shape; every URL below is complete and callable.
{
  "spec_id": "network-force-directed",
  "language": "python",
  "library": "altair",
  "page": "https://anyplot.ai/network-force-directed/python/altair",
  "hub": "https://anyplot.ai/network-force-directed",
  "code_json": "https://api.anyplot.ai/specs/network-force-directed/altair/code",
  "spec_json": "https://api.anyplot.ai/specs/network-force-directed",
  "render_light_png": "https://storage.googleapis.com/anyplot-images/plots/network-force-directed/python/altair/plot-light.png",
  "render_dark_png": "https://storage.googleapis.com/anyplot-images/plots/network-force-directed/python/altair/plot-dark.png",
  "interactive_light_html": "https://storage.googleapis.com/anyplot-images/plots/network-force-directed/python/altair/plot-light.html",
  "interactive_dark_html": "https://storage.googleapis.com/anyplot-images/plots/network-force-directed/python/altair/plot-dark.html",
  "quality_score": 88.0,
  "license": "MIT",
  "guide": "https://anyplot.ai/llms.txt"
}
Part of Force-Directed Graph on anyplot.ai.