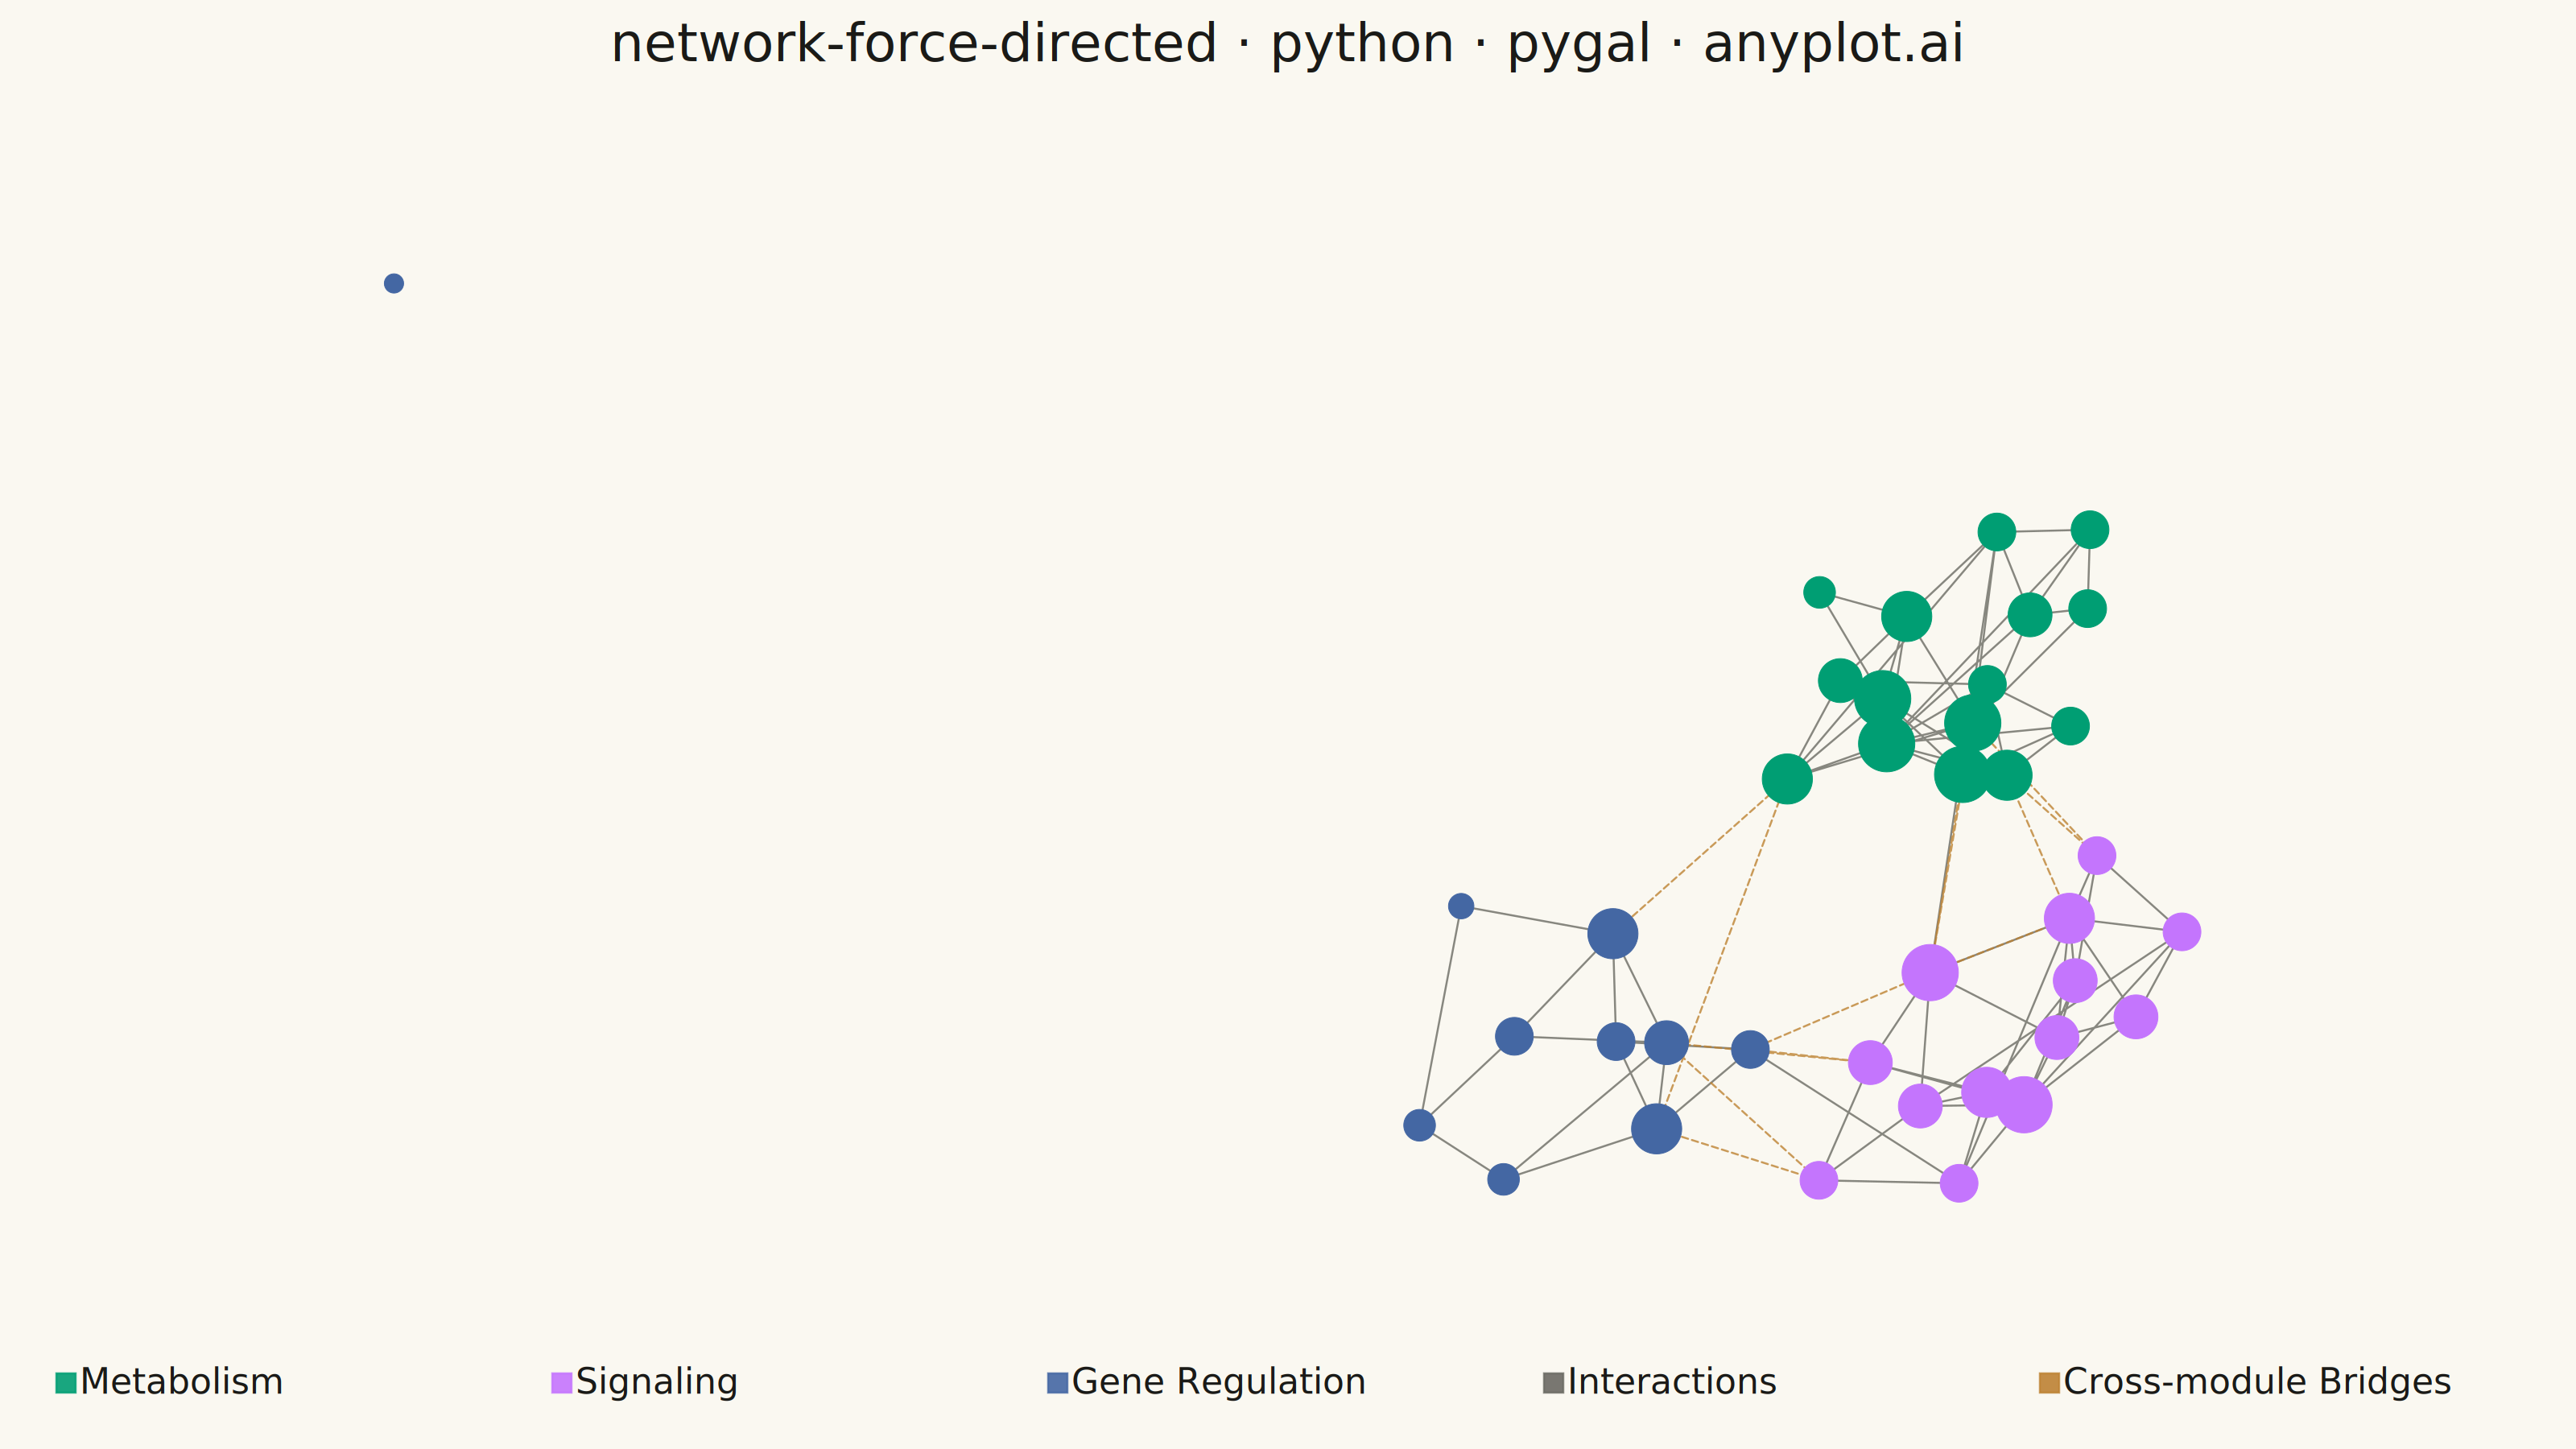
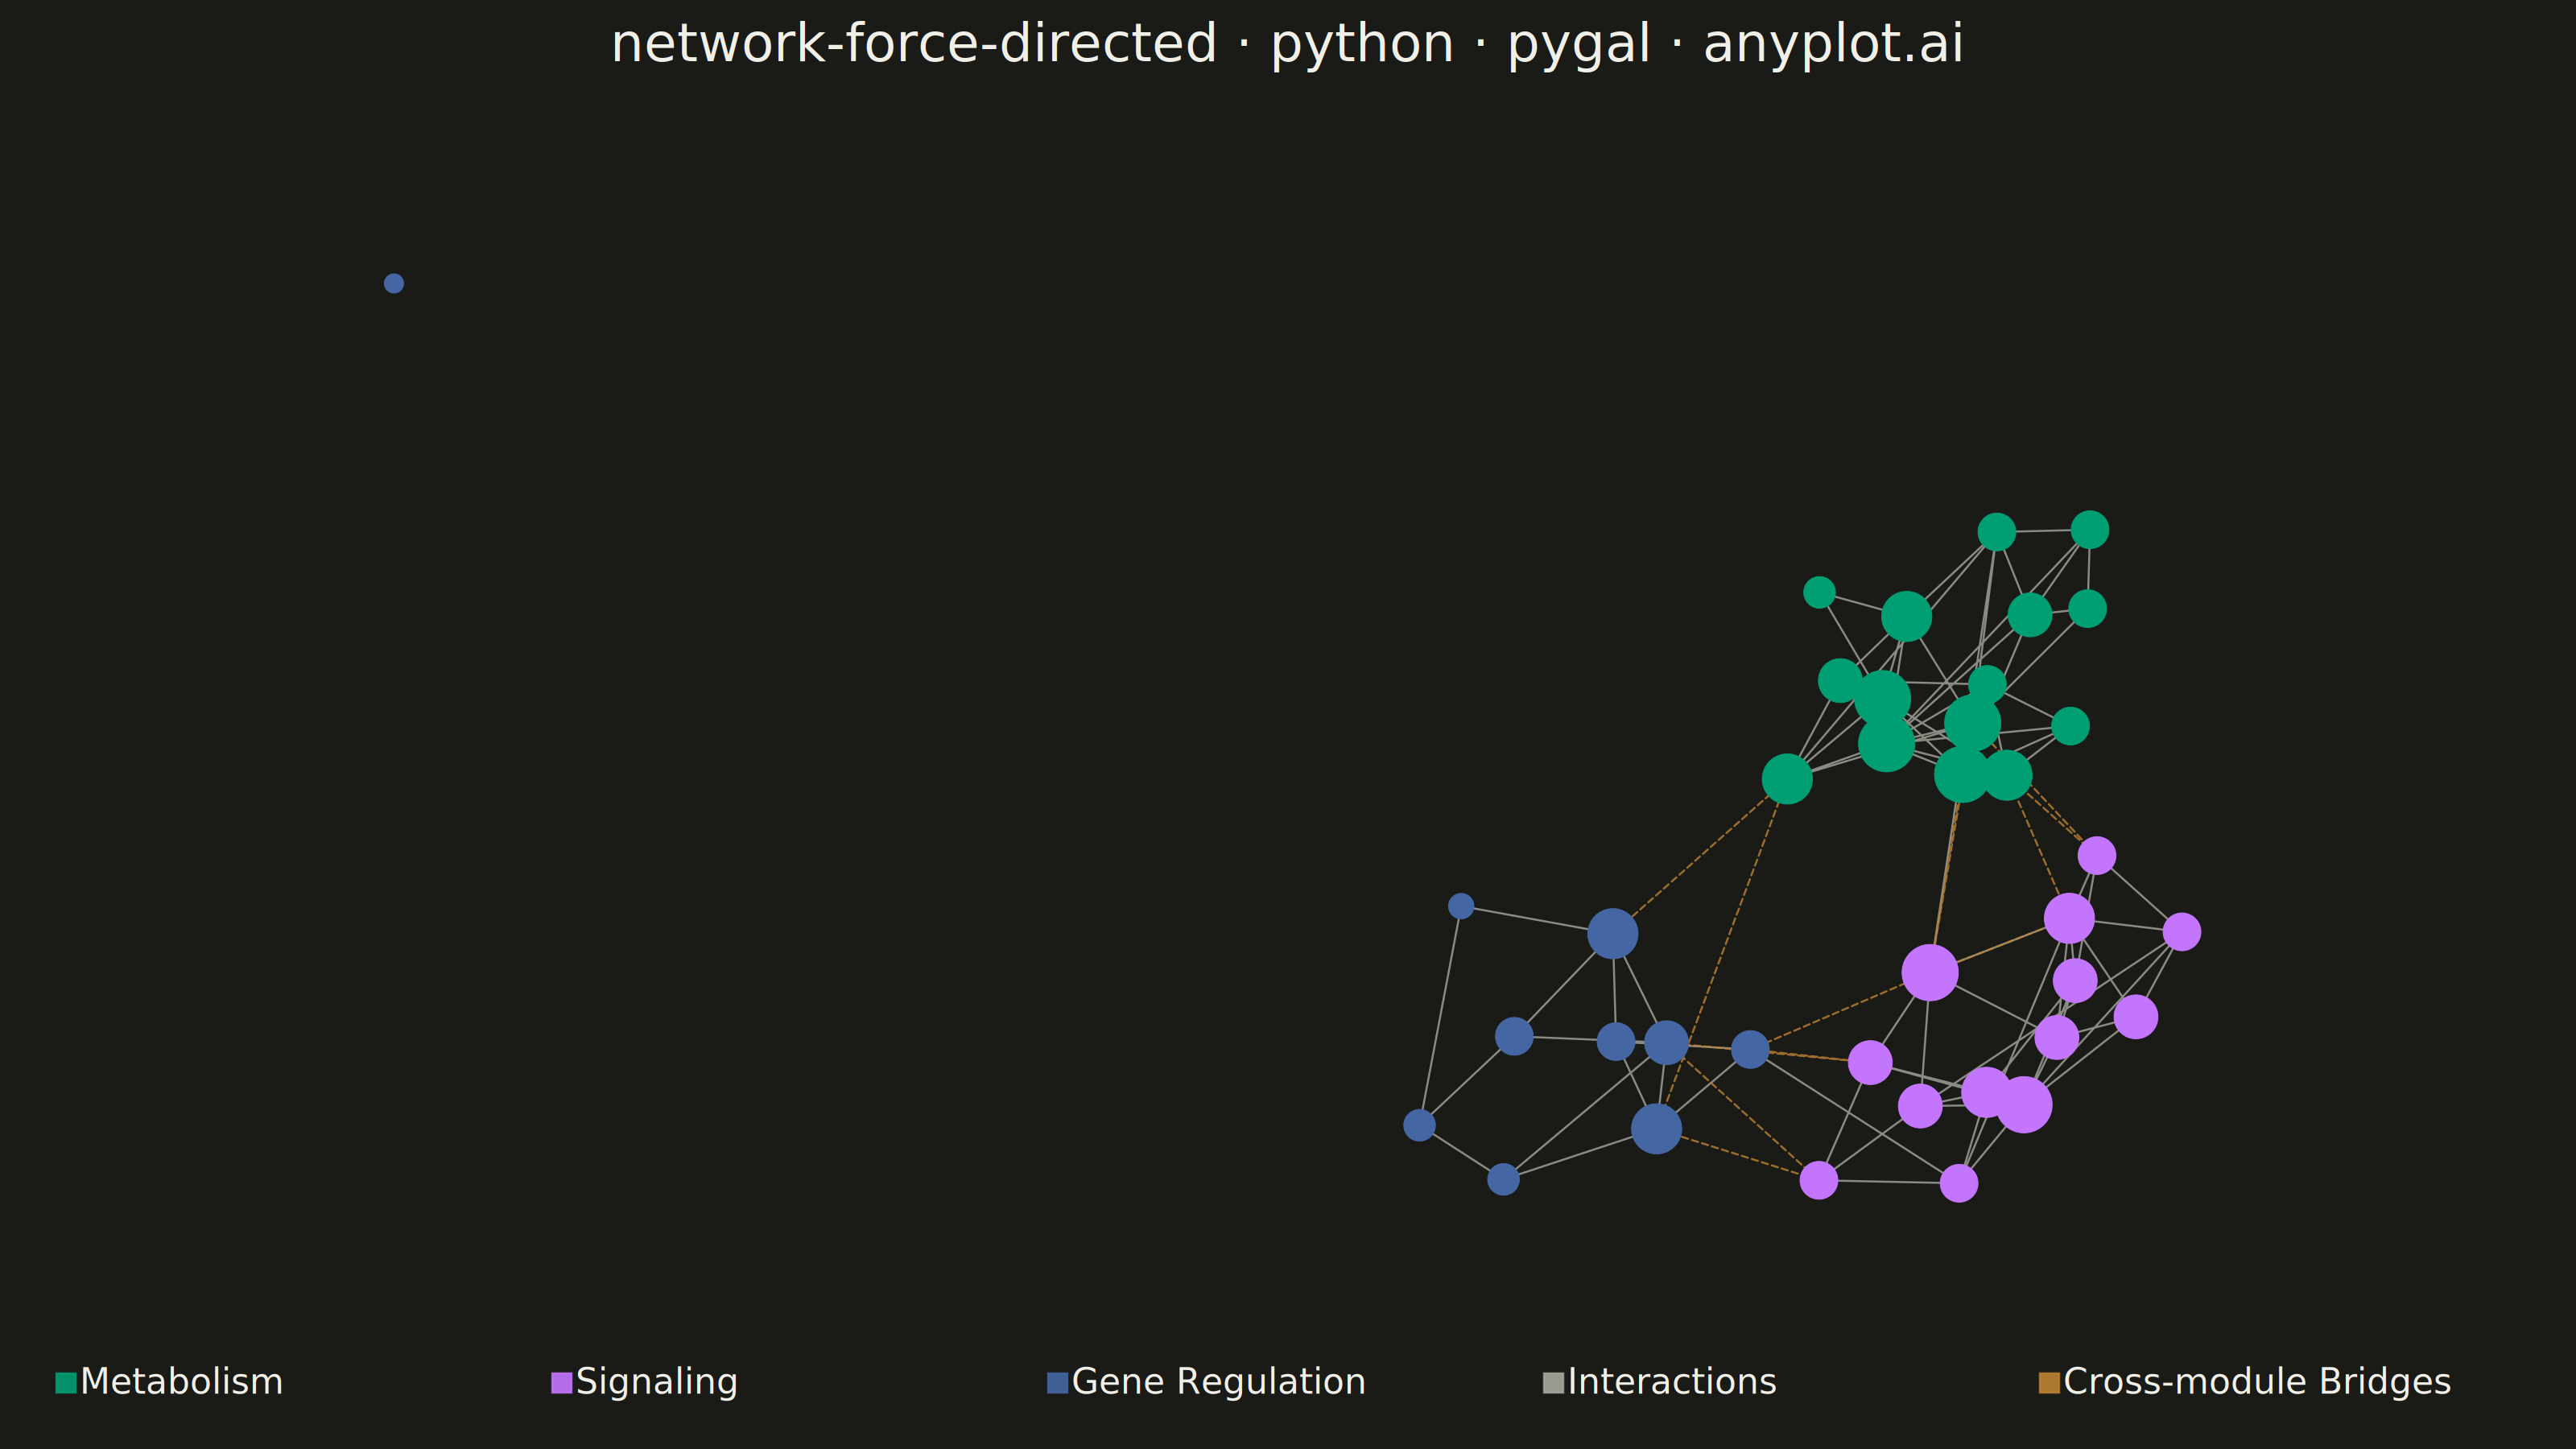
A force-directed graph uses physics simulation to position nodes, where connected nodes attract each other and all nodes repel. This creates organic layouts that naturally reveal community structure, central nodes, and overall network topology without manual positioning. The algorithm balances attractive forces (edges pulling connected nodes together) and repulsive forces (nodes pushing apart) until reaching equilibrium.
""" anyplot.ai
network-force-directed: Force-Directed Graph
Library: pygal 3.1.3 | Python 3.13.14
Quality: 83/100 | Created: 2026-07-01
"""

import sys
from pathlib import Path


# Remove script directory from path to avoid name collision with pygal package
_script_dir = str(Path(__file__).parent)
sys.path = [p for p in sys.path if p != _script_dir]

import os

import numpy as np
import pygal
from pygal.style import Style


# Theme-adaptive tokens
THEME = os.getenv("ANYPLOT_THEME", "light")
PAGE_BG = "#FAF8F1" if THEME == "light" else "#1A1A17"
INK = "#1A1A17" if THEME == "light" else "#F0EFE8"
INK_MUTED = "#6B6A63" if THEME == "light" else "#A8A79F"

# Imprint categorical palette — first data series always #009E73
IMPRINT = ("#009E73", "#C475FD", "#4467A3", "#BD8233", "#AE3030", "#2ABCCD", "#954477")

np.random.seed(42)

# Data: Protein-protein interaction network with three functional modules
# Nodes = proteins; edges = confirmed physical interactions from co-IP experiments
module_sizes = [15, 13, 10]  # Metabolism, Signaling, Gene Regulation
module_names = ["Metabolism", "Signaling", "Gene Regulation"]
nodes = []
edges = []

node_id = 0
for mod_idx, size in enumerate(module_sizes):
    for _ in range(size):
        nodes.append({"id": node_id, "module": mod_idx})
        node_id += 1

# Intra-module edges (dense within functional groups)
for i in range(15):
    for j in range(i + 1, 15):
        if np.random.random() < 0.25:
            edges.append((i, j))

for i in range(15, 28):
    for j in range(i + 1, 28):
        if np.random.random() < 0.25:
            edges.append((i, j))

for i in range(28, 38):
    for j in range(i + 1, 38):
        if np.random.random() < 0.25:
            edges.append((i, j))

# Cross-module interactions (sparse bridges — crosstalk between pathways)
bridge_edges = [
    (0, 15),
    (5, 18),
    (10, 22),  # Metabolism ↔ Signaling
    (15, 28),
    (20, 32),
    (25, 35),  # Signaling ↔ Gene Regulation
    (3, 30),  # Metabolism ↔ Gene Regulation
]
edges.extend(bridge_edges)

# Force-directed layout (Fruchterman-Reingold)
n = len(nodes)
positions = np.random.rand(n, 2) * 2 - 1

k = 1.1  # Increased from 0.95 — better node separation in dense clusters
iterations = 320

for iteration in range(iterations):
    displacement = np.zeros((n, 2))

    # Repulsive forces between all node pairs
    for i in range(n):
        for j in range(i + 1, n):
            diff = positions[i] - positions[j]
            dist = max(np.linalg.norm(diff), 0.01)
            repulsive_force = (k * k / dist) * (diff / dist)
            displacement[i] += repulsive_force
            displacement[j] -= repulsive_force

    # Attractive forces along edges
    for src, tgt in edges:
        diff = positions[src] - positions[tgt]
        dist = max(np.linalg.norm(diff), 0.01)
        attractive_force = (dist * dist / k) * (diff / dist)
        displacement[src] -= attractive_force
        displacement[tgt] += attractive_force

    # Apply displacement with cooling schedule
    temperature = 1 - iteration / iterations
    for i in range(n):
        disp_norm = np.linalg.norm(displacement[i])
        if disp_norm > 0:
            positions[i] += (displacement[i] / disp_norm) * min(disp_norm, 0.15 * temperature)

# Normalize positions with ~15% margin on each side to keep clusters away from canvas edges
pos_min = positions.min(axis=0)
pos_max = positions.max(axis=0)
positions = (positions - pos_min) / (pos_max - pos_min + 1e-6) * 9 + 1.5
pos = {node["id"]: positions[i] for i, node in enumerate(nodes)}

# Node degrees (for size encoding)
degrees = {node["id"]: 0 for node in nodes}
for src, tgt in edges:
    degrees[src] += 1
    degrees[tgt] += 1

# Style — module series use Imprint positions 1-3; intra edges use INK_MUTED; bridge edges use Imprint[3]
module_colors = IMPRINT[: len(module_names)]
BRIDGE_COLOR = IMPRINT[3]  # #BD8233 amber — visually distinct cross-module connector
series_colors = module_colors + (INK_MUTED, BRIDGE_COLOR)  # nodes first → Metabolism gets #009E73

custom_style = Style(
    background=PAGE_BG,
    plot_background=PAGE_BG,
    foreground=INK,
    foreground_strong=INK,
    foreground_subtle=INK_MUTED,
    colors=series_colors,
    title_font_size=66,
    label_font_size=56,
    major_label_font_size=44,
    legend_font_size=44,
    value_font_size=36,
    stroke_width=2.5,
    opacity=0.9,
    opacity_hover=1.0,
    tooltip_font_size=28,
    font_family="DejaVu Sans, Helvetica, Arial, sans-serif",
)

chart = pygal.XY(
    width=3200,
    height=1800,
    style=custom_style,
    title="network-force-directed · python · pygal · anyplot.ai",
    show_legend=True,
    show_x_guides=False,
    show_y_guides=False,
    show_x_labels=False,
    show_y_labels=False,
    stroke=True,
    dots_size=18,
    stroke_style={"width": 2.5, "linecap": "round"},
    legend_at_bottom=True,
    legend_at_bottom_columns=5,
    legend_box_size=24,
    margin=60,
    range=(0, 12),
    xrange=(0, 12),
)

# Node series added FIRST — Metabolism is series 0 and receives Imprint #009E73
min_radius, max_radius = 12, 35
max_degree = max(degrees.values())
for mod_idx, mod_name in enumerate(module_names):
    mod_nodes = [node for node in nodes if node["module"] == mod_idx]
    node_points = []
    for node in mod_nodes:
        x, y = pos[node["id"]]
        degree = degrees[node["id"]]
        radius = min_radius + (max_radius - min_radius) * (degree / max_degree)
        label = f"Protein {node['id']} | {degree} interactions"
        if degree >= 8:
            label += " (Hub)"
        node_points.append({"value": (x, y), "label": label, "node": {"r": round(radius, 1)}})
    chart.add(mod_name, node_points, stroke=False)

# Build intra-module edge set for fast lookup
bridge_edge_set = set(map(tuple, bridge_edges))

# Intra-module edges (series 3) — uses INK_MUTED via colors position 3
intra_edge_points = []
for src, tgt in edges:
    if (src, tgt) not in bridge_edge_set and (tgt, src) not in bridge_edge_set:
        x1, y1 = pos[src]
        x2, y2 = pos[tgt]
        intra_edge_points.append((x1, y1))
        intra_edge_points.append((x2, y2))
        intra_edge_points.append(None)

chart.add("Interactions", intra_edge_points, stroke=True, show_dots=False, fill=False)

# Cross-module bridge edges (series 4) — amber #BD8233, dashed to signal inter-pathway crosstalk
bridge_edge_points = []
for src, tgt in bridge_edges:
    x1, y1 = pos[src]
    x2, y2 = pos[tgt]
    bridge_edge_points.append((x1, y1))
    bridge_edge_points.append((x2, y2))
    bridge_edge_points.append(None)

chart.add(
    "Cross-module Bridges",
    bridge_edge_points,
    stroke=True,
    show_dots=False,
    fill=False,
    stroke_style={"width": 2.5, "dasharray": "8 5", "linecap": "round"},
)

# Save outputs (theme-aware filenames)
chart.render_to_file(f"plot-{THEME}.svg")
chart.render_to_png(f"plot-{THEME}.png")

with open(f"plot-{THEME}.html", "wb") as f:
    f.write(chart.render())
Runnable source as JSON, for any HTTP client: https://api.anyplot.ai/specs/network-force-directed/pygal/code. Any spec id and library id listed in llms-full.txt fit the same URL shape; every URL below is complete and callable.
{
  "spec_id": "network-force-directed",
  "language": "python",
  "library": "pygal",
  "page": "https://anyplot.ai/network-force-directed/python/pygal",
  "hub": "https://anyplot.ai/network-force-directed",
  "code_json": "https://api.anyplot.ai/specs/network-force-directed/pygal/code",
  "spec_json": "https://api.anyplot.ai/specs/network-force-directed",
  "render_light_png": "https://storage.googleapis.com/anyplot-images/plots/network-force-directed/python/pygal/plot-light.png",
  "render_dark_png": "https://storage.googleapis.com/anyplot-images/plots/network-force-directed/python/pygal/plot-dark.png",
  "interactive_light_html": "https://storage.googleapis.com/anyplot-images/plots/network-force-directed/python/pygal/plot-light.html",
  "interactive_dark_html": "https://storage.googleapis.com/anyplot-images/plots/network-force-directed/python/pygal/plot-dark.html",
  "quality_score": 83.0,
  "license": "MIT",
  "guide": "https://anyplot.ai/llms.txt"
}
Part of Force-Directed Graph on anyplot.ai.