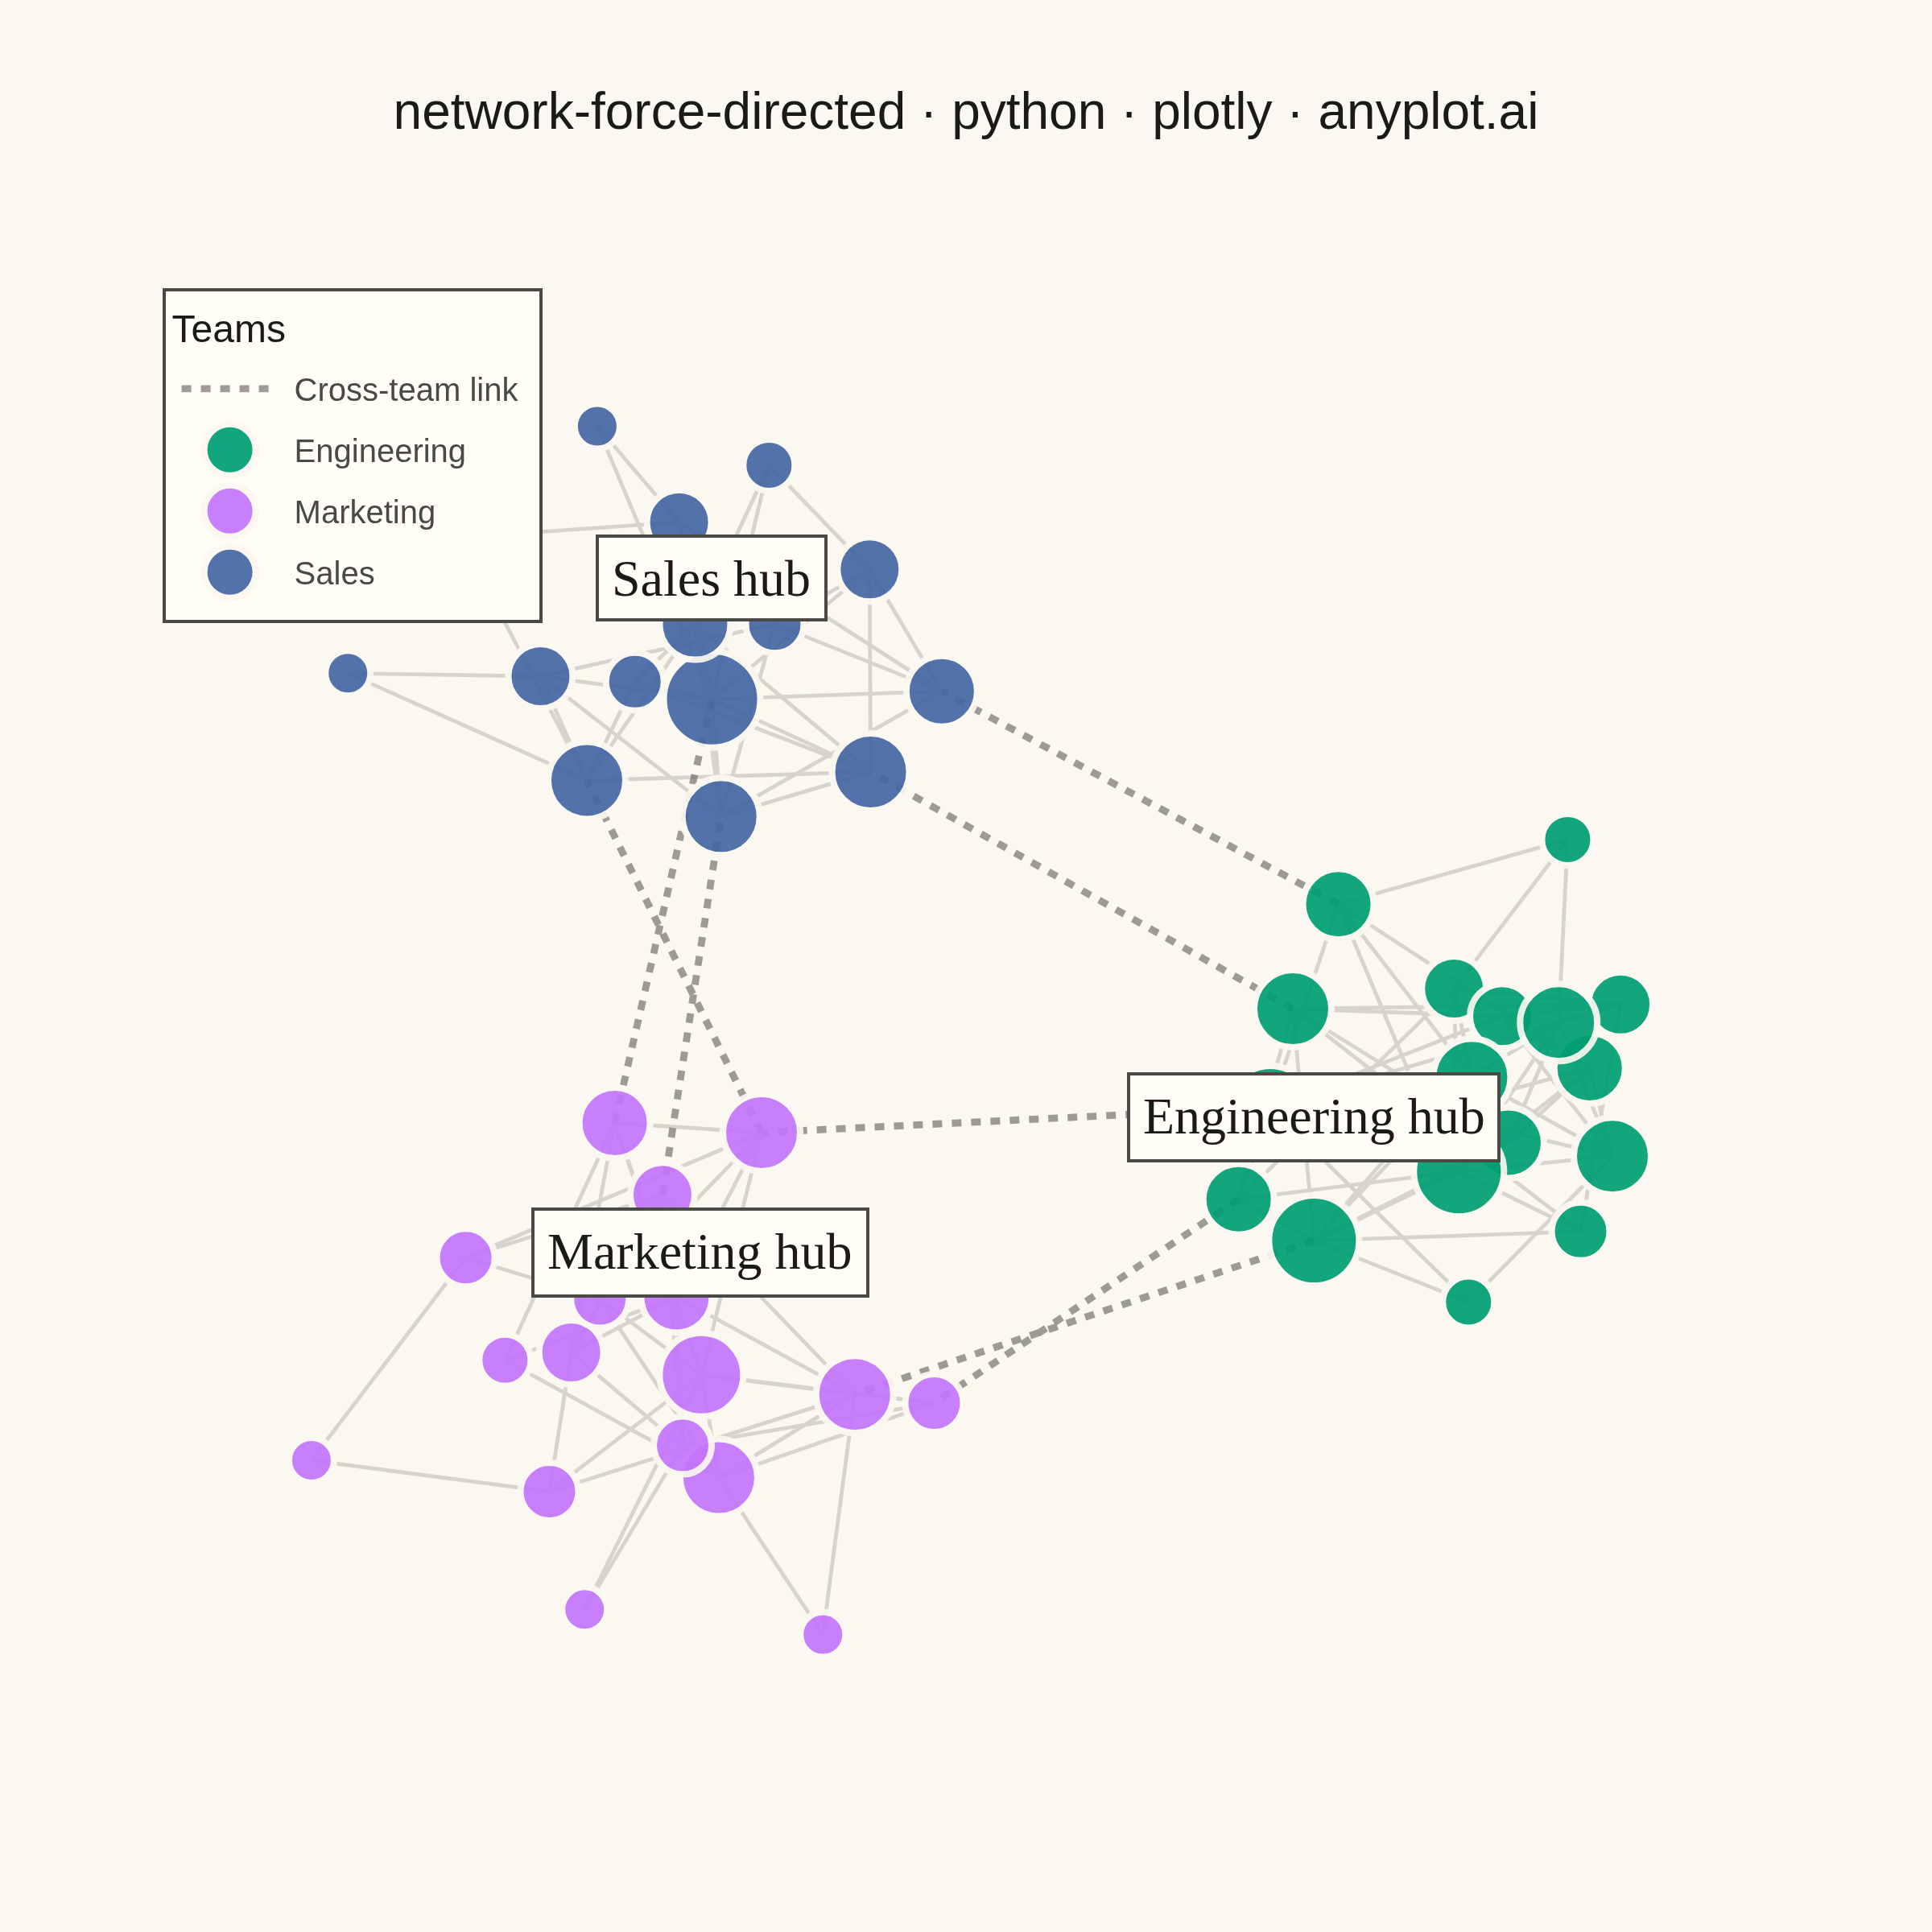
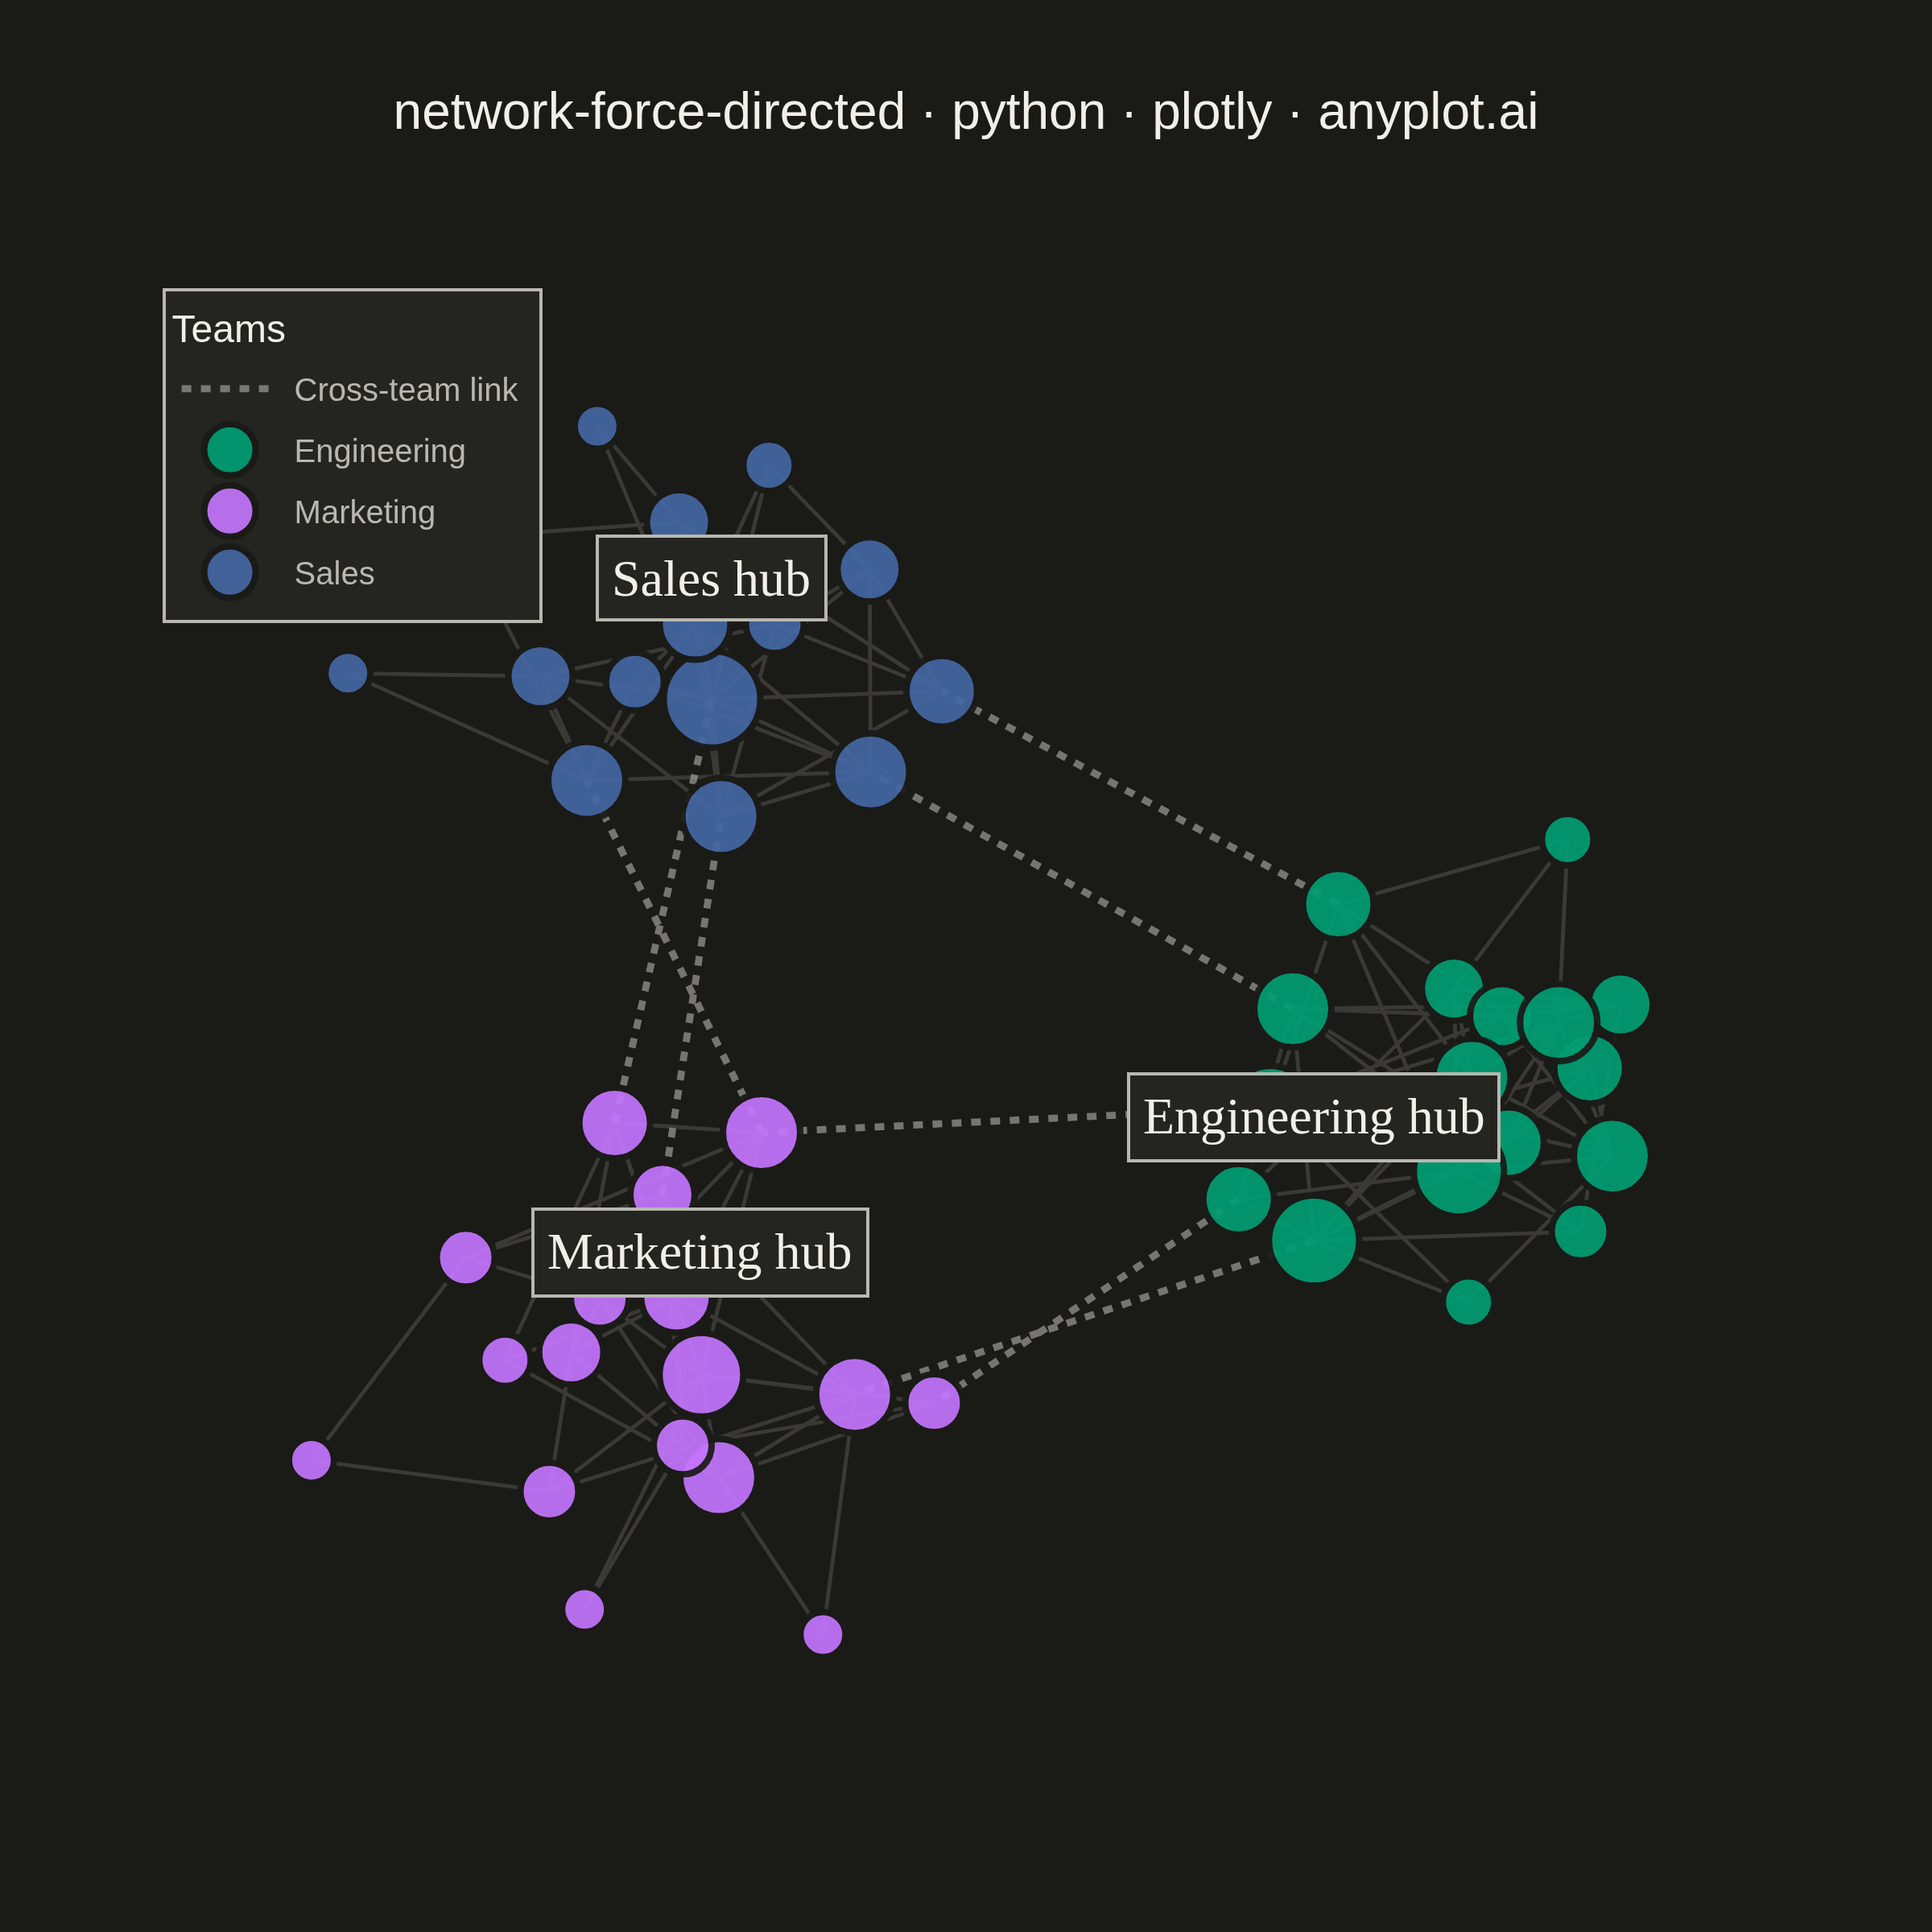
A force-directed graph uses physics simulation to position nodes, where connected nodes attract each other and all nodes repel. This creates organic layouts that naturally reveal community structure, central nodes, and overall network topology without manual positioning. The algorithm balances attractive forces (edges pulling connected nodes together) and repulsive forces (nodes pushing apart) until reaching equilibrium.
""" anyplot.ai
network-force-directed: Force-Directed Graph
Library: plotly 6.8.0 | Python 3.13.14
Quality: 90/100 | Updated: 2026-07-01
"""

import os

import numpy as np
import plotly.graph_objects as go


# Theme-adaptive chrome tokens
THEME = os.getenv("ANYPLOT_THEME", "light")
PAGE_BG = "#FAF8F1" if THEME == "light" else "#1A1A17"
ELEVATED_BG = "#FFFDF6" if THEME == "light" else "#242420"
INK = "#1A1A17" if THEME == "light" else "#F0EFE8"
INK_SOFT = "#4A4A44" if THEME == "light" else "#B8B7B0"
INK_MUTED = "#6B6A63" if THEME == "light" else "#A8A79F"
GRID = "rgba(26,26,23,0.15)" if THEME == "light" else "rgba(240,239,232,0.15)"

# Imprint categorical palette (positions 1-3)
IMPRINT = ["#009E73", "#C475FD", "#4467A3"]

np.random.seed(42)

# Social network: 50 nodes in 3 teams, corporate collaboration graph
community_sizes = [18, 17, 15]
community_names = ["Engineering", "Marketing", "Sales"]
nodes = []
node_id = 0
for comm_idx, size in enumerate(community_sizes):
    for _ in range(size):
        nodes.append({"id": node_id, "community": comm_idx})
        node_id += 1

# Intra-community edges (dense within-team connections)
edges_intra = []
for i in range(18):
    for j in range(i + 1, 18):
        if np.random.random() < 0.3:
            edges_intra.append((i, j))
for i in range(18, 35):
    for j in range(i + 1, 35):
        if np.random.random() < 0.3:
            edges_intra.append((i, j))
for i in range(35, 50):
    for j in range(i + 1, 50):
        if np.random.random() < 0.3:
            edges_intra.append((i, j))

# Inter-community bridge edges (sparse cross-team links)
edges_bridge = [(0, 18), (5, 20), (10, 25), (18, 35), (22, 40), (30, 45), (8, 38), (15, 48)]

all_edges = edges_intra + edges_bridge

# Force-directed layout: Fruchterman-Reingold algorithm
n = len(nodes)
positions = np.random.rand(n, 2) * 2 - 1
k = 0.5

for iteration in range(200):
    displacement = np.zeros((n, 2))

    for i in range(n):
        for j in range(i + 1, n):
            diff = positions[i] - positions[j]
            dist = max(np.linalg.norm(diff), 0.01)
            repulsive_force = (k * k / dist) * (diff / dist)
            displacement[i] += repulsive_force
            displacement[j] -= repulsive_force

    for src, tgt in all_edges:
        diff = positions[src] - positions[tgt]
        dist = max(np.linalg.norm(diff), 0.01)
        attractive_force = (dist * dist / k) * (diff / dist)
        displacement[src] -= attractive_force
        displacement[tgt] += attractive_force

    temperature = 1 - iteration / 200
    for i in range(n):
        disp_norm = np.linalg.norm(displacement[i])
        if disp_norm > 0:
            positions[i] += (displacement[i] / disp_norm) * min(disp_norm, 0.15 * temperature)

pos_min = positions.min(axis=0)
pos_max = positions.max(axis=0)
positions = (positions - pos_min) / (pos_max - pos_min + 1e-6) * 0.86 + 0.07
pos = {node["id"]: positions[i] for i, node in enumerate(nodes)}

# Node degrees
degrees = {node["id"]: 0 for node in nodes}
for src, tgt in all_edges:
    degrees[src] += 1
    degrees[tgt] += 1

fig = go.Figure()

# Intra-community edges: thin and subtle — team cohesion background
intra_x, intra_y = [], []
for src, tgt in edges_intra:
    x0, y0 = pos[src]
    x1, y1 = pos[tgt]
    intra_x.extend([x0, x1, None])
    intra_y.extend([y0, y1, None])

fig.add_trace(
    go.Scatter(
        x=intra_x,
        y=intra_y,
        mode="lines",
        line={"width": 1.2, "color": INK_SOFT},
        opacity=0.2,
        hoverinfo="none",
        showlegend=False,
    )
)

# Bridge edges: thicker dotted lines — highlight cross-team connections
bridge_x, bridge_y = [], []
for src, tgt in edges_bridge:
    x0, y0 = pos[src]
    x1, y1 = pos[tgt]
    bridge_x.extend([x0, x1, None])
    bridge_y.extend([y0, y1, None])

fig.add_trace(
    go.Scatter(
        x=bridge_x,
        y=bridge_y,
        mode="lines",
        line={"width": 2.2, "color": INK_MUTED, "dash": "dot"},
        opacity=0.65,
        hoverinfo="none",
        name="Cross-team link",
        showlegend=True,
    )
)

# Node traces: one per community for legend grouping
for comm_idx, comm_name in enumerate(community_names):
    comm_nodes = [node for node in nodes if node["community"] == comm_idx]
    x_vals = [pos[node["id"]][0] for node in comm_nodes]
    y_vals = [pos[node["id"]][1] for node in comm_nodes]
    sizes = [10 + degrees[node["id"]] * 2 for node in comm_nodes]
    hover_text = [
        f"Node {node['id']}<br>Team: {comm_name}<br>Connections: {degrees[node['id']]}" for node in comm_nodes
    ]

    fig.add_trace(
        go.Scatter(
            x=x_vals,
            y=y_vals,
            mode="markers",
            marker={"size": sizes, "color": IMPRINT[comm_idx], "line": {"width": 2, "color": PAGE_BG}, "opacity": 0.92},
            name=comm_name,
            text=hover_text,
            hoverinfo="text",
        )
    )

# Hub annotations: label the top-degree node per community only
title_str = "network-force-directed · python · plotly · anyplot.ai"
n_chars = len(title_str)
ratio = 67 / n_chars if n_chars > 67 else 1.0
title_fontsize = max(round(16 * ratio), 11)

hub_annotations = []
for comm_idx, comm_name in enumerate(community_names):
    comm_nodes = [node for node in nodes if node["community"] == comm_idx]
    top_node = max(comm_nodes, key=lambda node: degrees[node["id"]])
    x, y = pos[top_node["id"]]
    hub_annotations.append(
        {
            "x": x,
            "y": y + 0.055,
            "text": f"{comm_name} hub",
            "showarrow": False,
            "font": {"size": 16, "color": INK, "family": "Arial Black"},
            "bgcolor": ELEVATED_BG,
            "bordercolor": INK_SOFT,
            "borderwidth": 1,
            "borderpad": 4,
            "xanchor": "center",
            "yanchor": "bottom",
        }
    )

fig.update_layout(
    autosize=False,
    title={"text": title_str, "font": {"size": title_fontsize, "color": INK}, "x": 0.5, "xanchor": "center"},
    paper_bgcolor=PAGE_BG,
    plot_bgcolor=PAGE_BG,
    font={"color": INK},
    xaxis={"showgrid": False, "zeroline": False, "showticklabels": False, "range": [-0.05, 1.05]},
    yaxis={"showgrid": False, "zeroline": False, "showticklabels": False, "range": [-0.05, 1.05]},
    legend={
        "title": {"text": "Teams", "font": {"size": 12, "color": INK}},
        "font": {"size": 10, "color": INK_SOFT},
        "x": 0.02,
        "y": 0.98,
        "bgcolor": ELEVATED_BG,
        "bordercolor": INK_SOFT,
        "borderwidth": 1,
    },
    annotations=hub_annotations,
    margin={"l": 40, "r": 40, "t": 80, "b": 40},
)

fig.write_image(f"plot-{THEME}.png", width=600, height=600, scale=4)
fig.write_html(f"plot-{THEME}.html", include_plotlyjs="cdn")
Runnable source as JSON, for any HTTP client: https://api.anyplot.ai/specs/network-force-directed/plotly/code. Any spec id and library id listed in llms-full.txt fit the same URL shape; every URL below is complete and callable.
{
  "spec_id": "network-force-directed",
  "language": "python",
  "library": "plotly",
  "page": "https://anyplot.ai/network-force-directed/python/plotly",
  "hub": "https://anyplot.ai/network-force-directed",
  "code_json": "https://api.anyplot.ai/specs/network-force-directed/plotly/code",
  "spec_json": "https://api.anyplot.ai/specs/network-force-directed",
  "render_light_png": "https://storage.googleapis.com/anyplot-images/plots/network-force-directed/python/plotly/plot-light.png",
  "render_dark_png": "https://storage.googleapis.com/anyplot-images/plots/network-force-directed/python/plotly/plot-dark.png",
  "interactive_light_html": "https://storage.googleapis.com/anyplot-images/plots/network-force-directed/python/plotly/plot-light.html",
  "interactive_dark_html": "https://storage.googleapis.com/anyplot-images/plots/network-force-directed/python/plotly/plot-dark.html",
  "quality_score": 90.0,
  "license": "MIT",
  "guide": "https://anyplot.ai/llms.txt"
}
Part of Force-Directed Graph on anyplot.ai.