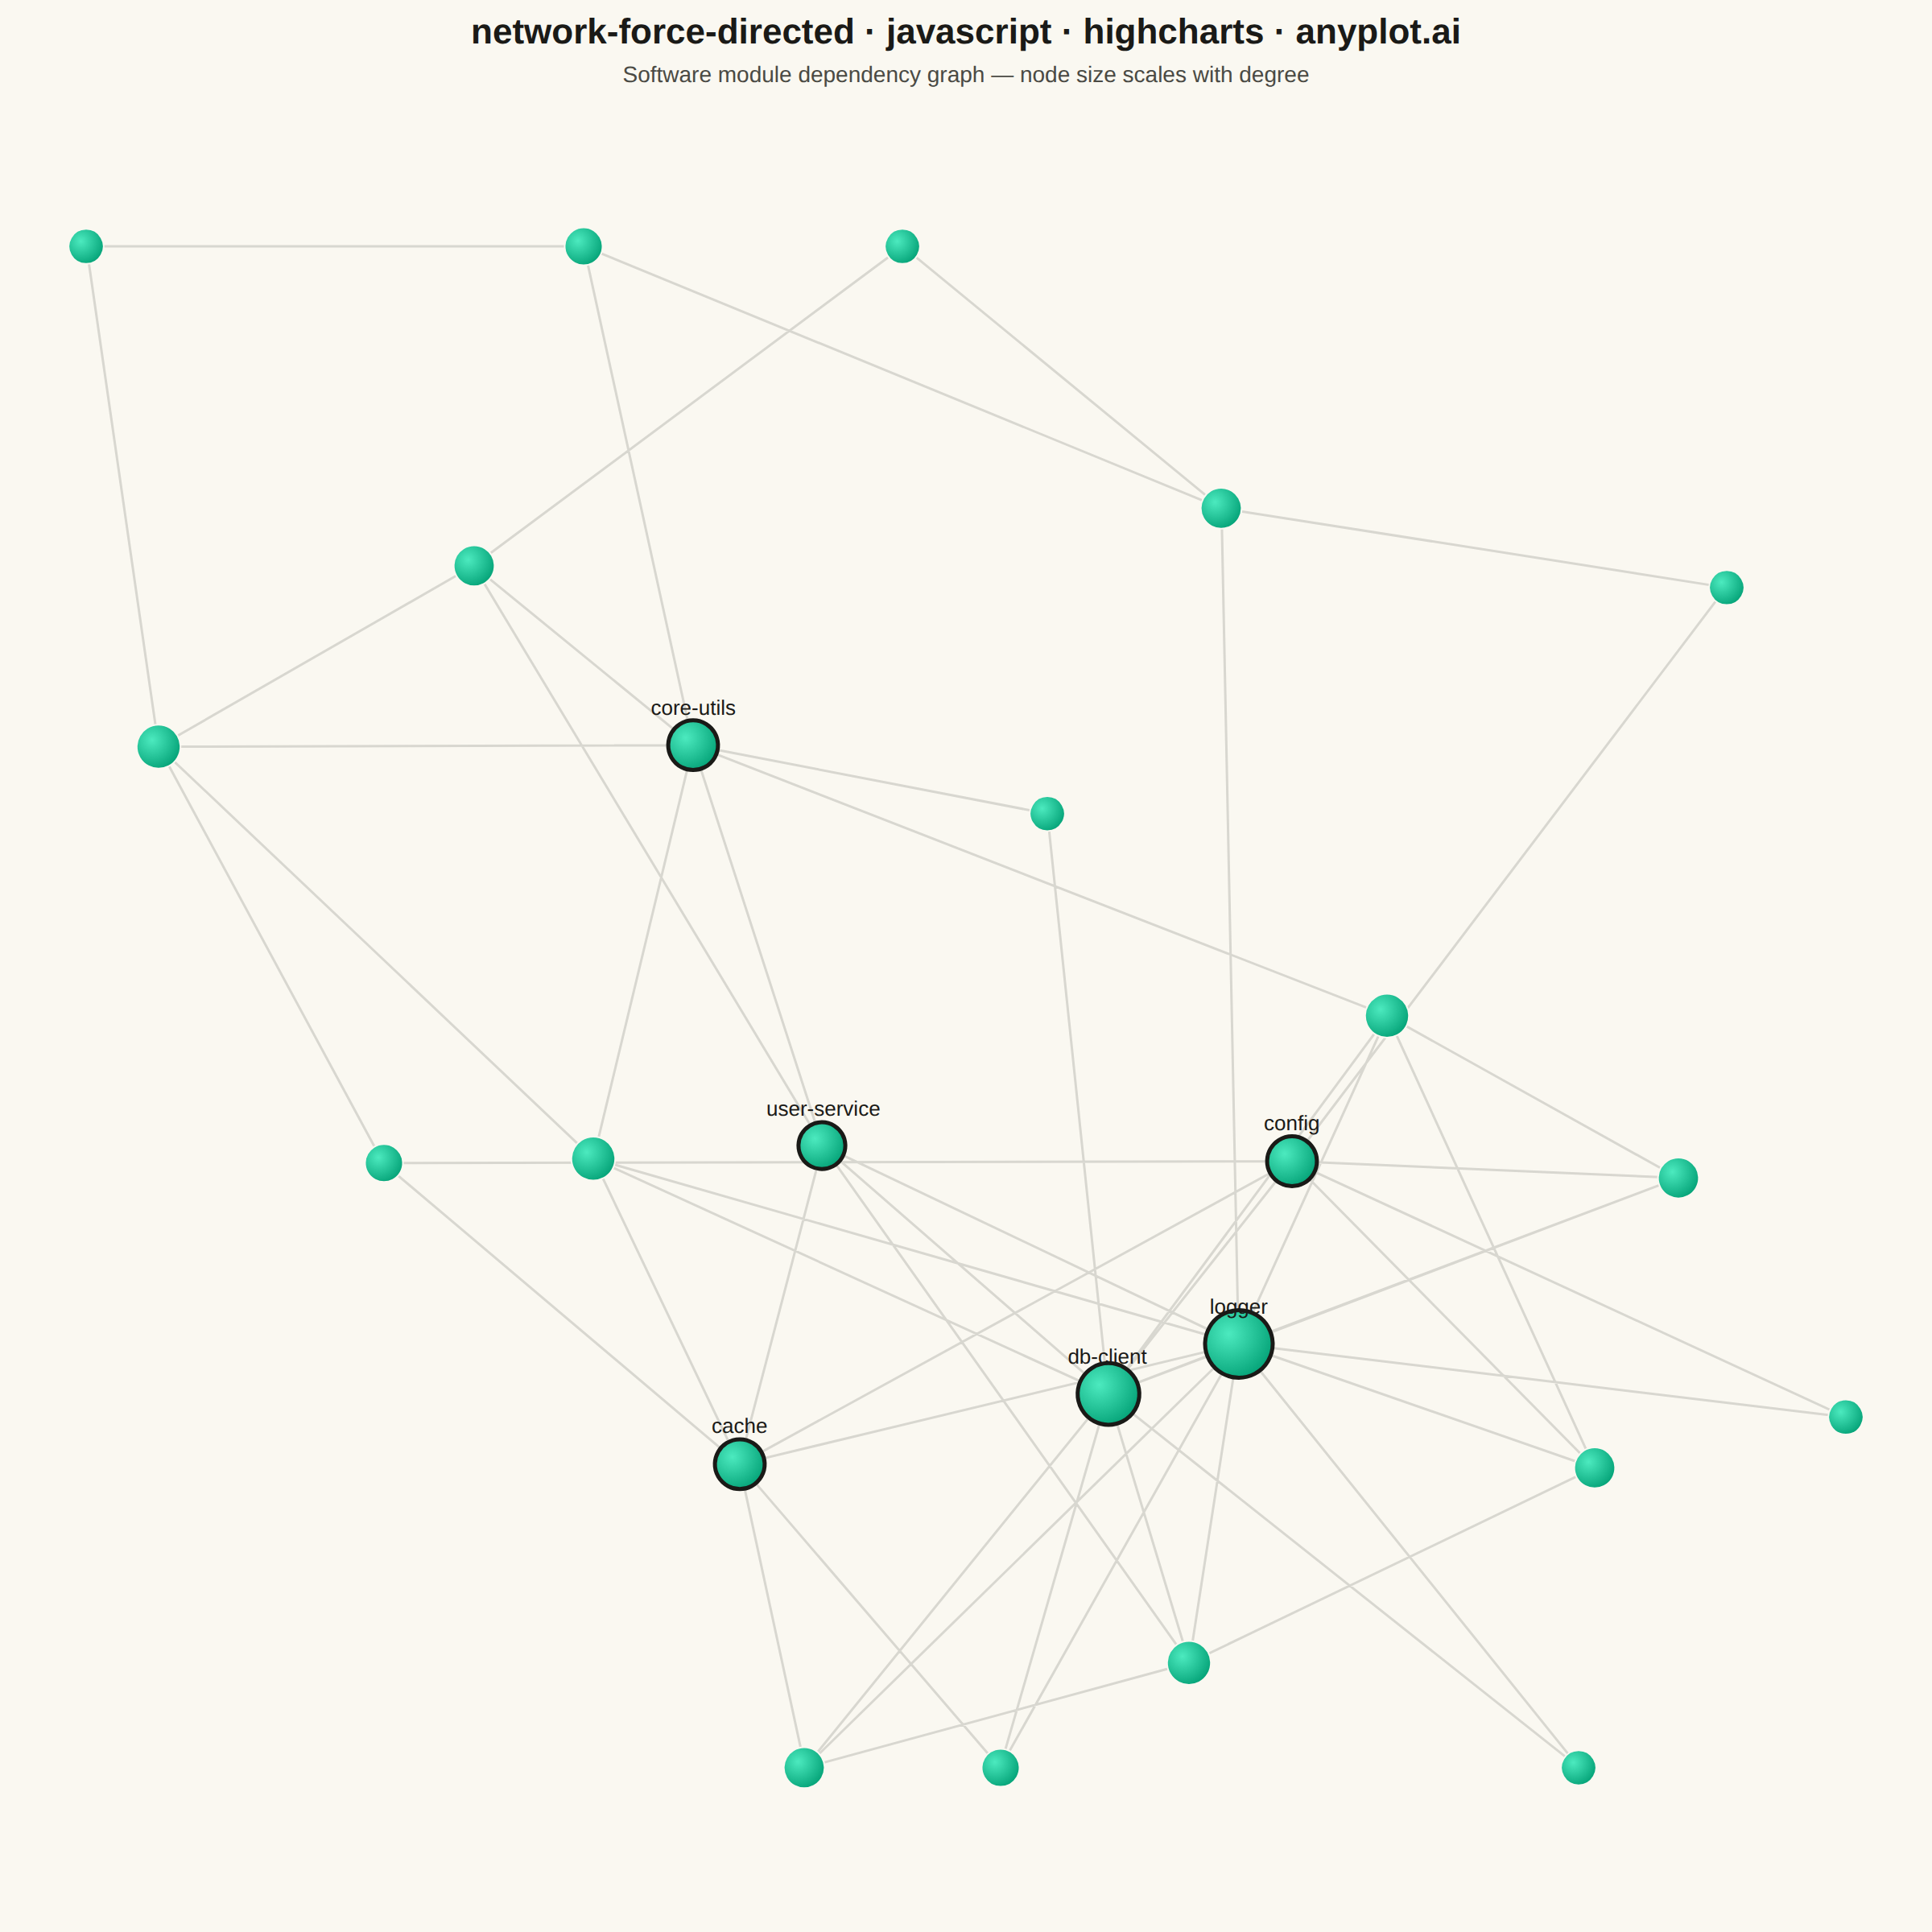
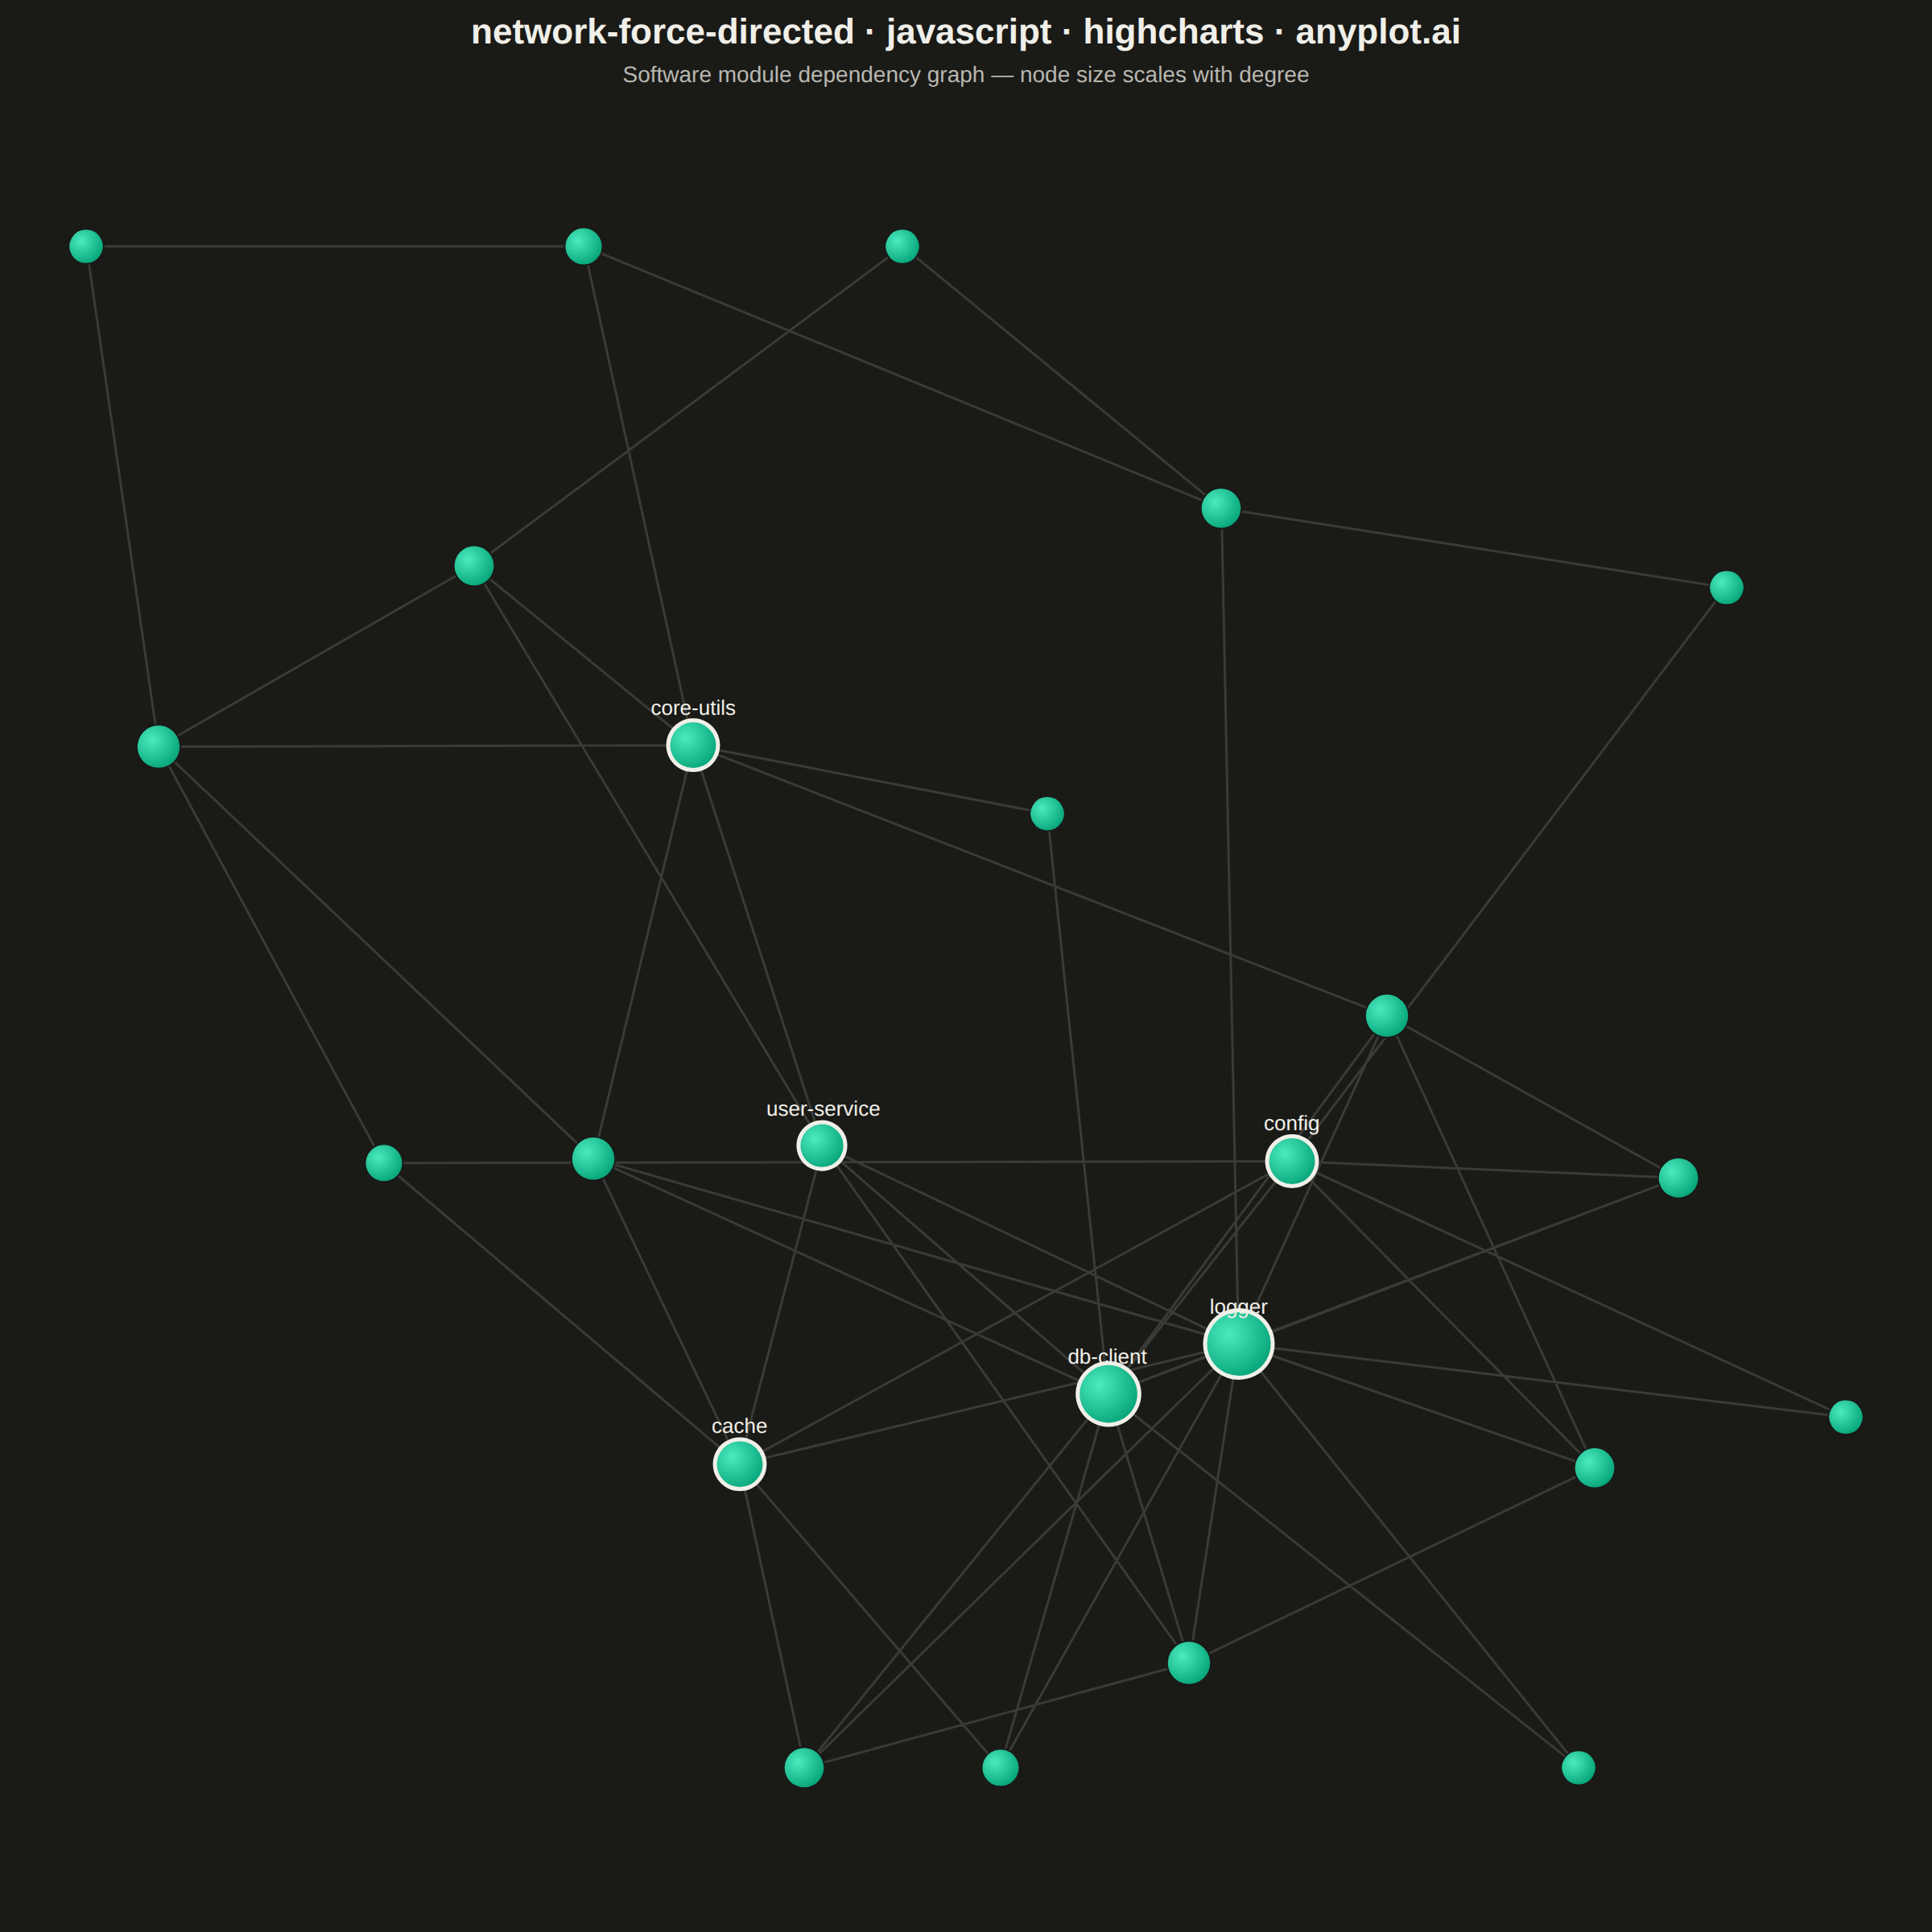
The same plot in 14 other libraries — JavaScript: Chart.js, D3.js, Apache ECharts, MUI X Charts; Python: Altair, Bokeh, lets-plot, Matplotlib, Plotly, plotnine, Pygal, Seaborn; R: ggplot2; Julia: Makie.jl. Compare all 15 side by side: Force-Directed Graph in Python, R, Julia and JavaScript.
A force-directed graph uses physics simulation to position nodes, where connected nodes attract each other and all nodes repel. This creates organic layouts that naturally reveal community structure, central nodes, and overall network topology without manual positioning. The algorithm balances attractive forces (edges pulling connected nodes together) and repulsive forces (nodes pushing apart) until reaching equilibrium.
// anyplot.ai
// network-force-directed: Force-Directed Graph
// Library: highcharts 12.6.0 | JavaScript 22.23.2
// Quality: 93/100 | Created: 2026-08-24

//# anyplot-orientation: square
const t = window.ANYPLOT_TOKENS;

// --- Data: a software module dependency graph (in-memory, deterministic) ---
const nodeIds = [
  "core-utils", "config", "logger",
  "db-client", "cache", "query-builder", "migration-runner",
  "api-gateway", "auth-service", "rate-limiter", "validation",
  "user-service", "billing-service", "notification-service",
  "order-service", "inventory-service", "payment-processor",
  "ui-components", "state-store", "router", "form-validator", "theme-engine",
  "metrics-collector", "health-check",
];

const edgePairs = [
  ["api-gateway", "auth-service"], ["api-gateway", "rate-limiter"],
  ["api-gateway", "validation"], ["api-gateway", "core-utils"],
  ["auth-service", "db-client"], ["auth-service", "cache"],
  ["auth-service", "core-utils"], ["auth-service", "logger"],
  ["rate-limiter", "cache"], ["rate-limiter", "config"],
  ["validation", "core-utils"],
  ["user-service", "db-client"], ["user-service", "cache"],
  ["user-service", "validation"], ["user-service", "logger"],
  ["user-service", "core-utils"],
  ["billing-service", "db-client"], ["billing-service", "payment-processor"],
  ["billing-service", "notification-service"], ["billing-service", "logger"],
  ["billing-service", "core-utils"],
  ["payment-processor", "db-client"], ["payment-processor", "logger"],
  ["payment-processor", "config"],
  ["order-service", "db-client"], ["order-service", "inventory-service"],
  ["order-service", "notification-service"], ["order-service", "user-service"],
  ["order-service", "logger"],
  ["inventory-service", "db-client"], ["inventory-service", "cache"],
  ["inventory-service", "logger"],
  ["notification-service", "config"], ["notification-service", "logger"],
  ["db-client", "query-builder"], ["db-client", "migration-runner"],
  ["db-client", "config"], ["db-client", "logger"],
  ["cache", "config"], ["cache", "logger"],
  ["query-builder", "core-utils"], ["migration-runner", "logger"],
  ["ui-components", "theme-engine"], ["ui-components", "state-store"],
  ["ui-components", "logger"], ["theme-engine", "config"],
  ["router", "state-store"], ["router", "api-gateway"],
  ["form-validator", "ui-components"], ["form-validator", "validation"],
  ["state-store", "core-utils"],
  ["metrics-collector", "logger"], ["metrics-collector", "config"],
  ["health-check", "logger"], ["health-check", "db-client"],
  ["health-check", "cache"],
];

// --- Force-directed layout (Fruchterman-Reingold), computed in-memory ------
// Highcharts core has no networkgraph module, so the physics simulation runs
// here and the result is plotted as plain scatter points + line segments.
let lcgState = 42;
const nextRandom = () => {
  lcgState = (lcgState * 1103515245 + 12345) & 0x7fffffff;
  return lcgState / 0x7fffffff;
};

const nodeCount = nodeIds.length;
const indexById = new Map(nodeIds.map((id, i) => [id, i]));
const edges = edgePairs.map(([a, b]) => [indexById.get(a), indexById.get(b)]);
const degree = new Array(nodeCount).fill(0);
edges.forEach(([a, b]) => { degree[a] += 1; degree[b] += 1; });

const FIELD = 100;
const positions = nodeIds.map(() => ({
  x: nextRandom() * FIELD - FIELD / 2,
  y: nextRandom() * FIELD - FIELD / 2,
}));

const k = 0.75 * Math.sqrt((FIELD * FIELD) / nodeCount);
const gravity = 0.09; // pull-to-center so loosely-connected nodes don't drift too far
const bound = FIELD * 0.38; // hard wall — keeps a single weak leaf from stretching the frame
const iterations = 500;
let temperature = FIELD / 10;

for (let iter = 0; iter < iterations; iter += 1) {
  const disp = positions.map(() => ({ x: 0, y: 0 }));

  // Repulsive force between every pair of nodes.
  for (let i = 0; i < nodeCount; i += 1) {
    for (let j = i + 1; j < nodeCount; j += 1) {
      let dx = positions[i].x - positions[j].x;
      let dy = positions[i].y - positions[j].y;
      let dist = Math.sqrt(dx * dx + dy * dy) || 0.01;
      const force = (k * k) / dist;
      dx = (dx / dist) * force;
      dy = (dy / dist) * force;
      disp[i].x += dx; disp[i].y += dy;
      disp[j].x -= dx; disp[j].y -= dy;
    }
  }

  // Attractive force along each edge.
  edges.forEach(([a, b]) => {
    let dx = positions[a].x - positions[b].x;
    let dy = positions[a].y - positions[b].y;
    let dist = Math.sqrt(dx * dx + dy * dy) || 0.01;
    const force = (dist * dist) / k;
    dx = (dx / dist) * force;
    dy = (dy / dist) * force;
    disp[a].x -= dx; disp[a].y -= dy;
    disp[b].x += dx; disp[b].y += dy;
  });

  // Weak centering force keeps loosely-connected branches from drifting away.
  for (let i = 0; i < nodeCount; i += 1) {
    disp[i].x -= positions[i].x * gravity;
    disp[i].y -= positions[i].y * gravity;
  }

  // Apply capped displacement, cooling the temperature over time, then clamp
  // to a hard boundary so no single weakly-attached node can stretch the frame.
  for (let i = 0; i < nodeCount; i += 1) {
    const dist = Math.sqrt(disp[i].x ** 2 + disp[i].y ** 2) || 0.01;
    const capped = Math.min(dist, temperature);
    positions[i].x = Math.max(-bound, Math.min(bound, positions[i].x + (disp[i].x / dist) * capped));
    positions[i].y = Math.max(-bound, Math.min(bound, positions[i].y + (disp[i].y / dist) * capped));
  }
  temperature *= 0.99;
}

// Center on the bounding-box midpoint (robust to a single peripheral node —
// centering on the mean would let one outlier skew the whole frame), then
// frame both axes to the actual footprint (equal range keeps proportions).
const xs = positions.map((p) => p.x);
const ys = positions.map((p) => p.y);
const centerX = (Math.min(...xs) + Math.max(...xs)) / 2;
const centerY = (Math.min(...ys) + Math.max(...ys)) / 2;
positions.forEach((p) => { p.x -= centerX; p.y -= centerY; });

const extent = Math.max(...positions.map((p) => Math.max(Math.abs(p.x), Math.abs(p.y)))) * 1.08;

const maxDegree = Math.max(...degree);
const hubThreshold = 6;

// --- Chart -------------------------------------------------------------
const edgeSeriesData = [];
edges.forEach(([a, b]) => {
  edgeSeriesData.push({ x: positions[a].x, y: positions[a].y });
  edgeSeriesData.push({ x: positions[b].x, y: positions[b].y });
  edgeSeriesData.push(null);
});

// Radial gradient fill (light-to-brand-green) gives every node a subtle 3D
// lift; hub nodes additionally get a heavier, ink-colored stroke so degree
// reads through both size AND a second visual channel.
const nodeFill = {
  radialGradient: { cx: 0.35, cy: 0.35, r: 0.75 },
  stops: [
    [0, Highcharts.color(t.palette[0]).brighten(0.3).get()],
    [1, t.palette[0]],
  ],
};

const nodeSeriesData = nodeIds.map((id, i) => {
  const isHub = degree[i] >= hubThreshold;
  return {
    x: positions[i].x,
    y: positions[i].y,
    name: id,
    degree: degree[i],
    marker: {
      symbol: "circle",
      radius: 9 + (degree[i] / maxDegree) * 12,
      fillColor: nodeFill,
      lineColor: isHub ? t.ink : t.pageBg,
      lineWidth: isHub ? 2.5 : 1,
    },
    dataLabels: { enabled: isHub },
  };
});

Highcharts.chart("container", {
  chart: {
    type: "scatter", backgroundColor: "transparent", animation: false,
    style: { fontFamily: "inherit" },
  },
  credits: { enabled: false },
  title: {
    text: "network-force-directed · javascript · highcharts · anyplot.ai",
    style: { color: t.ink, fontSize: "22px", fontWeight: "600" },
  },
  subtitle: {
    text: "Software module dependency graph — node size scales with degree",
    style: { color: t.inkSoft, fontSize: "14px" },
  },
  xAxis: { visible: false, min: -extent, max: extent },
  yAxis: { visible: false, min: -extent, max: extent, title: { text: null } },
  legend: { enabled: false },
  tooltip: {
    formatter() {
      return this.point.name
        ? `<b>${this.point.name}</b><br/>connections: ${this.point.degree}`
        : false;
    },
  },
  plotOptions: { series: { animation: false } },
  series: [
    {
      name: "Dependencies",
      type: "line",
      data: edgeSeriesData,
      color: t.grid,
      lineWidth: 1.5,
      marker: { enabled: false },
      enableMouseTracking: false,
      connectNulls: false,
    },
    {
      name: "Modules",
      type: "scatter",
      data: nodeSeriesData,
      color: t.palette[0],
      marker: { symbol: "circle", fillColor: nodeFill, lineColor: t.pageBg, lineWidth: 1 },
      dataLabels: {
        formatter() { return this.point.name; },
        style: { color: t.ink, fontSize: "13px", fontWeight: "500", textOutline: "none" },
        y: -12,
        allowOverlap: false,
      },
    },
  ],
});
Runnable source as JSON, for any HTTP client: https://api.anyplot.ai/specs/network-force-directed/highcharts/code. Any spec id and library id listed in llms-full.txt fit the same URL shape; every URL below is complete and callable.
{
  "spec_id": "network-force-directed",
  "language": "javascript",
  "library": "highcharts",
  "page": "https://anyplot.ai/network-force-directed/javascript/highcharts",
  "hub": "https://anyplot.ai/network-force-directed",
  "code_json": "https://api.anyplot.ai/specs/network-force-directed/highcharts/code",
  "spec_json": "https://api.anyplot.ai/specs/network-force-directed",
  "render_light_png": "https://storage.googleapis.com/anyplot-images/plots/network-force-directed/javascript/highcharts/plot-light.png",
  "render_dark_png": "https://storage.googleapis.com/anyplot-images/plots/network-force-directed/javascript/highcharts/plot-dark.png",
  "interactive_light_html": "https://storage.googleapis.com/anyplot-images/plots/network-force-directed/javascript/highcharts/plot-light.html",
  "interactive_dark_html": "https://storage.googleapis.com/anyplot-images/plots/network-force-directed/javascript/highcharts/plot-dark.html",
  "quality_score": 93.0,
  "license": "MIT",
  "guide": "https://anyplot.ai/llms.txt"
}
Part of Force-Directed Graph on anyplot.ai.