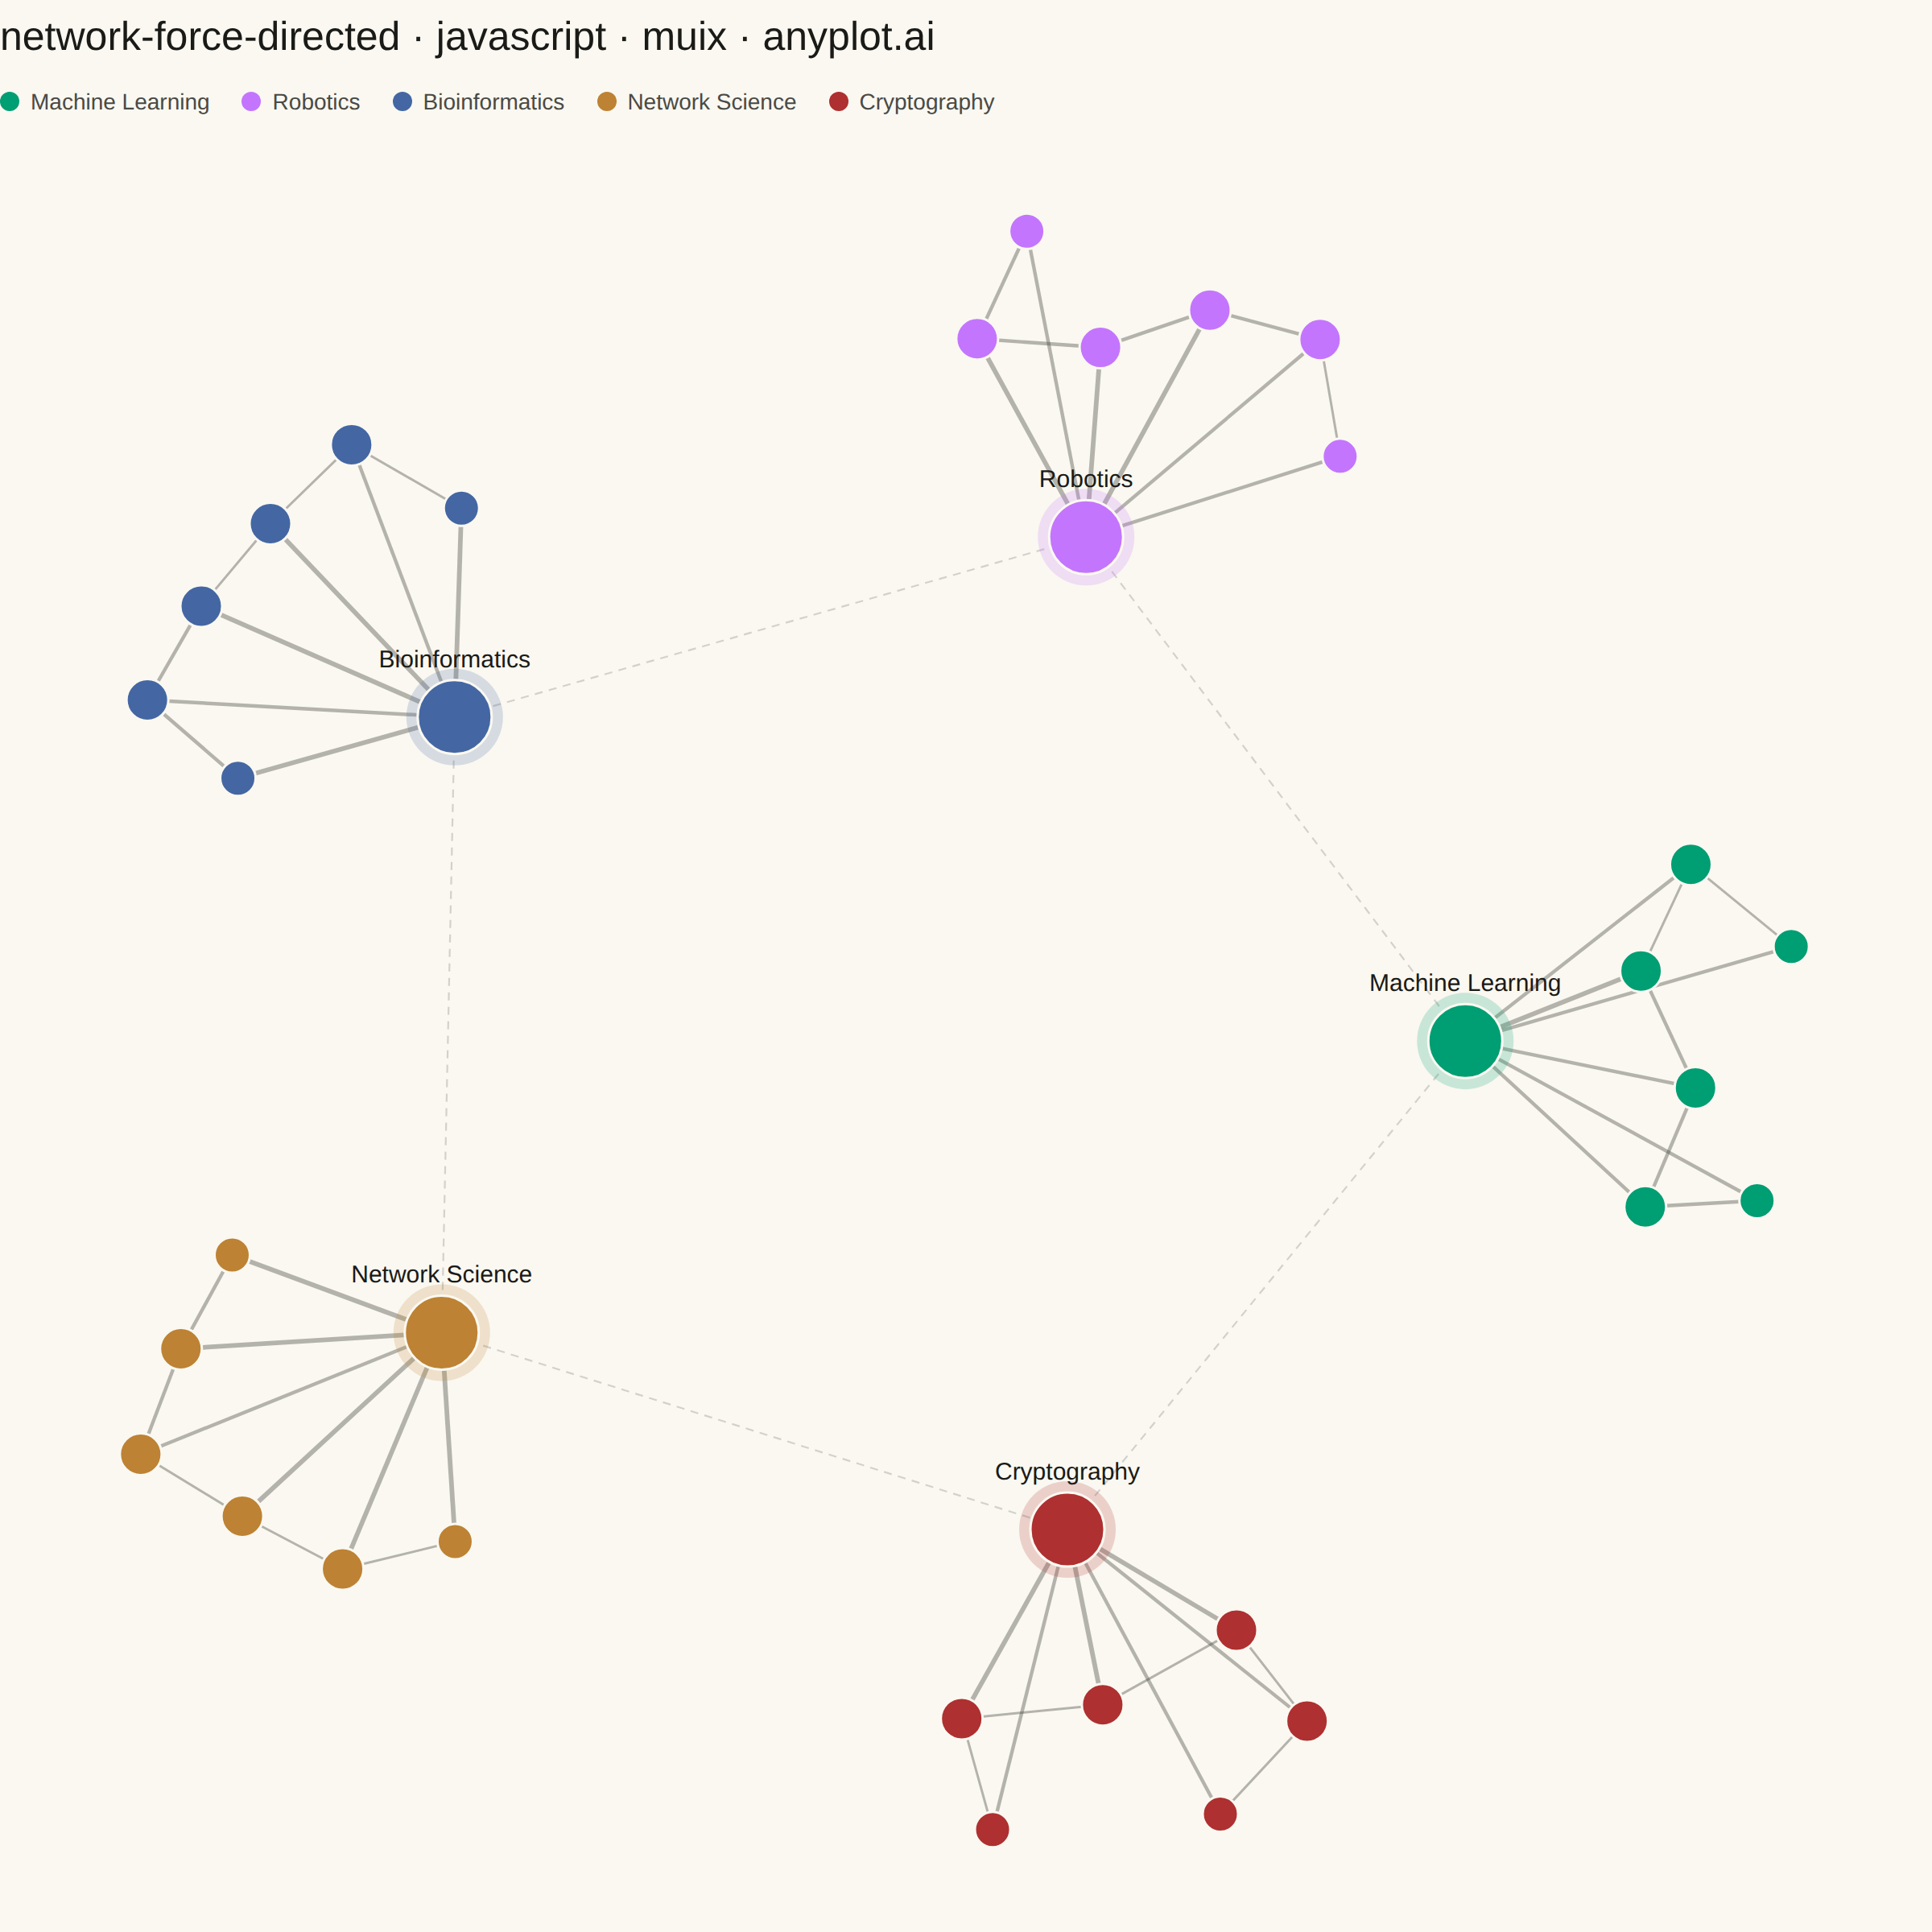
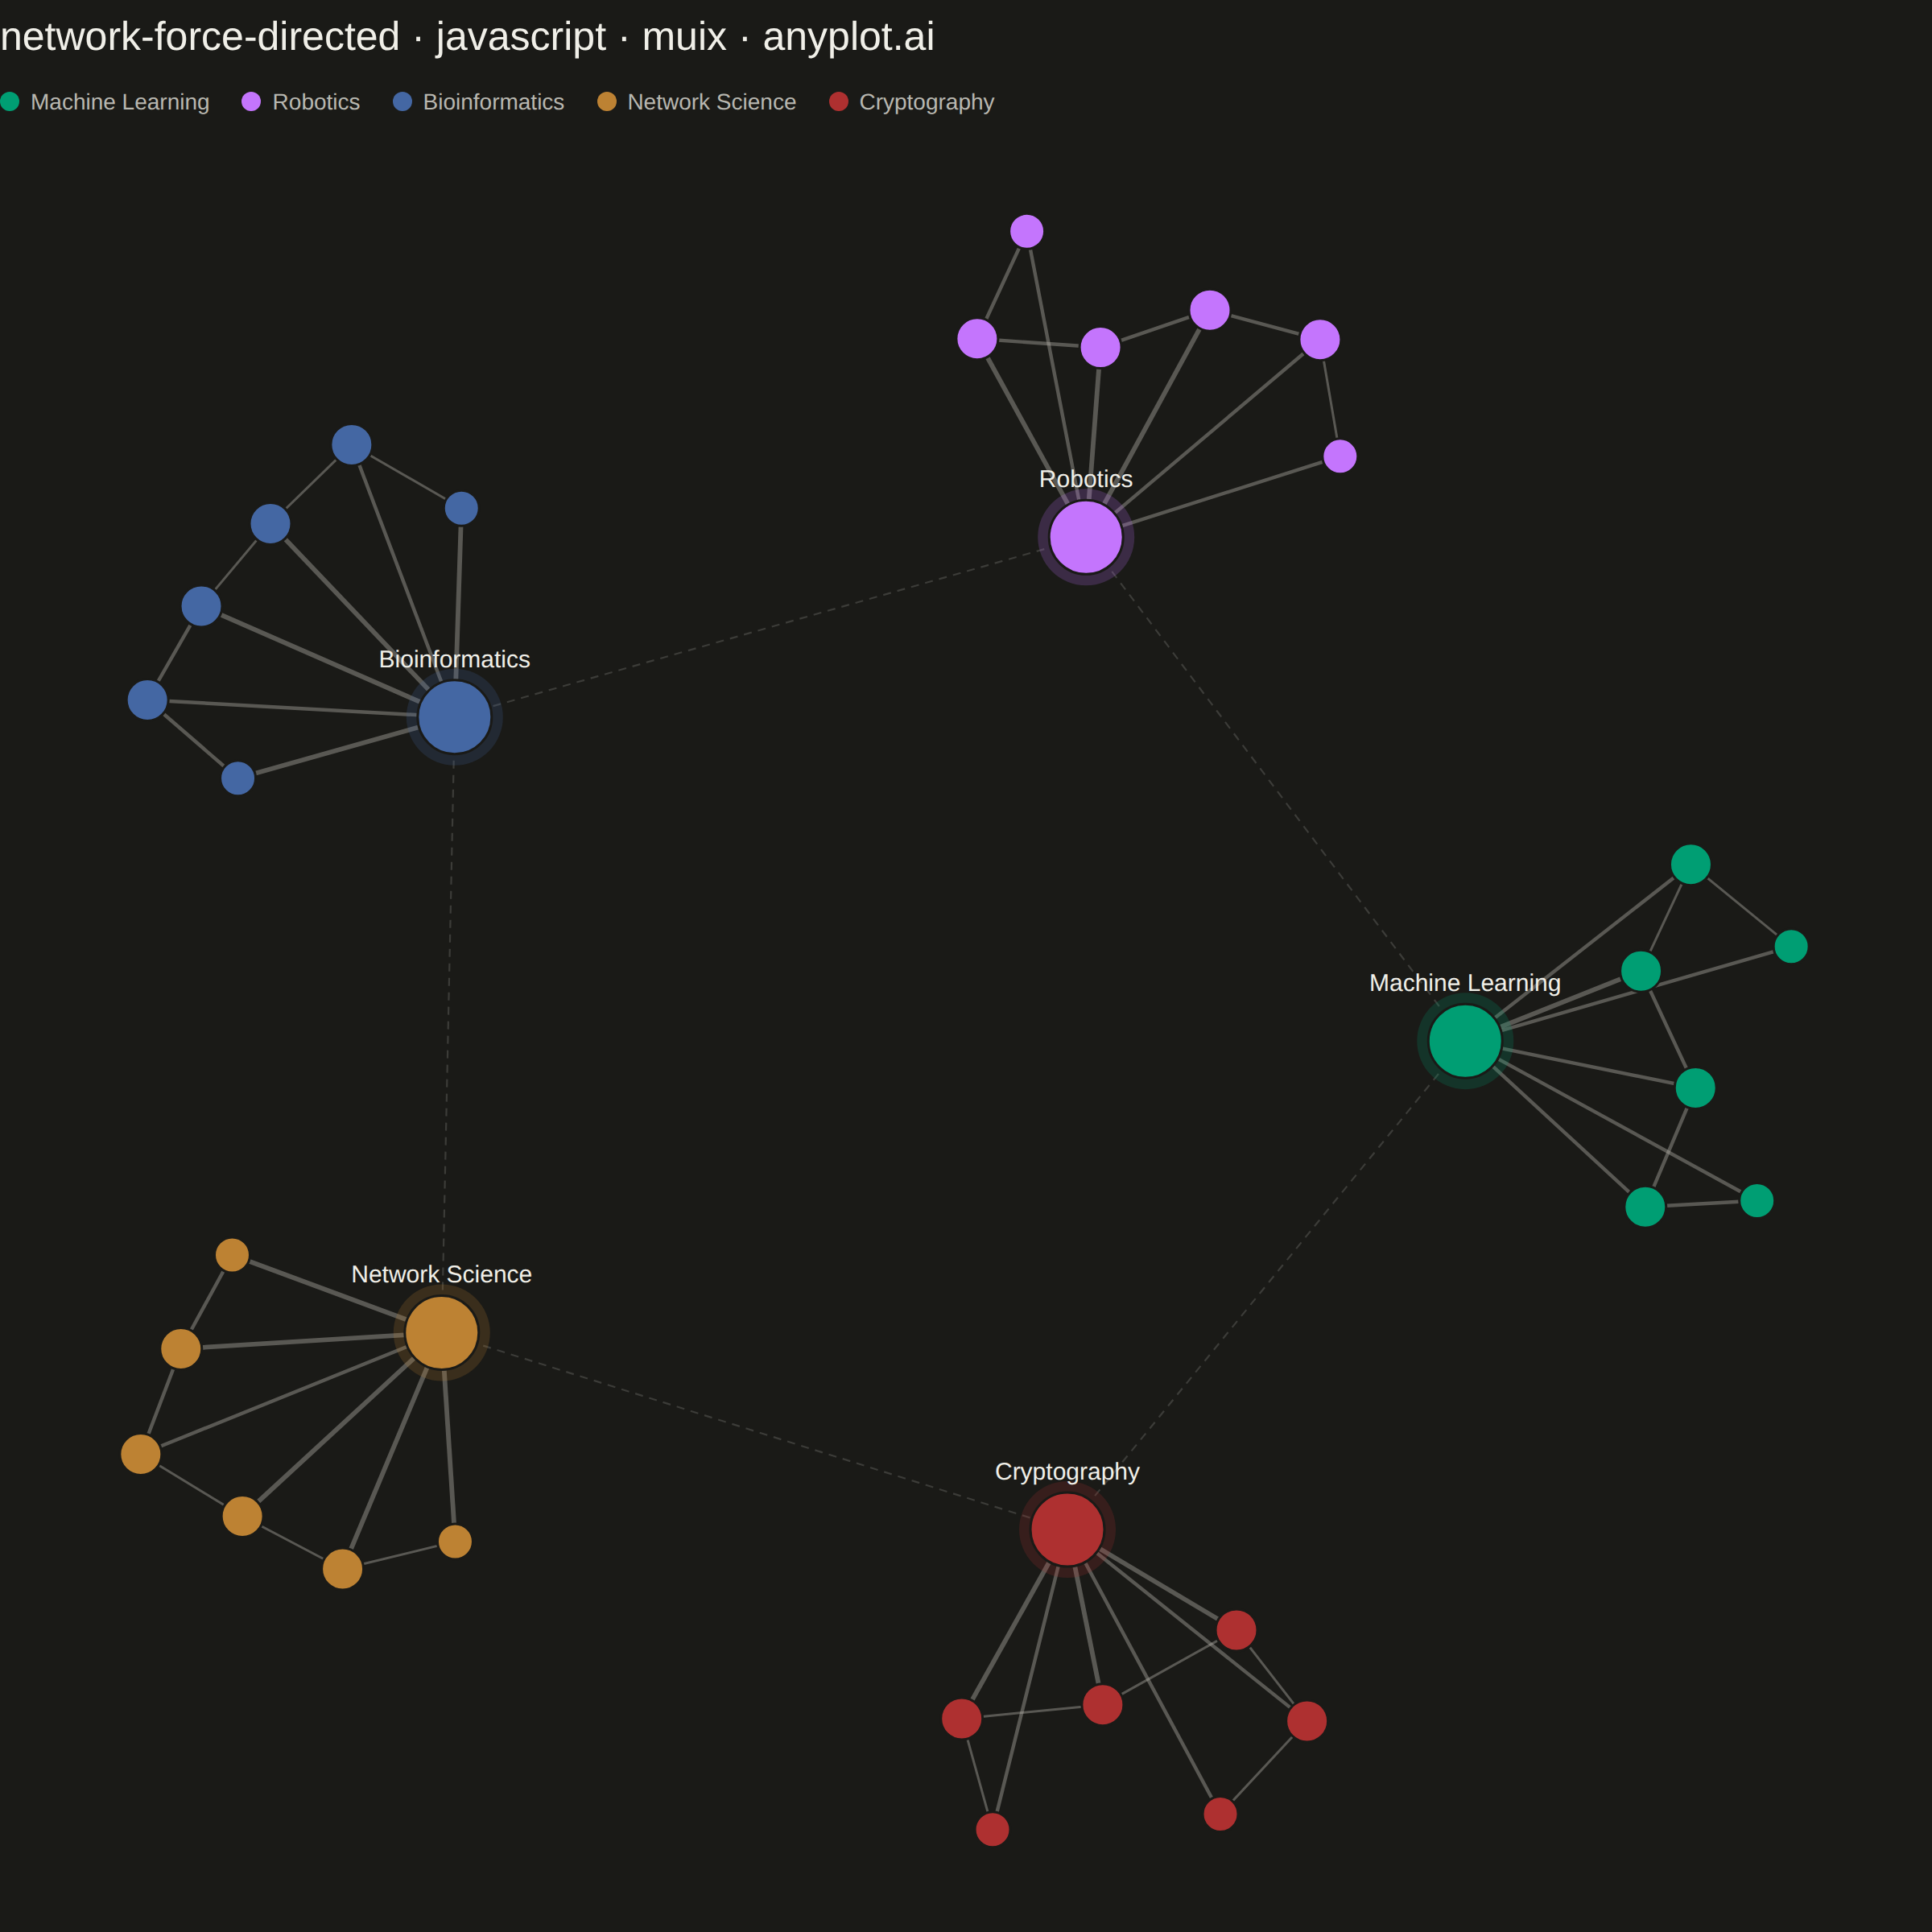
The same plot in 14 other libraries — JavaScript: Chart.js, D3.js, Apache ECharts, Highcharts; Python: Altair, Bokeh, lets-plot, Matplotlib, Plotly, plotnine, Pygal, Seaborn; R: ggplot2; Julia: Makie.jl. Compare all 15 side by side: Force-Directed Graph in Python, R, Julia and JavaScript.
A force-directed graph uses physics simulation to position nodes, where connected nodes attract each other and all nodes repel. This creates organic layouts that naturally reveal community structure, central nodes, and overall network topology without manual positioning. The algorithm balances attractive forces (edges pulling connected nodes together) and repulsive forces (nodes pushing apart) until reaching equilibrium.
// anyplot.ai
// network-force-directed: Force-Directed Graph
// Library: muix 7.29.1 | JavaScript 22.23.2
// Quality: 92/100 | Created: 2026-08-24
//# anyplot-orientation: square
// anyplot.ai
// network-force-directed: Force-Directed Graph
// Library: MUI X Charts | React | Node 22
// License: @mui/x-charts — MIT (community). Pro/Premium are out of scope.
// Quality: pending | Created: 2026-08-24
import * as React from "react";
import { ChartContainer } from "@mui/x-charts/ChartContainer";
import { useXScale, useYScale } from "@mui/x-charts/hooks";

const t = window.ANYPLOT_TOKENS;

// --- Data: research co-authorship network (in-memory, deterministic) -------
// Four research groups, each with a "lab lead" hub who co-authors with every
// group member, plus a peer chain within the group and a few inter-group
// bridge collaborations — the kind of modular structure force layouts are
// good at revealing.
const GROUPS = [
  { name: "Machine Learning" },
  { name: "Robotics" },
  { name: "Bioinformatics" },
  { name: "Network Science" },
  { name: "Cryptography" },
];
const GROUP_SIZE = 7;

// Tiny fixed-seed LCG — the browser has no seeded RNG.
function makeLcg(seed) {
  let state = seed;
  return () => {
    state = (state * 1664525 + 1013904223) % 4294967296;
    return state / 4294967296;
  };
}
const rand = makeLcg(42);

const groupRanges = GROUPS.map((_, groupIndex) => [
  groupIndex * GROUP_SIZE,
  groupIndex * GROUP_SIZE + GROUP_SIZE,
]);

const nodes = [];
GROUPS.forEach((group, groupIndex) => {
  for (let i = 0; i < GROUP_SIZE; i += 1) {
    nodes.push({
      id: `${groupIndex}-${i}`,
      group: groupIndex,
      isHub: i === 0,
      label: group.name,
      x: 0,
      y: 0,
    });
  }
});

// edges: [sourceIndex, targetIndex, weight, isBridge] — weight ~ co-authored
// papers; isBridge marks the thin inter-group collaborations so they can be
// styled (dashed, lower alpha) distinctly from intra-group edges.
const edges = [];
groupRanges.forEach(([start, end]) => {
  const hub = start; // lab lead co-authors with every member
  for (let i = start + 1; i < end; i += 1) {
    edges.push([hub, i, 2 + Math.floor(rand() * 2), false]);
  }
  for (let i = start + 1; i < end - 1; i += 1) {
    edges.push([i, i + 1, 1 + Math.floor(rand() * 2), false]); // peer chain
  }
});
groupRanges.forEach(([start], groupIndex) => {
  const [nextStart] = groupRanges[(groupIndex + 1) % groupRanges.length];
  edges.push([start, nextStart, 1, true]); // thin cross-group bridge between hubs
});

const degree = new Array(nodes.length).fill(0);
edges.forEach(([a, b]) => {
  degree[a] += 1;
  degree[b] += 1;
});
const maxDegree = Math.max(...degree);

// --- Initial layout: cluster around a per-group anchor on a ring -----------
const GROUP_CENTERS = GROUPS.map((_, i) => {
  const angle = (i / GROUPS.length) * Math.PI * 2;
  return { x: Math.cos(angle) * 260, y: Math.sin(angle) * 260 };
});
nodes.forEach((node, idx) => {
  const [start] = groupRanges[node.group];
  const within = idx - start;
  const angle = (within / GROUP_SIZE) * Math.PI * 2;
  const center = GROUP_CENTERS[node.group];
  node.x = center.x + Math.cos(angle) * 70 + (rand() - 0.5) * 24;
  node.y = center.y + Math.sin(angle) * 70 + (rand() - 0.5) * 24;
});

// --- Force-directed simulation (Fruchterman-Reingold, fixed iterations) ----
const IDEAL_DISTANCE = Math.sqrt((1000 * 1000) / nodes.length);
const ITERATIONS = 300;
let temperature = 80;
const COOLING = temperature / ITERATIONS;

for (let iter = 0; iter < ITERATIONS; iter += 1) {
  const dispX = new Array(nodes.length).fill(0);
  const dispY = new Array(nodes.length).fill(0);

  for (let i = 0; i < nodes.length; i += 1) {
    for (let j = i + 1; j < nodes.length; j += 1) {
      const dx = nodes[i].x - nodes[j].x;
      const dy = nodes[i].y - nodes[j].y;
      const dist = Math.sqrt(dx * dx + dy * dy) || 0.01;
      const force = (IDEAL_DISTANCE * IDEAL_DISTANCE) / dist;
      const fx = (dx / dist) * force;
      const fy = (dy / dist) * force;
      dispX[i] += fx;
      dispY[i] += fy;
      dispX[j] -= fx;
      dispY[j] -= fy;
    }
  }

  edges.forEach(([a, b, weight]) => {
    const dx = nodes[a].x - nodes[b].x;
    const dy = nodes[a].y - nodes[b].y;
    const dist = Math.sqrt(dx * dx + dy * dy) || 0.01;
    const force = ((dist * dist) / IDEAL_DISTANCE) * (0.6 + weight * 0.2);
    const fx = (dx / dist) * force;
    const fy = (dy / dist) * force;
    dispX[a] -= fx;
    dispY[a] -= fy;
    dispX[b] += fx;
    dispY[b] += fy;
  });

  nodes.forEach((node, i) => {
    dispX[i] -= node.x * 0.01; // mild centering gravity
    dispY[i] -= node.y * 0.01;
    const dist = Math.sqrt(dispX[i] * dispX[i] + dispY[i] * dispY[i]) || 0.01;
    const capped = Math.min(dist, temperature);
    node.x += (dispX[i] / dist) * capped;
    node.y += (dispY[i] / dist) * capped;
  });

  temperature = Math.max(temperature - COOLING, 1);
}

// Square, padded domain so the layout renders with equal x/y scale.
const xs = nodes.map((n) => n.x);
const ys = nodes.map((n) => n.y);
const PADDING = 110;
const xMid = (Math.min(...xs) + Math.max(...xs)) / 2;
const yMid = (Math.min(...ys) + Math.max(...ys)) / 2;
const span = Math.max(Math.max(...xs) - Math.min(...xs), Math.max(...ys) - Math.min(...ys)) + PADDING * 2;
const domain = {
  xMin: xMid - span / 2,
  xMax: xMid + span / 2,
  yMin: yMid - span / 2,
  yMax: yMid + span / 2,
};

const nodeRadius = (i) => 7 + (degree[i] / maxDegree) * 16;

// --- Custom SVG layers, positioned via the chart's own scales --------------
function GraphEdges() {
  const xScale = useXScale();
  const yScale = useYScale();
  return (
    <g data-drawing-container>
      {edges.map(([a, b, weight, isBridge], i) => (
        <line
          key={`edge-${i}`}
          x1={xScale(nodes[a].x)}
          y1={yScale(nodes[a].y)}
          x2={xScale(nodes[b].x)}
          y2={yScale(nodes[b].y)}
          stroke={t.inkSoft}
          strokeOpacity={isBridge ? 0.22 : 0.4}
          strokeWidth={isBridge ? 1.1 : 0.8 + weight * 0.7}
          strokeDasharray={isBridge ? "5,4" : undefined}
        />
      ))}
    </g>
  );
}

function GraphNodes() {
  const xScale = useXScale();
  const yScale = useYScale();
  return (
    <g data-drawing-container>
      {nodes.map((node, i) => (
        <React.Fragment key={node.id}>
          {node.isHub && (
            <circle
              cx={xScale(node.x)}
              cy={yScale(node.y)}
              r={nodeRadius(i) + 7}
              fill={t.palette[node.group]}
              opacity={0.2}
            />
          )}
          <circle
            cx={xScale(node.x)}
            cy={yScale(node.y)}
            r={nodeRadius(i)}
            fill={t.palette[node.group]}
            stroke={t.pageBg}
            strokeWidth={1.5}
          />
          {node.isHub && (
            <text
              x={xScale(node.x)}
              y={yScale(node.y) - nodeRadius(i) - 8}
              textAnchor="middle"
              fontSize={15}
              fill={t.ink}
            >
              {node.label}
            </text>
          )}
        </React.Fragment>
      ))}
    </g>
  );
}

// --- Title + legend chrome ---------------------------------------------------
const TITLE = "network-force-directed · javascript · muix · anyplot.ai";
const TITLE_FONT_DEFAULT = 25;
const titleFontSize =
  TITLE.length > 67 ? Math.round(TITLE_FONT_DEFAULT * (67 / TITLE.length)) : TITLE_FONT_DEFAULT;
const TITLE_H = 46;
const LEGEND_H = 34;

function Legend() {
  return (
    <div style={{ height: LEGEND_H, display: "flex", alignItems: "center", gap: "20px", flexWrap: "wrap" }}>
      {GROUPS.map((group, i) => (
        <div key={group.name} style={{ display: "flex", alignItems: "center", gap: "7px" }}>
          <span
            style={{
              width: "12px",
              height: "12px",
              borderRadius: "50%",
              backgroundColor: t.palette[i],
              display: "inline-block",
            }}
          />
          <span style={{ fontSize: "14px", color: t.inkSoft }}>{group.name}</span>
        </div>
      ))}
    </div>
  );
}

// --- Chart (default-exported component — the harness mounts it) ------------
export default function Chart() {
  const { width, height } = window.ANYPLOT_SIZE;
  const chartHeight = height - TITLE_H - LEGEND_H;

  return (
    <div style={{ width, height, display: "flex", flexDirection: "column" }}>
      <div
        style={{
          height: `${TITLE_H}px`,
          lineHeight: `${TITLE_H}px`,
          fontSize: `${titleFontSize}px`,
          fontWeight: 500,
          color: t.ink,
        }}
      >
        {TITLE}
      </div>
      <Legend />
      <ChartContainer
        width={width}
        height={chartHeight}
        series={[]}
        margin={{ top: 8, bottom: 8, left: 8, right: 8 }}
        xAxis={[{ id: "x", scaleType: "linear", min: domain.xMin, max: domain.xMax }]}
        yAxis={[{ id: "y", scaleType: "linear", min: domain.yMin, max: domain.yMax }]}
        skipAnimation
      >
        <GraphEdges />
        <GraphNodes />
      </ChartContainer>
    </div>
  );
}
Runnable source as JSON, for any HTTP client: https://api.anyplot.ai/specs/network-force-directed/muix/code. Any spec id and library id listed in llms-full.txt fit the same URL shape; every URL below is complete and callable.
{
  "spec_id": "network-force-directed",
  "language": "javascript",
  "library": "muix",
  "page": "https://anyplot.ai/network-force-directed/javascript/muix",
  "hub": "https://anyplot.ai/network-force-directed",
  "code_json": "https://api.anyplot.ai/specs/network-force-directed/muix/code",
  "spec_json": "https://api.anyplot.ai/specs/network-force-directed",
  "render_light_png": "https://storage.googleapis.com/anyplot-images/plots/network-force-directed/javascript/muix/plot-light.png",
  "render_dark_png": "https://storage.googleapis.com/anyplot-images/plots/network-force-directed/javascript/muix/plot-dark.png",
  "interactive_light_html": "https://storage.googleapis.com/anyplot-images/plots/network-force-directed/javascript/muix/plot-light.html",
  "interactive_dark_html": "https://storage.googleapis.com/anyplot-images/plots/network-force-directed/javascript/muix/plot-dark.html",
  "quality_score": 92.0,
  "license": "MIT",
  "guide": "https://anyplot.ai/llms.txt"
}
Part of Force-Directed Graph on anyplot.ai.