The same plot in 14 other libraries — JavaScript: Chart.js, D3.js, Highcharts, MUI X Charts; Python: Altair, Bokeh, lets-plot, Matplotlib, Plotly, plotnine, Pygal, Seaborn; R: ggplot2; Julia: Makie.jl. Compare all 15 side by side: Force-Directed Graph in Python, R, Julia and JavaScript.
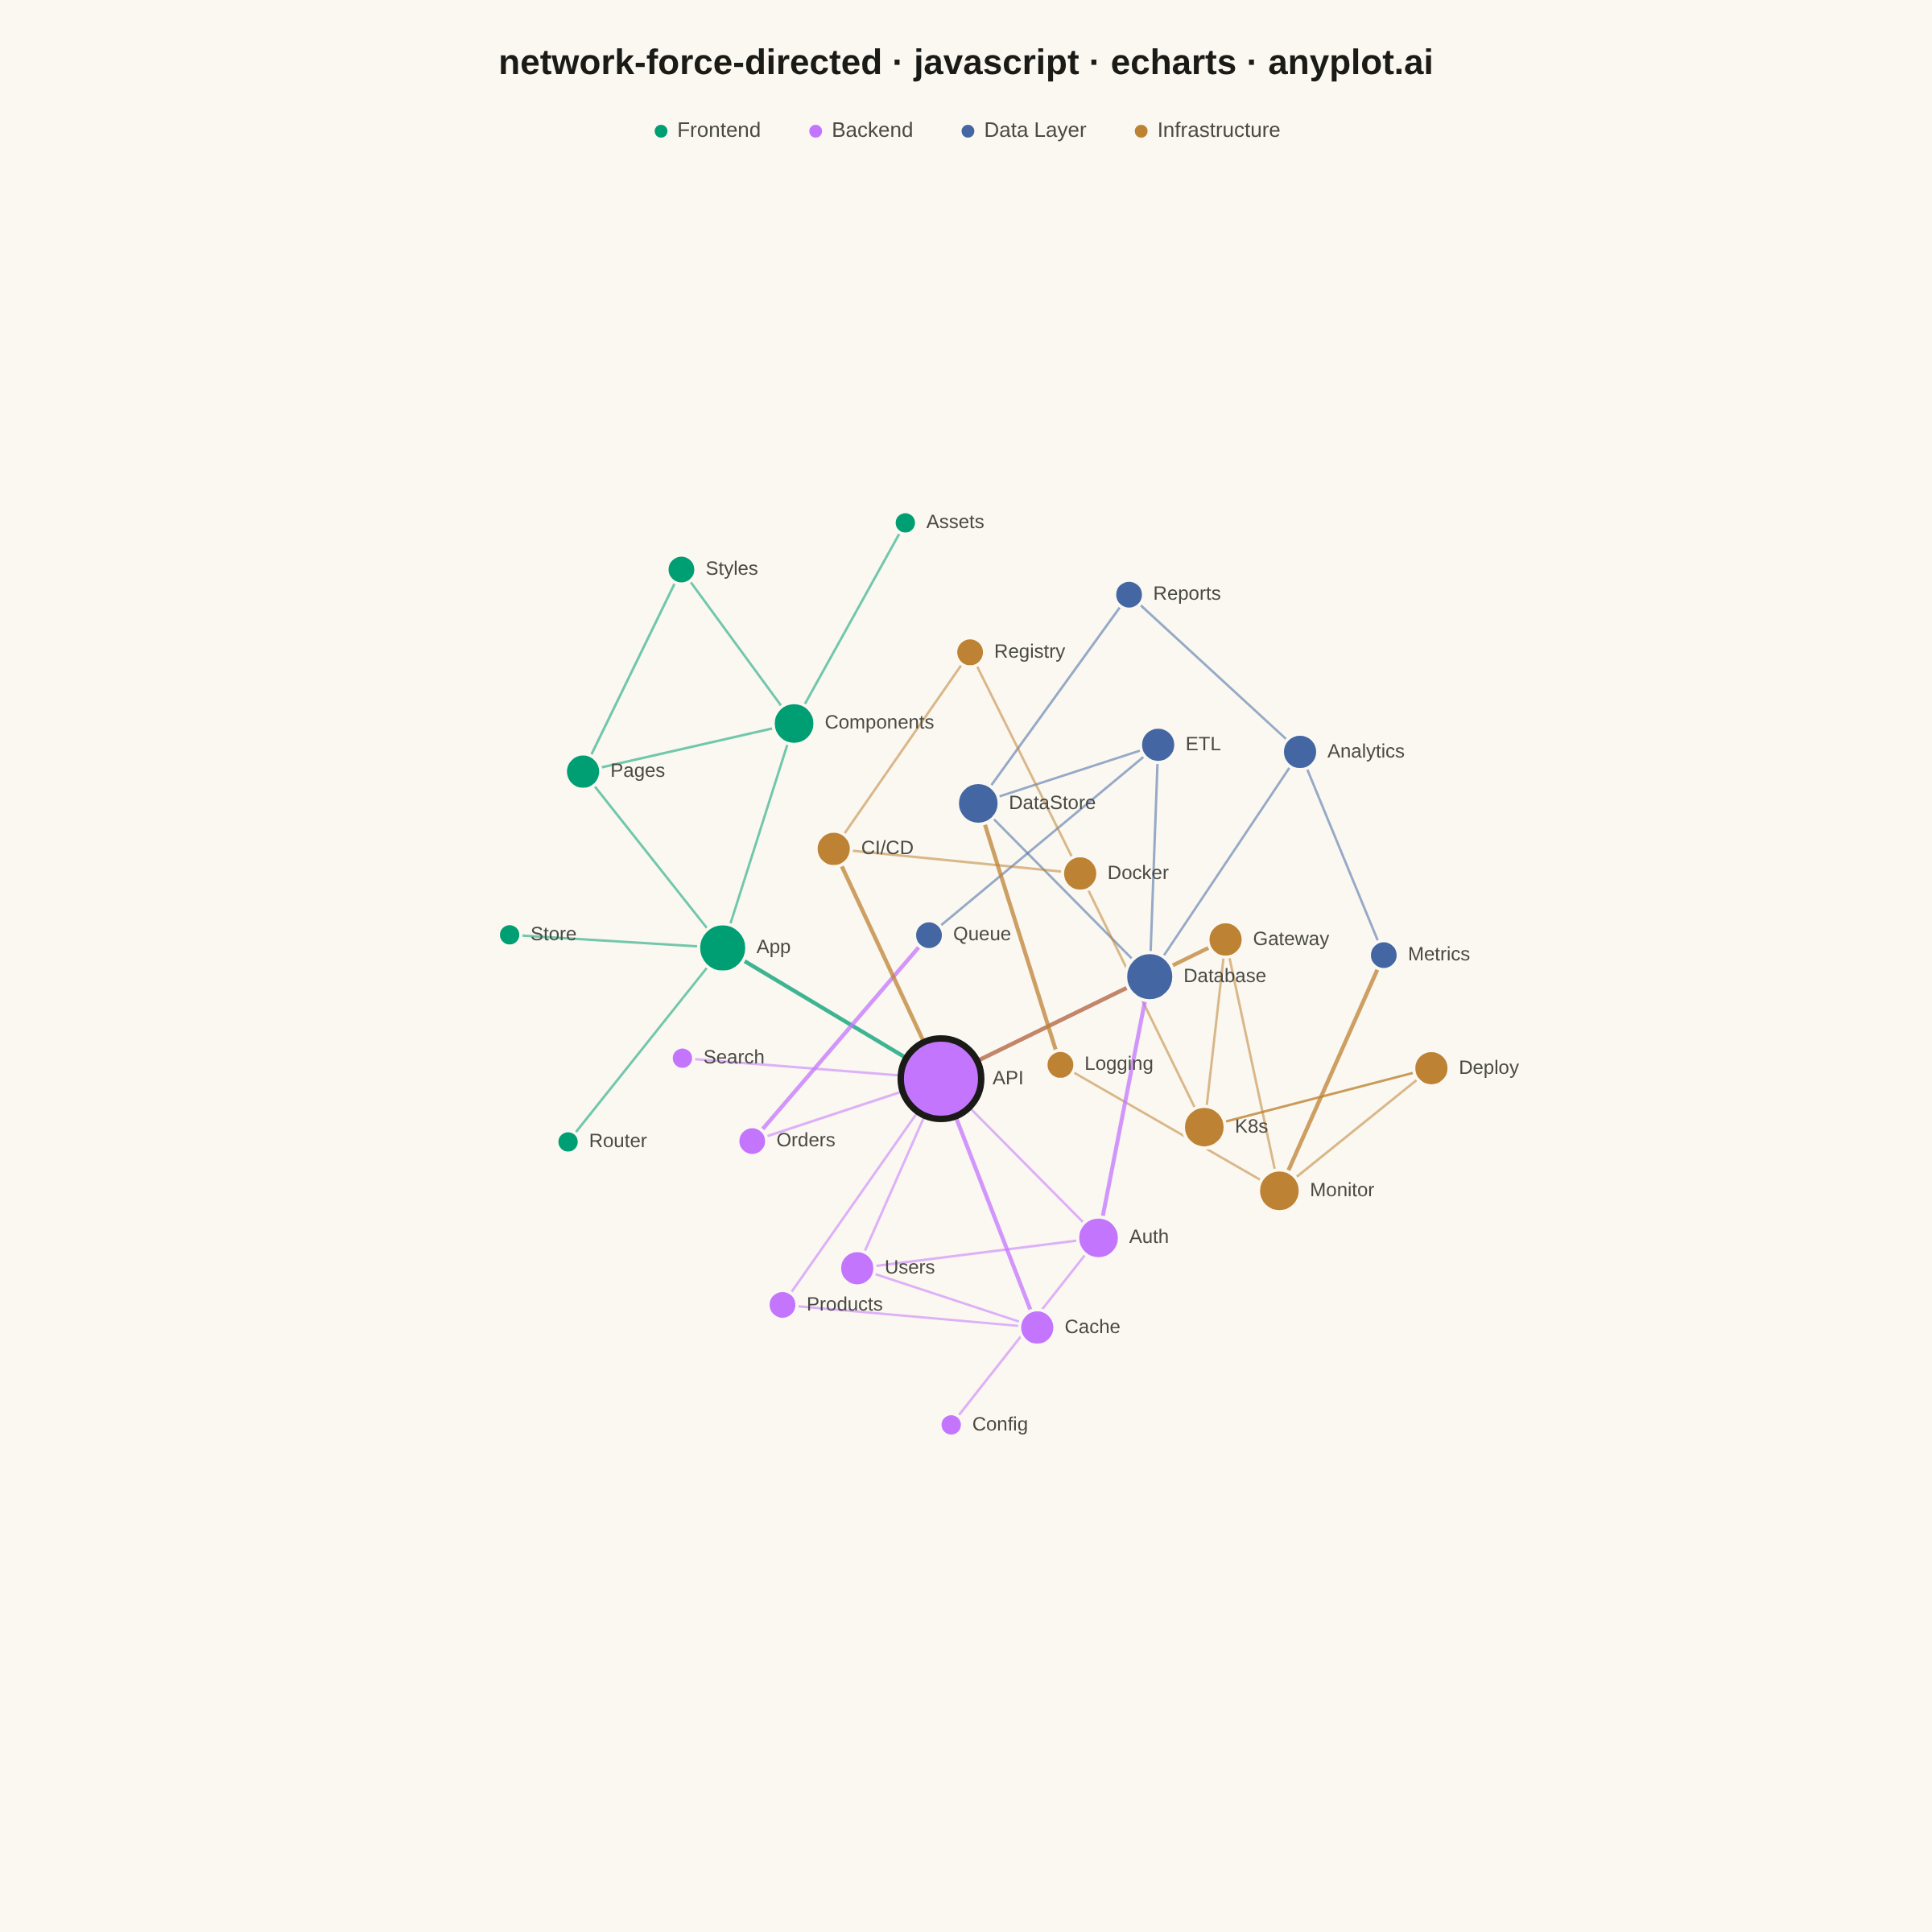
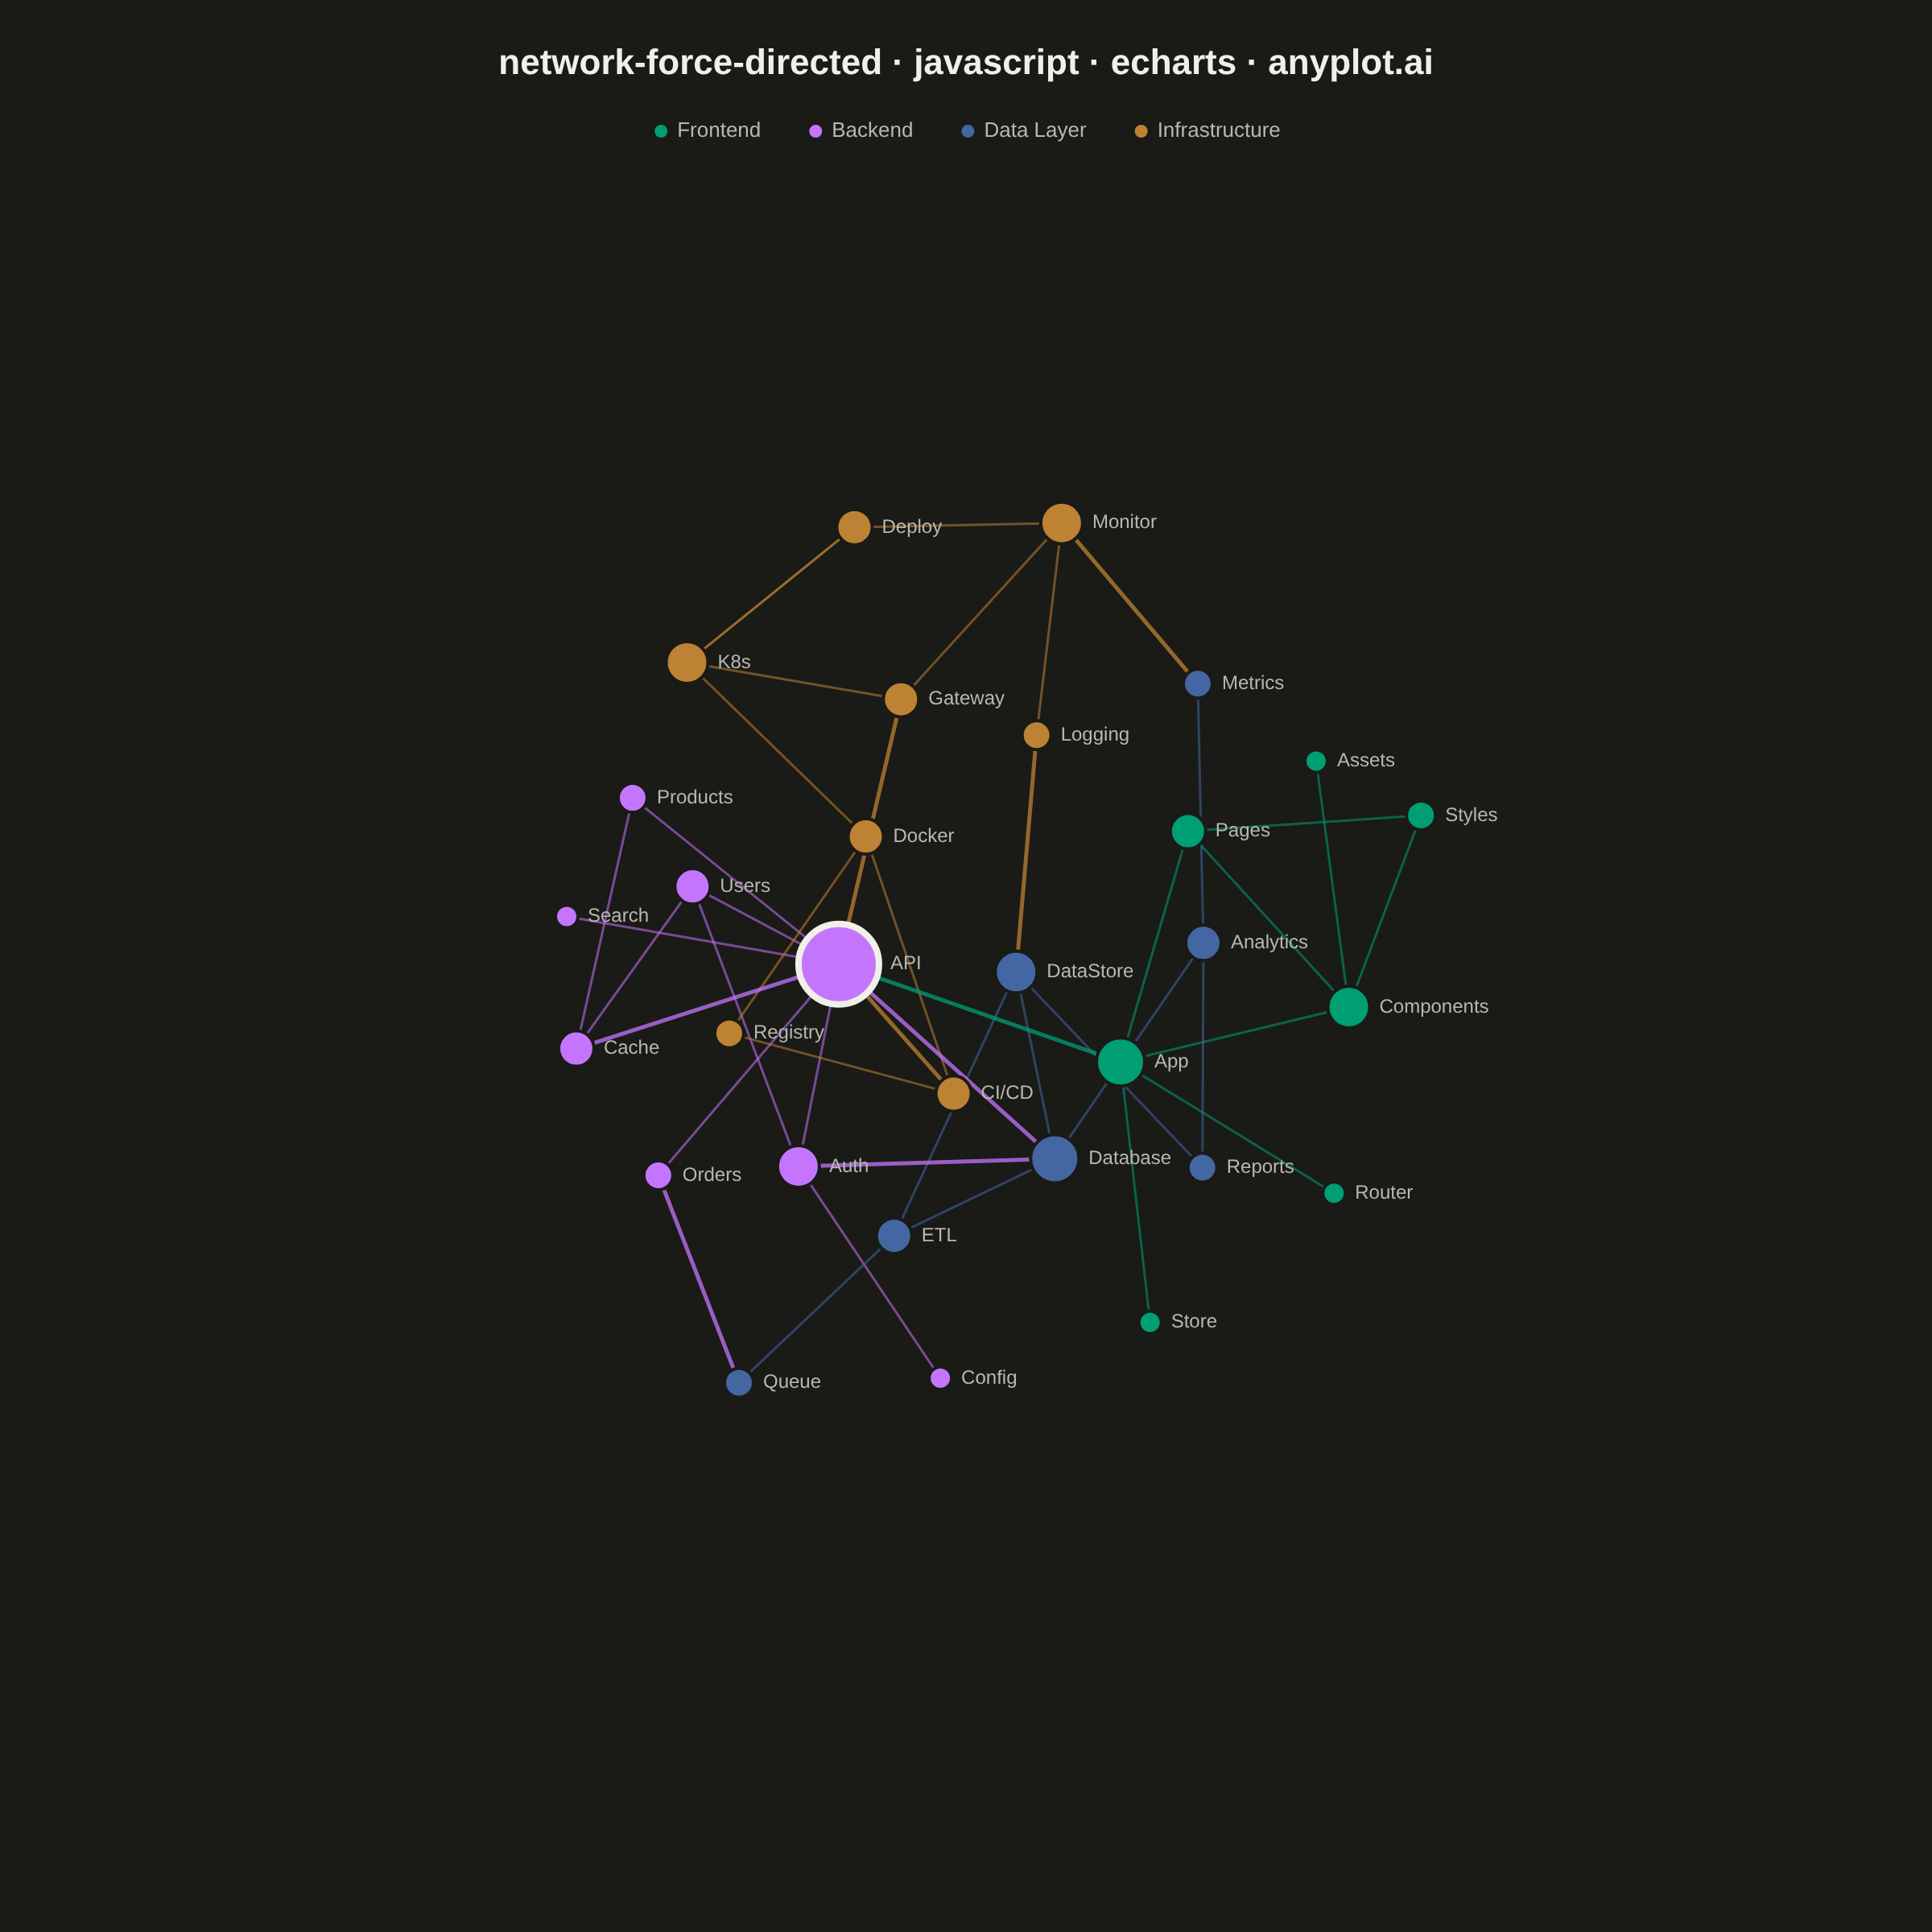
A force-directed graph uses physics simulation to position nodes, where connected nodes attract each other and all nodes repel. This creates organic layouts that naturally reveal community structure, central nodes, and overall network topology without manual positioning. The algorithm balances attractive forces (edges pulling connected nodes together) and repulsive forces (nodes pushing apart) until reaching equilibrium.
// anyplot.ai
// network-force-directed: Force-Directed Graph
// Library: echarts 5.5.1 | JavaScript 22.23.1
// Quality: 83/100 | Created: 2026-07-01
//# anyplot-orientation: square

const t = window.ANYPLOT_TOKENS;

// Software module dependency network — 30 nodes, 4 communities
const categoryDefs = [
  { name: "Frontend" },
  { name: "Backend" },
  { name: "Data Layer" },
  { name: "Infrastructure" },
];

const rawNodes = [
  { id: "App",        label: "App",        cat: 0 },
  { id: "Router",     label: "Router",     cat: 0 },
  { id: "Pages",      label: "Pages",      cat: 0 },
  { id: "Components", label: "Components", cat: 0 },
  { id: "Store",      label: "Store",      cat: 0 },
  { id: "Styles",     label: "Styles",     cat: 0 },
  { id: "Assets",     label: "Assets",     cat: 0 },
  { id: "API",        label: "API",        cat: 1 },
  { id: "Auth",       label: "Auth",       cat: 1 },
  { id: "Users",      label: "Users",      cat: 1 },
  { id: "Products",   label: "Products",   cat: 1 },
  { id: "Orders",     label: "Orders",     cat: 1 },
  { id: "Search",     label: "Search",     cat: 1 },
  { id: "Cache",      label: "Cache",      cat: 1 },
  { id: "Config",     label: "Config",     cat: 1 },
  { id: "Database",   label: "Database",   cat: 2 },
  { id: "Analytics",  label: "Analytics",  cat: 2 },
  { id: "Reports",    label: "Reports",    cat: 2 },
  { id: "ETL",        label: "ETL",        cat: 2 },
  { id: "DataStore",  label: "DataStore",  cat: 2 },
  { id: "Queue",      label: "Queue",      cat: 2 },
  { id: "Metrics",    label: "Metrics",    cat: 2 },
  { id: "CICD",       label: "CI/CD",      cat: 3 },
  { id: "Deploy",     label: "Deploy",     cat: 3 },
  { id: "Monitor",    label: "Monitor",    cat: 3 },
  { id: "Logging",    label: "Logging",    cat: 3 },
  { id: "Docker",     label: "Docker",     cat: 3 },
  { id: "K8s",        label: "K8s",        cat: 3 },
  { id: "Registry",   label: "Registry",   cat: 3 },
  { id: "Gateway",    label: "Gateway",    cat: 3 },
];

const edgePairs = [
  // Frontend internal
  ["App", "Router"], ["App", "Pages"], ["App", "Components"], ["App", "Store"],
  ["Pages", "Components"], ["Pages", "Styles"], ["Components", "Styles"], ["Components", "Assets"],
  // Backend internal
  ["API", "Auth"], ["API", "Users"], ["API", "Products"], ["API", "Orders"],
  ["API", "Search"], ["Auth", "Users"], ["Auth", "Config"],
  ["Users", "Cache"], ["Products", "Cache"],
  // Data Layer internal
  ["Database", "Analytics"], ["Database", "DataStore"], ["Analytics", "Reports"],
  ["ETL", "Database"], ["ETL", "DataStore"], ["Queue", "ETL"],
  ["Metrics", "Analytics"], ["DataStore", "Reports"],
  // Infrastructure internal
  ["K8s", "Docker"], ["K8s", "Deploy"], ["CICD", "Docker"], ["CICD", "Registry"],
  ["Deploy", "Monitor"], ["Deploy", "K8s"], ["Monitor", "Logging"],
  ["Gateway", "Monitor"], ["Gateway", "K8s"], ["Registry", "Docker"],
  // Cross-community
  ["App", "API"],
  ["API", "Database"], ["API", "Cache"], ["Auth", "Database"], ["Orders", "Queue"],
  ["CICD", "API"], ["Gateway", "API"],
  ["Monitor", "Metrics"], ["Logging", "DataStore"],
];

// Compute degree for proportional node sizing
const degree = {};
rawNodes.forEach(function(n) { degree[n.id] = 0; });
edgePairs.forEach(function(pair) {
  degree[pair[0]] = (degree[pair[0]] || 0) + 1;
  degree[pair[1]] = (degree[pair[1]] || 0) + 1;
});

const nodes = rawNodes.map(function(n) {
  const d = degree[n.id];
  const isHub = n.id === "API";
  return {
    name: n.id,
    value: d,
    category: n.cat,
    symbolSize: Math.max(14, 10 + d * 4),
    label: { formatter: n.label },
    itemStyle: isHub ? { borderWidth: 4, borderColor: t.ink } : undefined,
  };
});

// Cross-community edges styled slightly wider/more opaque to guide the eye
const crossEdges = new Set([
  "App->API", "API->Database", "API->Cache", "Auth->Database",
  "Orders->Queue", "CICD->API", "Gateway->API", "Monitor->Metrics", "Logging->DataStore",
]);

const links = edgePairs.map(function(pair) {
  const result = { source: pair[0], target: pair[1] };
  if (crossEdges.has(pair[0] + "->" + pair[1])) {
    result.lineStyle = { width: 2.5, opacity: 0.75 };
  }
  return result;
});

const chart = echarts.init(document.getElementById("container"));

chart.setOption({
  animation: false,
  color: t.palette,
  backgroundColor: "transparent",
  title: {
    text: "network-force-directed · javascript · echarts · anyplot.ai",
    left: "center",
    top: 24,
    textStyle: { color: t.ink, fontSize: 22, fontWeight: "bold" },
  },
  legend: {
    data: categoryDefs.map(function(c) { return c.name; }),
    top: 70,
    left: "center",
    orient: "horizontal",
    textStyle: { color: t.inkSoft, fontSize: 13 },
    icon: "circle",
    itemWidth: 10,
    itemHeight: 10,
    itemGap: 28,
  },
  series: [
    {
      type: "graph",
      layout: "force",
      data: nodes,
      links: links,
      categories: categoryDefs,
      roam: false,
      label: {
        show: true,
        position: "right",
        fontSize: 12,
        color: t.inkSoft,
      },
      labelLayout: { hideOverlap: true },
      lineStyle: {
        width: 1.5,
        opacity: 0.55,
        color: "source",
        curveness: 0,
      },
      itemStyle: {
        borderColor: t.pageBg,
        borderWidth: 2,
      },
      emphasis: { scale: false },
      force: {
        repulsion: 500,
        gravity: 0.3,
        edgeLength: [80, 200],
        layoutAnimation: false,
      },
    },
  ],
});
Runnable source as JSON, for any HTTP client: https://api.anyplot.ai/specs/network-force-directed/echarts/code. Any spec id and library id listed in llms-full.txt fit the same URL shape; every URL below is complete and callable.
{
  "spec_id": "network-force-directed",
  "language": "javascript",
  "library": "echarts",
  "page": "https://anyplot.ai/network-force-directed/javascript/echarts",
  "hub": "https://anyplot.ai/network-force-directed",
  "code_json": "https://api.anyplot.ai/specs/network-force-directed/echarts/code",
  "spec_json": "https://api.anyplot.ai/specs/network-force-directed",
  "render_light_png": "https://storage.googleapis.com/anyplot-images/plots/network-force-directed/javascript/echarts/plot-light.png",
  "render_dark_png": "https://storage.googleapis.com/anyplot-images/plots/network-force-directed/javascript/echarts/plot-dark.png",
  "interactive_light_html": "https://storage.googleapis.com/anyplot-images/plots/network-force-directed/javascript/echarts/plot-light.html",
  "interactive_dark_html": "https://storage.googleapis.com/anyplot-images/plots/network-force-directed/javascript/echarts/plot-dark.html",
  "quality_score": 83.0,
  "license": "MIT",
  "guide": "https://anyplot.ai/llms.txt"
}
Part of Force-Directed Graph on anyplot.ai.