The same plot in 14 other libraries — JavaScript: D3.js, Apache ECharts, Highcharts, MUI X Charts; Python: Altair, Bokeh, lets-plot, Matplotlib, Plotly, plotnine, Pygal, Seaborn; R: ggplot2; Julia: Makie.jl. Compare all 15 side by side: Basic Parallel Categories Plot in Python, R, Julia and JavaScript.
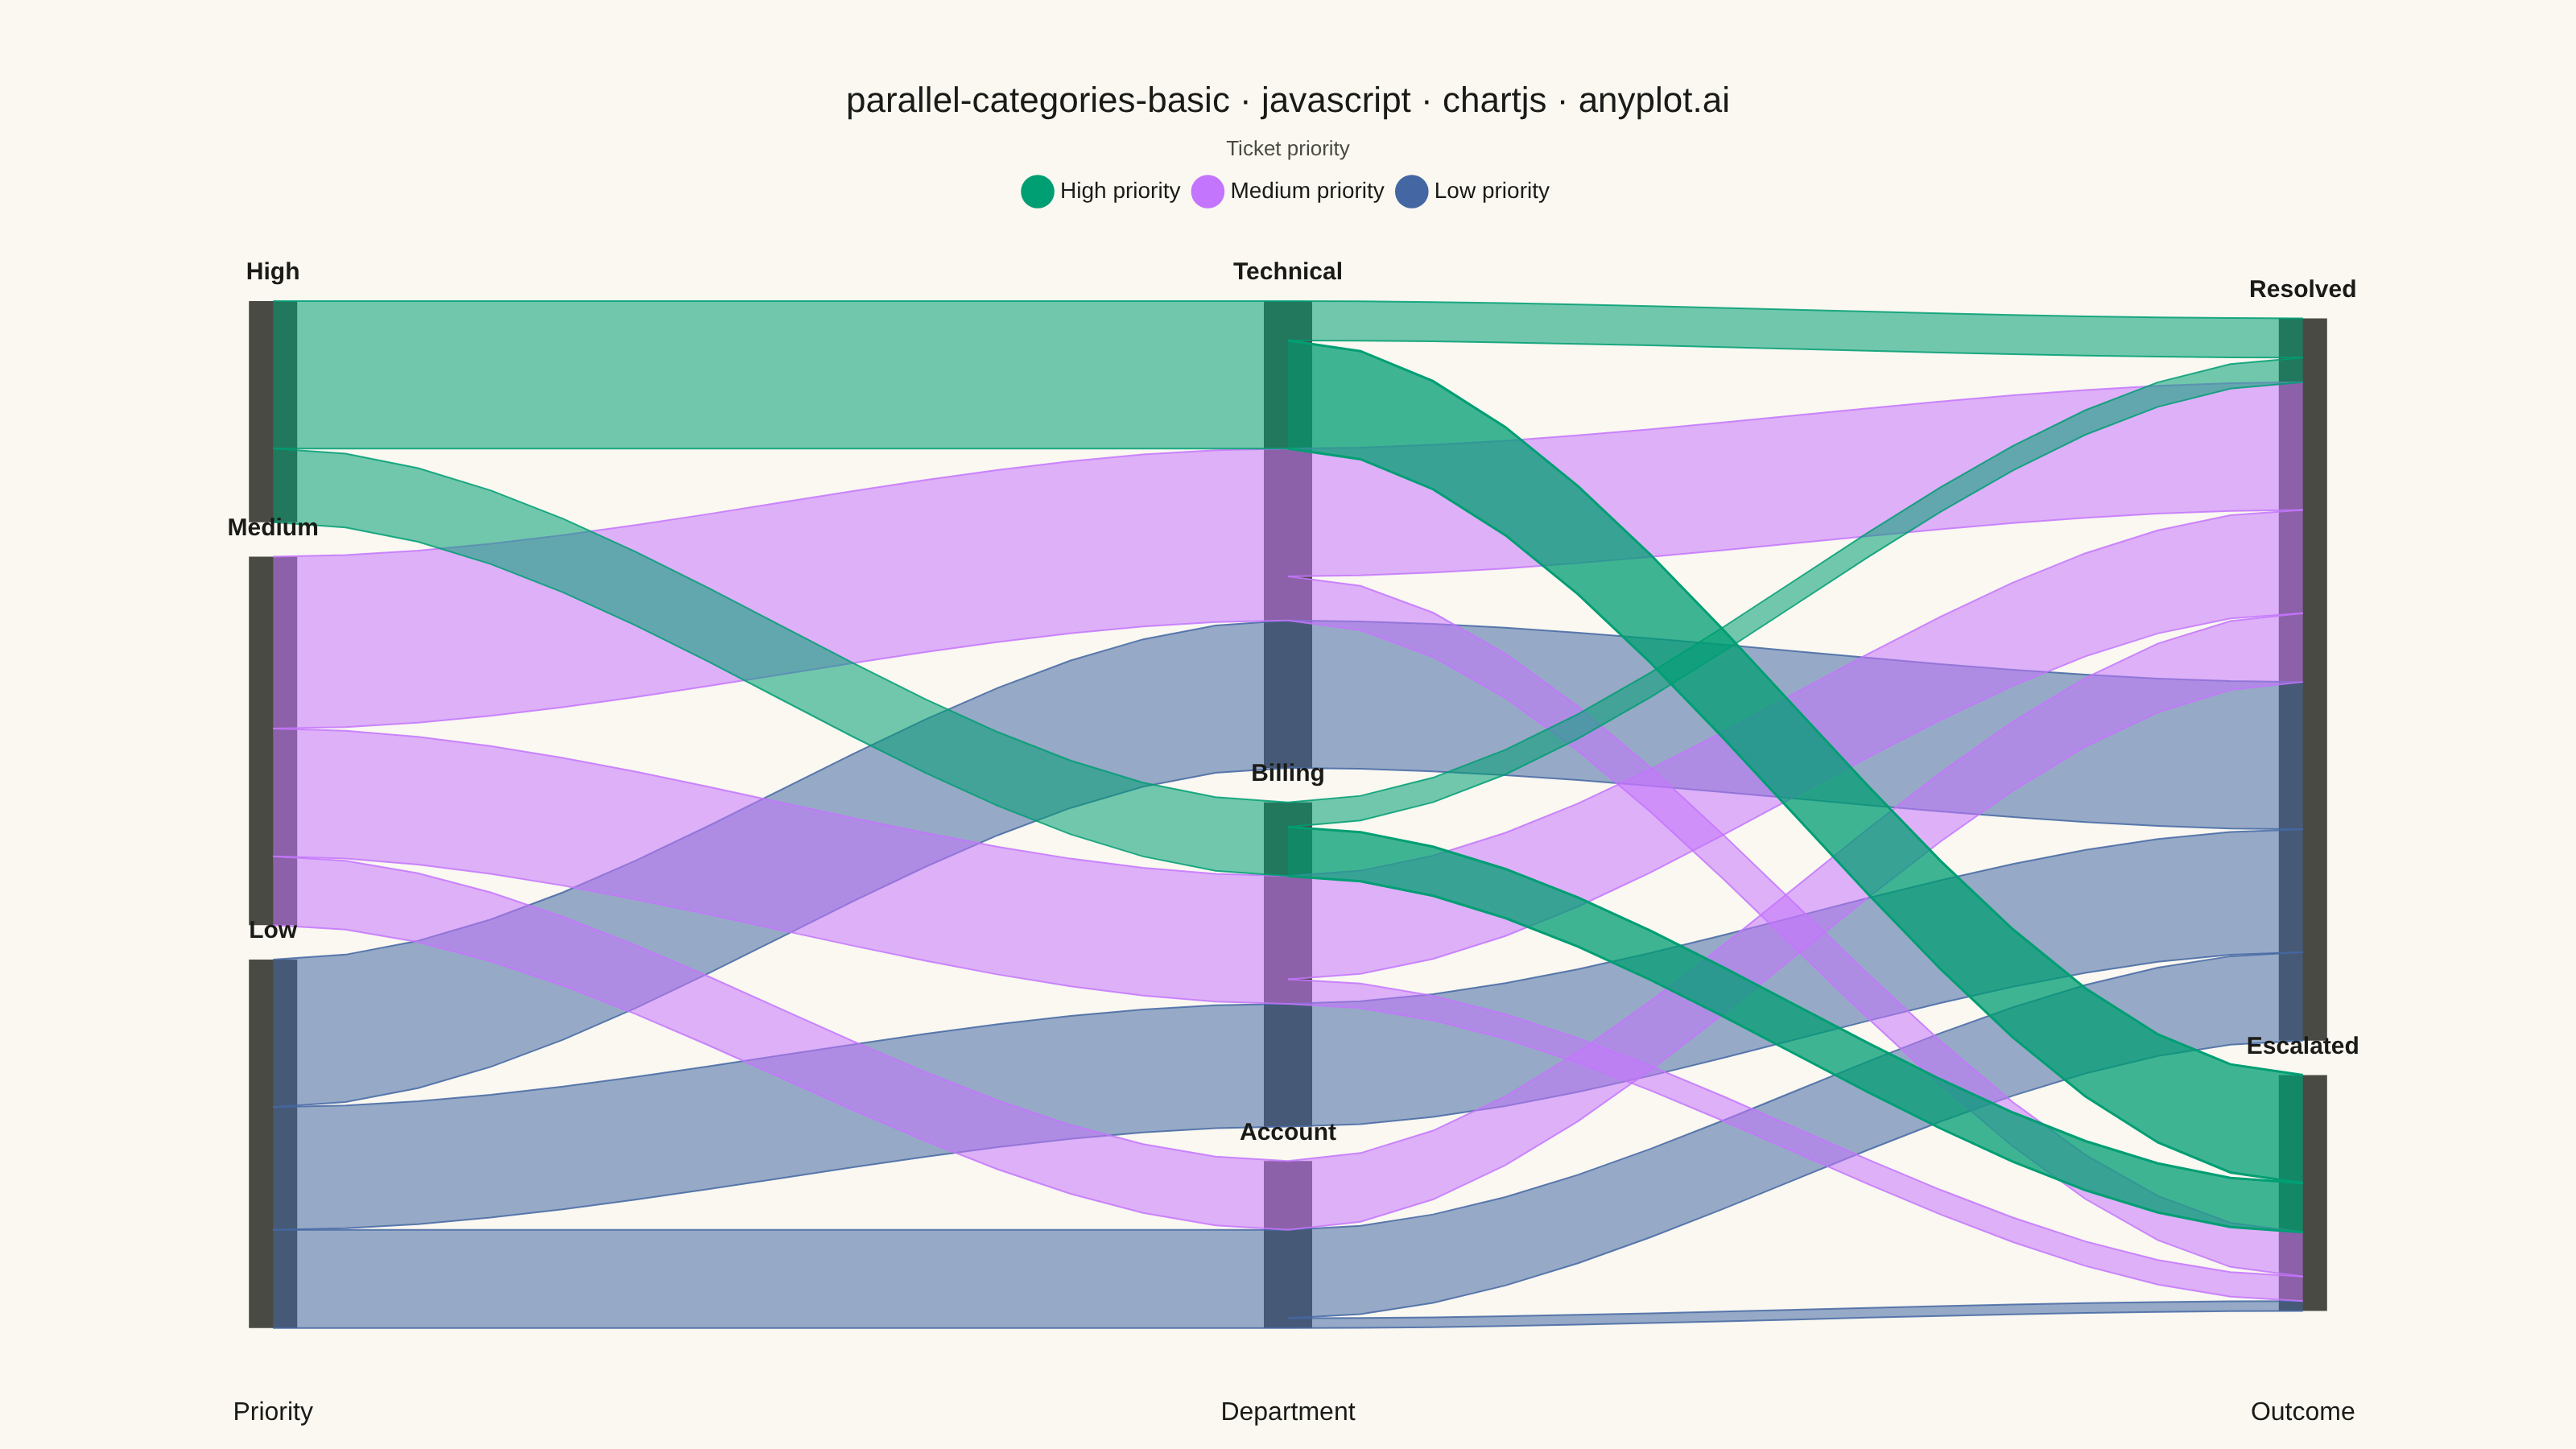
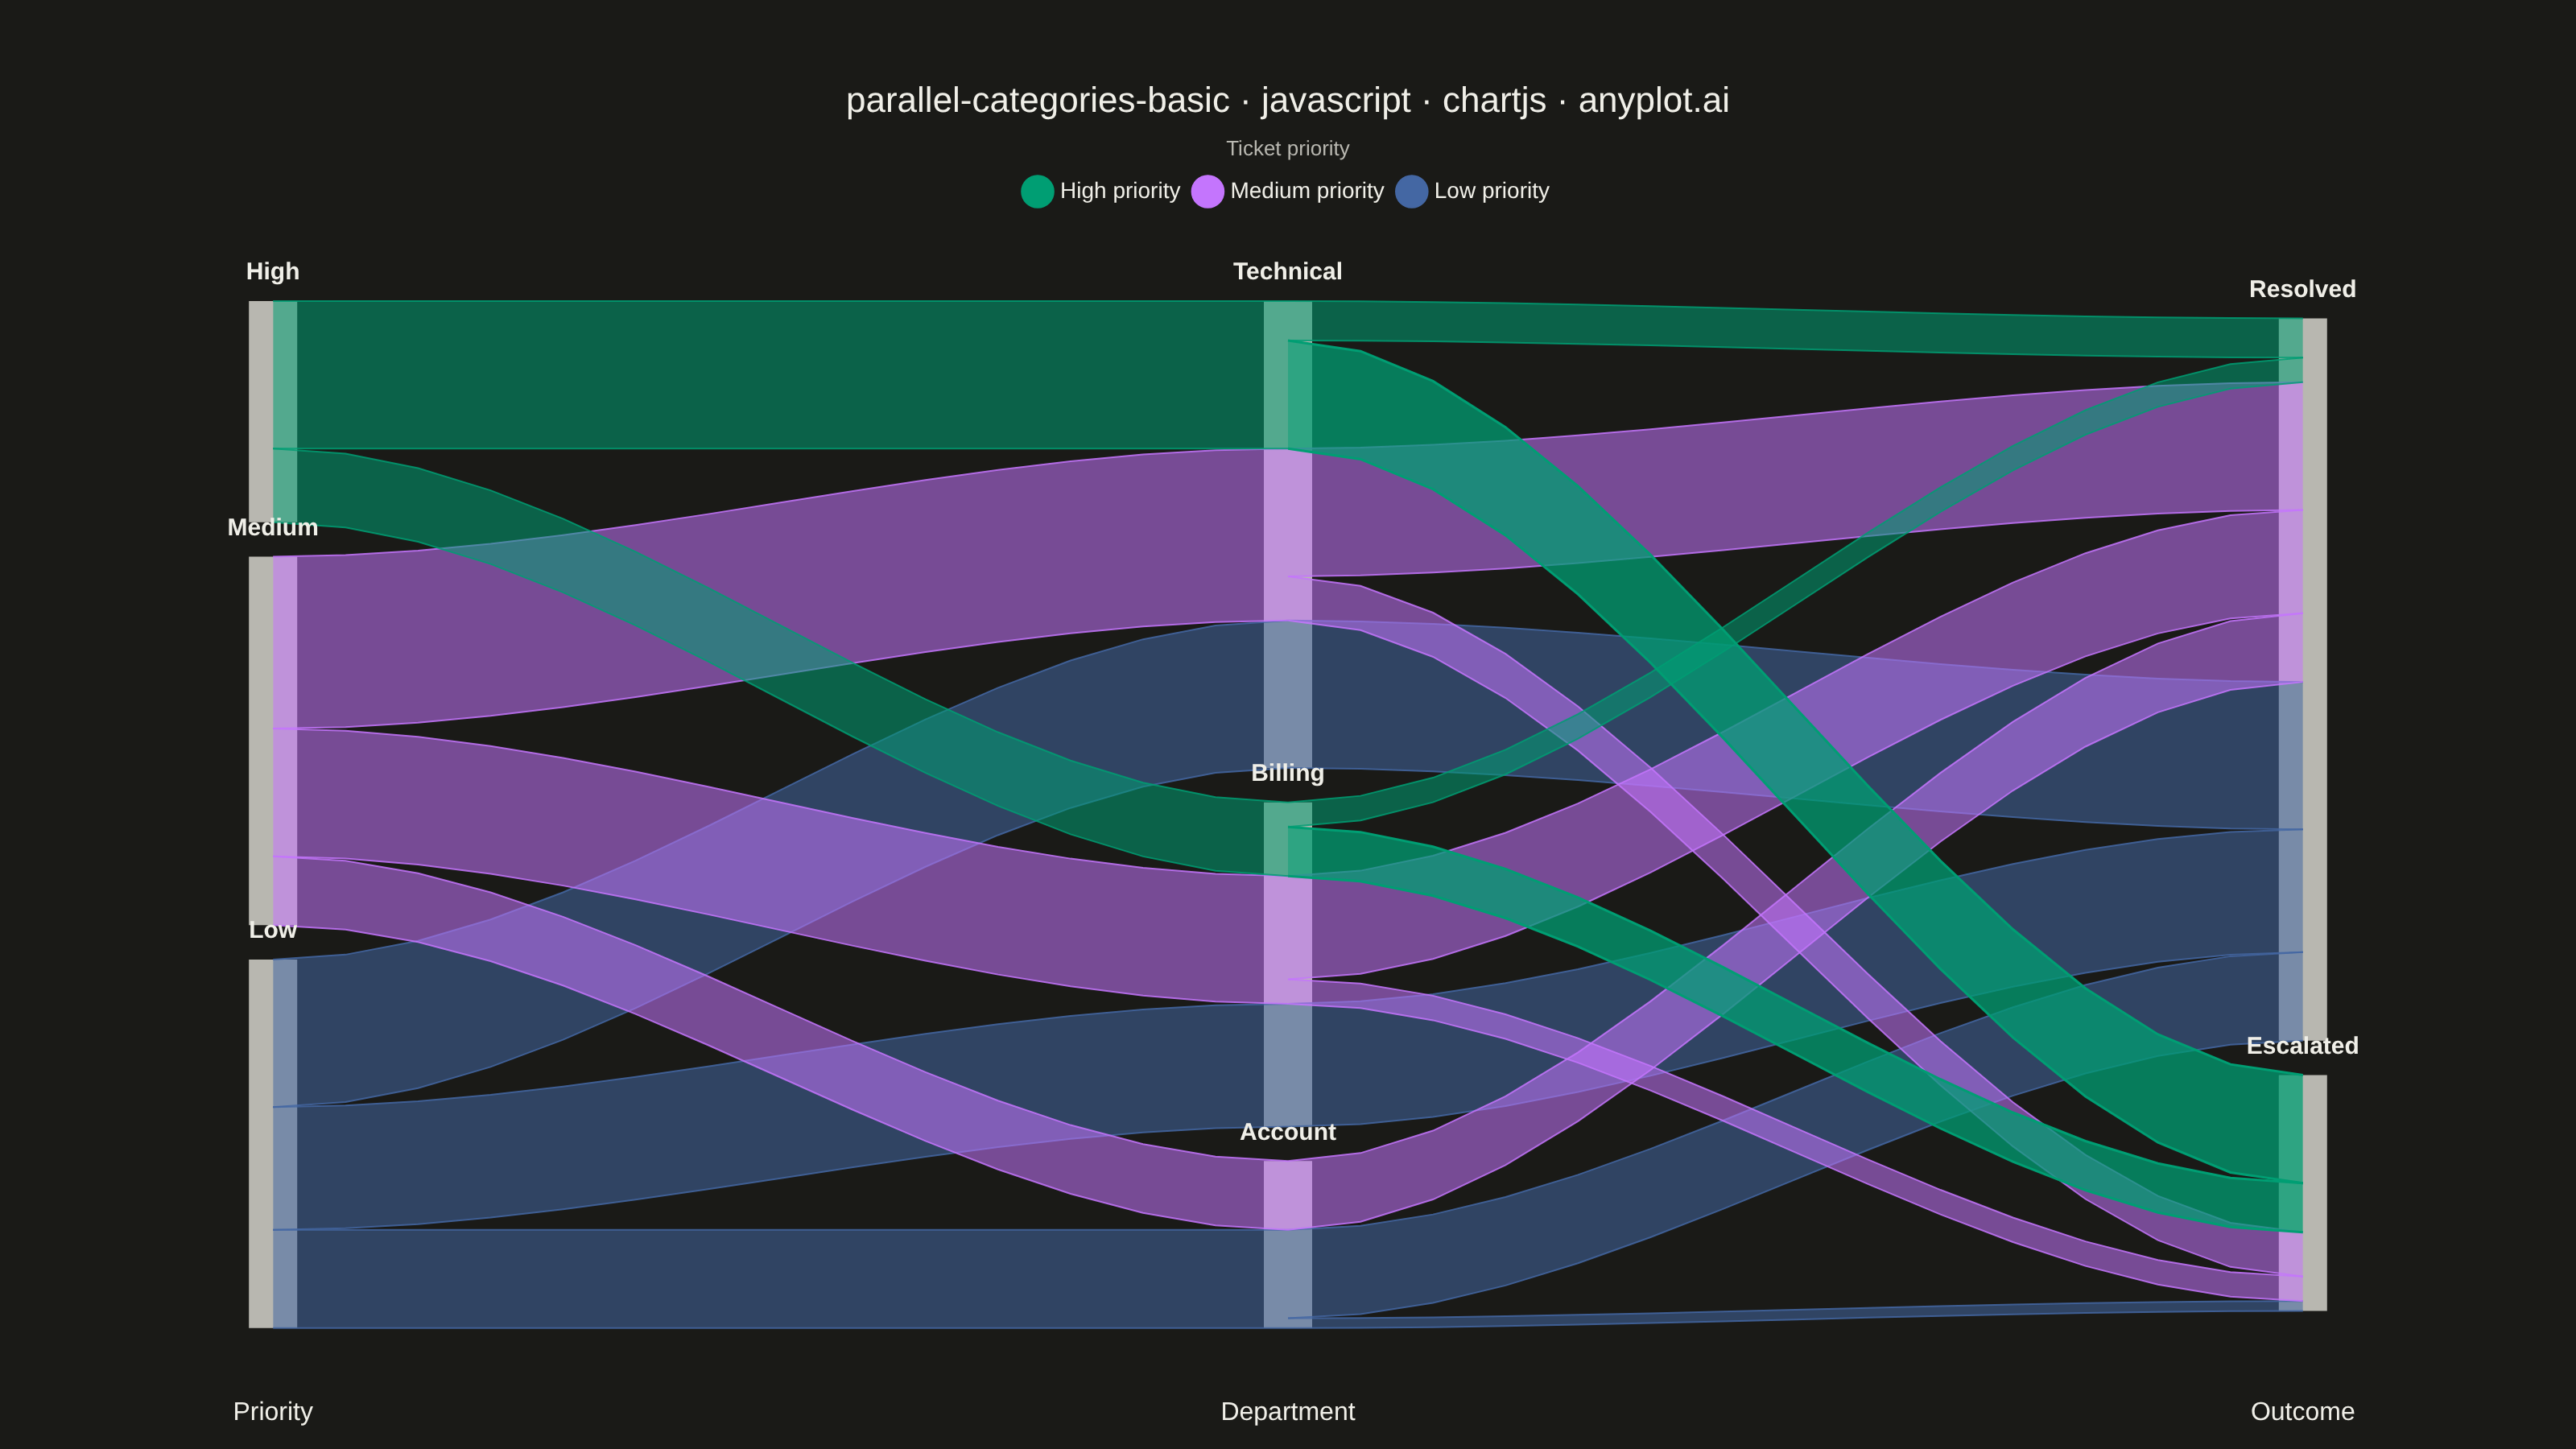
A parallel categories plot visualizes categorical data across multiple dimensions, with vertical axes representing each categorical variable and ribbons connecting categories to show observation flow. Unlike parallel coordinates (which use lines for numeric data), parallel categories use width-proportional ribbons to show counts or frequencies, making it ideal for understanding how categorical values co-occur and flow across multiple classification dimensions.
// anyplot.ai
// parallel-categories-basic: Basic Parallel Categories Plot
// Library: chartjs 4.4.7 | JavaScript 22.23.2
// Quality: 86/100 | Created: 2026-09-05

const t = window.ANYPLOT_TOKENS;

// --- Data (in-memory, deterministic) ----------------------------------------
// Support-ticket routing: priority -> department -> outcome.
const dims = ["Priority", "Department", "Outcome"];
const cats = [
  ["High", "Medium", "Low"],
  ["Technical", "Billing", "Account"],
  ["Resolved", "Escalated"],
];
const paths = [
  { v: ["High", "Technical", "Escalated"], count: 22 },
  { v: ["High", "Technical", "Resolved"], count: 8 },
  { v: ["High", "Billing", "Escalated"], count: 10 },
  { v: ["High", "Billing", "Resolved"], count: 5 },
  { v: ["Medium", "Technical", "Escalated"], count: 9 },
  { v: ["Medium", "Technical", "Resolved"], count: 26 },
  { v: ["Medium", "Billing", "Escalated"], count: 5 },
  { v: ["Medium", "Billing", "Resolved"], count: 21 },
  { v: ["Medium", "Account", "Resolved"], count: 14 },
  { v: ["Low", "Technical", "Resolved"], count: 30 },
  { v: ["Low", "Billing", "Resolved"], count: 25 },
  { v: ["Low", "Account", "Resolved"], count: 18 },
  { v: ["Low", "Account", "Escalated"], count: 2 },
];
const priorityColor = { High: t.palette[0], Medium: t.palette[1], Low: t.palette[2] };

// --- Layout: stack nodes per dimension, then size ribbons between them ------
function hexToRgba(hex, alpha) {
  const n = parseInt(hex.slice(1), 16);
  return `rgba(${(n >> 16) & 255}, ${(n >> 8) & 255}, ${n & 255}, ${alpha})`;
}

function splitSegments(range, ordered) {
  const total = ordered.reduce((s, o) => s + o.value, 0) || 1;
  const height = range[1] - range[0];
  let cursor = range[1];
  const segs = {};
  ordered.forEach(({ key, value }) => {
    const h = (height * value) / total;
    segs[key] = [cursor - h, cursor];
    cursor -= h;
  });
  return segs;
}

const totals = dims.map((_, d) => {
  const byCat = {};
  cats[d].forEach((c) => (byCat[c] = 0));
  paths.forEach((p) => (byCat[p.v[d]] += p.count));
  return byCat;
});

const GAP = 7;
const extents = dims.map(
  (_, d) => cats[d].reduce((s, c) => s + totals[d][c], 0) + GAP * (cats[d].length - 1),
);
const maxExtent = Math.max(...extents);

const nodePos = dims.map((_, d) => {
  const topPad = (maxExtent - extents[d]) / 2;
  let cursor = maxExtent - topPad;
  const pos = {};
  cats[d].forEach((c, i) => {
    const h = totals[d][c];
    pos[c] = [cursor - h, cursor];
    cursor -= h;
    if (i < cats[d].length - 1) cursor -= GAP;
  });
  return pos;
});

// Priority -> Department (transition 0), grouped by priority for contiguous color blocks.
// t0[department][priority] = ticket count flowing along that priority->department edge.
const t0 = {};
cats[1].forEach((dept) => {
  t0[dept] = {};
  cats[0].forEach((pr) => (t0[dept][pr] = 0));
});
paths.forEach((p) => (t0[p.v[1]][p.v[0]] += p.count));

const priorityRightSeg = {};
cats[0].forEach((pr) => {
  const ordered = cats[1].map((dept) => ({ key: dept, value: t0[dept][pr] })).filter((o) => o.value > 0);
  priorityRightSeg[pr] = splitSegments(nodePos[0][pr], ordered);
});
const deptLeftSeg = {};
cats[1].forEach((dept) => {
  const ordered = cats[0].map((pr) => ({ key: pr, value: t0[dept][pr] })).filter((o) => o.value > 0);
  deptLeftSeg[dept] = splitSegments(nodePos[1][dept], ordered);
});

// Department -> Outcome (transition 1), still split by priority first so a
// priority's color stays a contiguous block all the way through.
// t1[department][priority][outcome] = ticket count for that full 3-hop path.
const t1 = {};
cats[1].forEach((dept) => {
  t1[dept] = {};
  cats[0].forEach((pr) => {
    t1[dept][pr] = {};
    cats[2].forEach((o) => (t1[dept][pr][o] = 0));
  });
});
paths.forEach((p) => (t1[p.v[1]][p.v[0]][p.v[2]] += p.count));

const deptRightSeg = {};
cats[1].forEach((dept) => {
  deptRightSeg[dept] = {};
  cats[0].forEach((pr) => {
    const range = deptLeftSeg[dept][pr];
    if (!range) return;
    const ordered = cats[2].map((o) => ({ key: o, value: t1[dept][pr][o] })).filter((x) => x.value > 0);
    deptRightSeg[dept][pr] = splitSegments(range, ordered);
  });
});
const outcomeLeftSeg = {};
cats[2].forEach((o) => {
  const ordered = [];
  cats[0].forEach((pr) => {
    cats[1].forEach((dept) => {
      const v = t1[dept][pr][o];
      if (v > 0) ordered.push({ key: `${pr}|${dept}`, value: v });
    });
  });
  outcomeLeftSeg[o] = splitSegments(nodePos[2][o], ordered);
});

// --- Ribbons: smoothstep-eased bands filled between a top and bottom curve --
const STEPS = 14;
function curvePoints(x0, y0, x1, y1) {
  const pts = [];
  for (let i = 0; i <= STEPS; i++) {
    const tt = i / STEPS;
    const s = tt * tt * (3 - 2 * tt);
    pts.push({ x: x0 + (x1 - x0) * tt, y: y0 + (y1 - y0) * s });
  }
  return pts;
}

// Each ribbon is two line datasets (top edge, bottom edge) with the bottom one
// filled up to the top ("fill: -1"). Giving both edges a thin matching-color
// stroke keeps adjacent/overlapping ribbons visually separated instead of
// blurring into one blob, and `highlight` bumps a path's opacity + stroke
// weight to call out the diagram's key pattern (see the transition-1 loop).
const datasets = [];
function addRibbon(x0, x1, startRange, endRange, color, flowLabel, highlight = false) {
  const fillAlpha = highlight ? 0.75 : 0.55;
  const strokeAlpha = highlight ? 1 : 0.85;
  const strokeWidth = highlight ? 1.5 : 1;
  datasets.push({
    data: curvePoints(x0, startRange[1], x1, endRange[1]),
    borderWidth: strokeWidth,
    borderColor: hexToRgba(color, strokeAlpha),
    pointRadius: 0,
    fill: false,
    tension: 0,
  });
  datasets.push({
    data: curvePoints(x0, startRange[0], x1, endRange[0]),
    borderWidth: strokeWidth,
    borderColor: hexToRgba(color, strokeAlpha),
    pointRadius: 0,
    pointHitRadius: 10,
    fill: "-1",
    backgroundColor: hexToRgba(color, fillAlpha),
    tension: 0,
    flowLabel,
  });
}

cats[0].forEach((pr) => {
  cats[1].forEach((dept) => {
    const start = priorityRightSeg[pr][dept];
    const end = deptLeftSeg[dept][pr];
    if (start && end) addRibbon(0, 1, start, end, priorityColor[pr], `${pr} → ${dept}: ${t0[dept][pr]} tickets`);
  });
});
// High-priority tickets that end up Escalated are the standout pattern in this
// data (71% of High tickets escalate, vs. 19% Medium and 3% Low) - highlight
// those two paths so the diagram surfaces that insight instead of treating
// every flow equally.
cats[0].forEach((pr) => {
  cats[1].forEach((dept) => {
    cats[2].forEach((o) => {
      const start = deptRightSeg[dept]?.[pr]?.[o];
      const end = outcomeLeftSeg[o]?.[`${pr}|${dept}`];
      const count = t1[dept][pr][o];
      if (start && end) {
        const highlight = pr === "High" && o === "Escalated";
        addRibbon(1, 2, start, end, priorityColor[pr], `${pr} → ${dept} → ${o}: ${count} tickets`, highlight);
      }
    });
  });
});

// --- Nodes: thick vertical strokes act as the category "blocks" ------------
const NODE_WIDTH = 30;
dims.forEach((_, d) => {
  cats[d].forEach((c) => {
    const [y0, y1] = nodePos[d][c];
    datasets.push({
      data: [
        { x: d, y: y0 },
        { x: d, y: y1 },
      ],
      borderColor: t.inkSoft,
      borderWidth: NODE_WIDTH,
      borderCapStyle: "butt",
      pointRadius: 0,
      pointHitRadius: Math.max(15, (y1 - y0) / 2),
      fill: false,
      tension: 0,
      nodeLabel: `${c}: ${totals[d][c]} tickets`,
    });
  });
});

// --- Legend proxies: one swatch per priority, ribbons/nodes stay hidden ----
cats[0].forEach((pr) => {
  datasets.push({
    label: `${pr} priority`,
    data: [],
    backgroundColor: priorityColor[pr],
    borderColor: priorityColor[pr],
    isLegend: true,
  });
});

// --- Category labels above each node ----------------------------------------
const nodeLabelPlugin = {
  id: "nodeLabels",
  afterDatasetsDraw(chart) {
    const { ctx, scales } = chart;
    ctx.save();
    ctx.fillStyle = t.ink;
    ctx.font = "600 15px sans-serif";
    ctx.textAlign = "center";
    ctx.textBaseline = "bottom";
    dims.forEach((_, d) => {
      cats[d].forEach((c) => {
        const [, y1] = nodePos[d][c];
        const px = scales.x.getPixelForValue(d);
        const py = scales.y.getPixelForValue(y1);
        ctx.fillText(c, px, py - 10);
      });
    });
    ctx.restore();
  },
};

// --- Mount -------------------------------------------------------------------
const canvas = document.createElement("canvas");
document.getElementById("container").appendChild(canvas);

// --- Chart ---------------------------------------------------------------
new Chart(canvas, {
  type: "line",
  data: { datasets },
  plugins: [nodeLabelPlugin],
  options: {
    responsive: true,
    maintainAspectRatio: false,
    animation: false,
    layout: { padding: { top: 40, bottom: 10, left: 12, right: 12 } },
    plugins: {
      title: {
        display: true,
        text: "parallel-categories-basic · javascript · chartjs · anyplot.ai",
        color: t.ink,
        font: { size: 22, weight: "500" },
      },
      legend: {
        position: "top",
        title: { display: true, text: "Ticket priority", color: t.inkSoft, font: { size: 13 } },
        labels: {
          color: t.ink,
          font: { size: 14 },
          usePointStyle: true,
          filter: (item, data) => data.datasets[item.datasetIndex].isLegend === true,
        },
      },
      tooltip: {
        backgroundColor: t.elevatedBg,
        titleColor: t.ink,
        bodyColor: t.ink,
        borderColor: t.grid,
        borderWidth: 1,
        displayColors: false,
        filter: (item) => Boolean(item.dataset.flowLabel || item.dataset.nodeLabel),
        callbacks: {
          title: () => "",
          label: (item) => item.dataset.flowLabel || item.dataset.nodeLabel,
        },
      },
    },
    interaction: { mode: "nearest", intersect: true },
    scales: {
      x: {
        type: "linear",
        min: -0.25,
        max: 2.25,
        grid: { display: false },
        border: { display: false },
        afterBuildTicks: (axis) => {
          axis.ticks = [0, 1, 2].map((v) => ({ value: v }));
        },
        ticks: {
          color: t.ink,
          font: { size: 16, weight: "500" },
          callback: (v) => dims[v] ?? "",
        },
      },
      y: {
        display: false,
        min: -maxExtent * 0.05,
        max: maxExtent * 1.08,
      },
    },
  },
});
Runnable source as JSON, for any HTTP client: https://api.anyplot.ai/specs/parallel-categories-basic/chartjs/code. Any spec id and library id listed in llms-full.txt fit the same URL shape; every URL below is complete and callable.
{
  "spec_id": "parallel-categories-basic",
  "language": "javascript",
  "library": "chartjs",
  "page": "https://anyplot.ai/parallel-categories-basic/javascript/chartjs",
  "hub": "https://anyplot.ai/parallel-categories-basic",
  "code_json": "https://api.anyplot.ai/specs/parallel-categories-basic/chartjs/code",
  "spec_json": "https://api.anyplot.ai/specs/parallel-categories-basic",
  "render_light_png": "https://storage.googleapis.com/anyplot-images/plots/parallel-categories-basic/javascript/chartjs/plot-light.png",
  "render_dark_png": "https://storage.googleapis.com/anyplot-images/plots/parallel-categories-basic/javascript/chartjs/plot-dark.png",
  "interactive_light_html": "https://storage.googleapis.com/anyplot-images/plots/parallel-categories-basic/javascript/chartjs/plot-light.html",
  "interactive_dark_html": "https://storage.googleapis.com/anyplot-images/plots/parallel-categories-basic/javascript/chartjs/plot-dark.html",
  "quality_score": 86.0,
  "license": "MIT",
  "guide": "https://anyplot.ai/llms.txt"
}
Part of Basic Parallel Categories Plot on anyplot.ai.