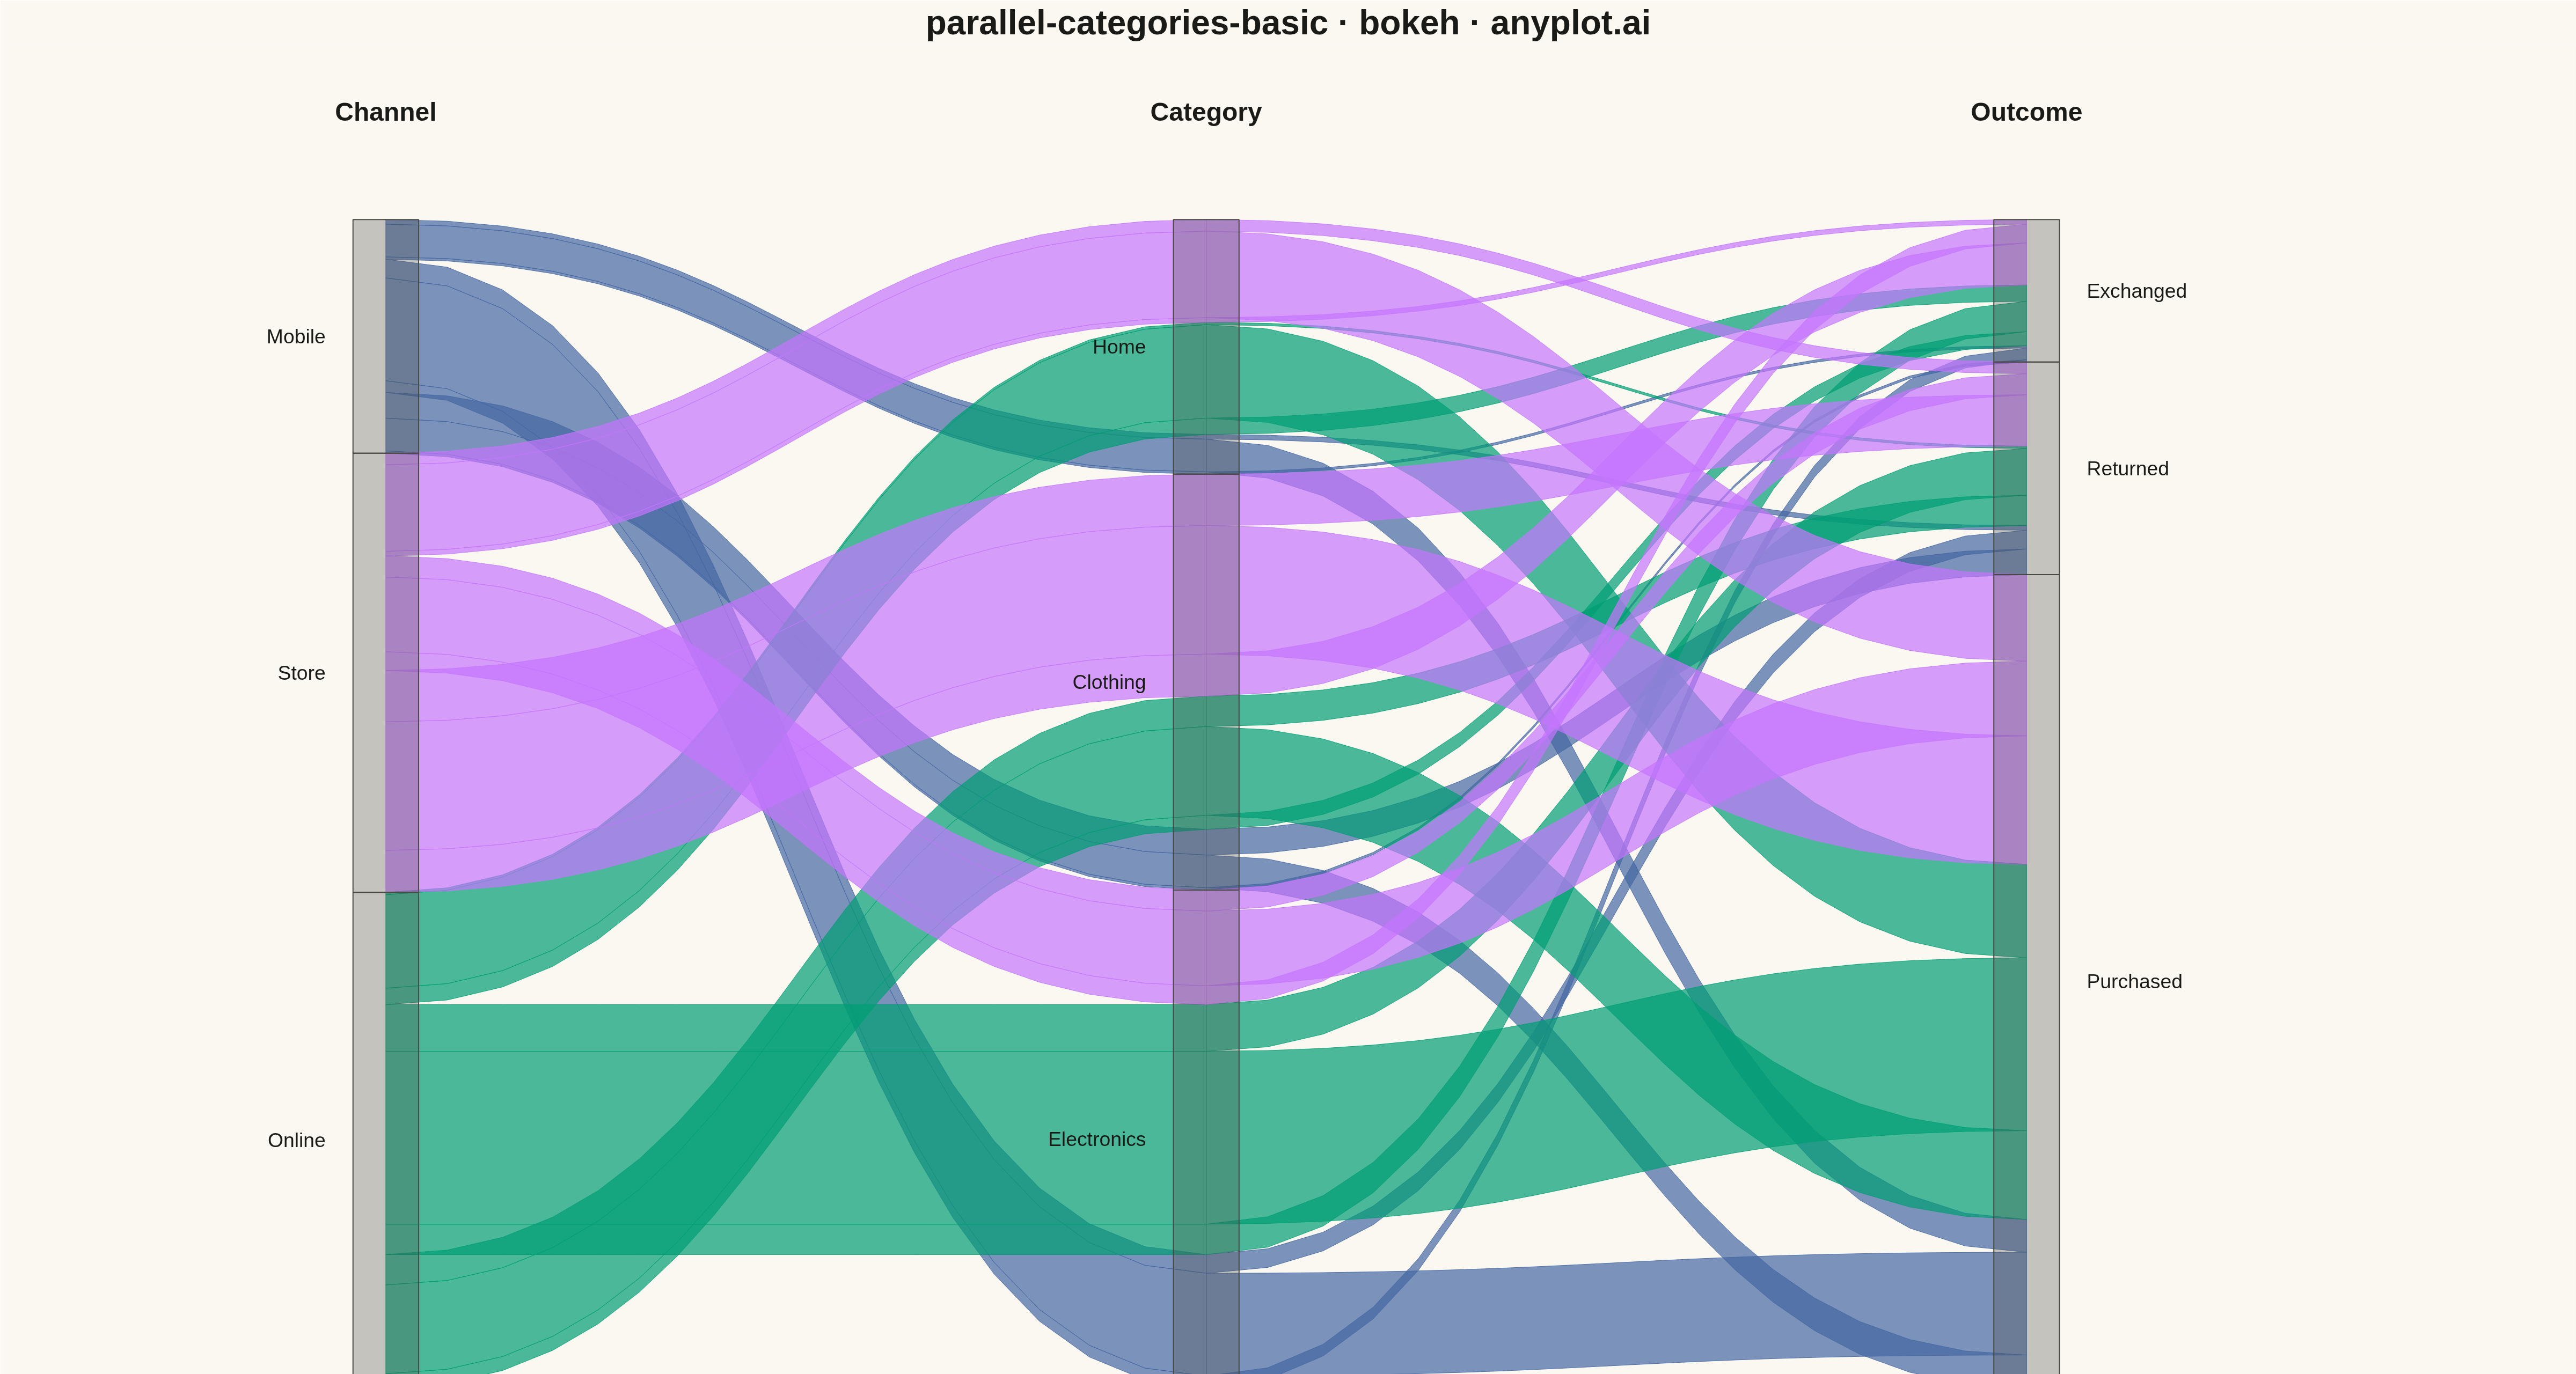
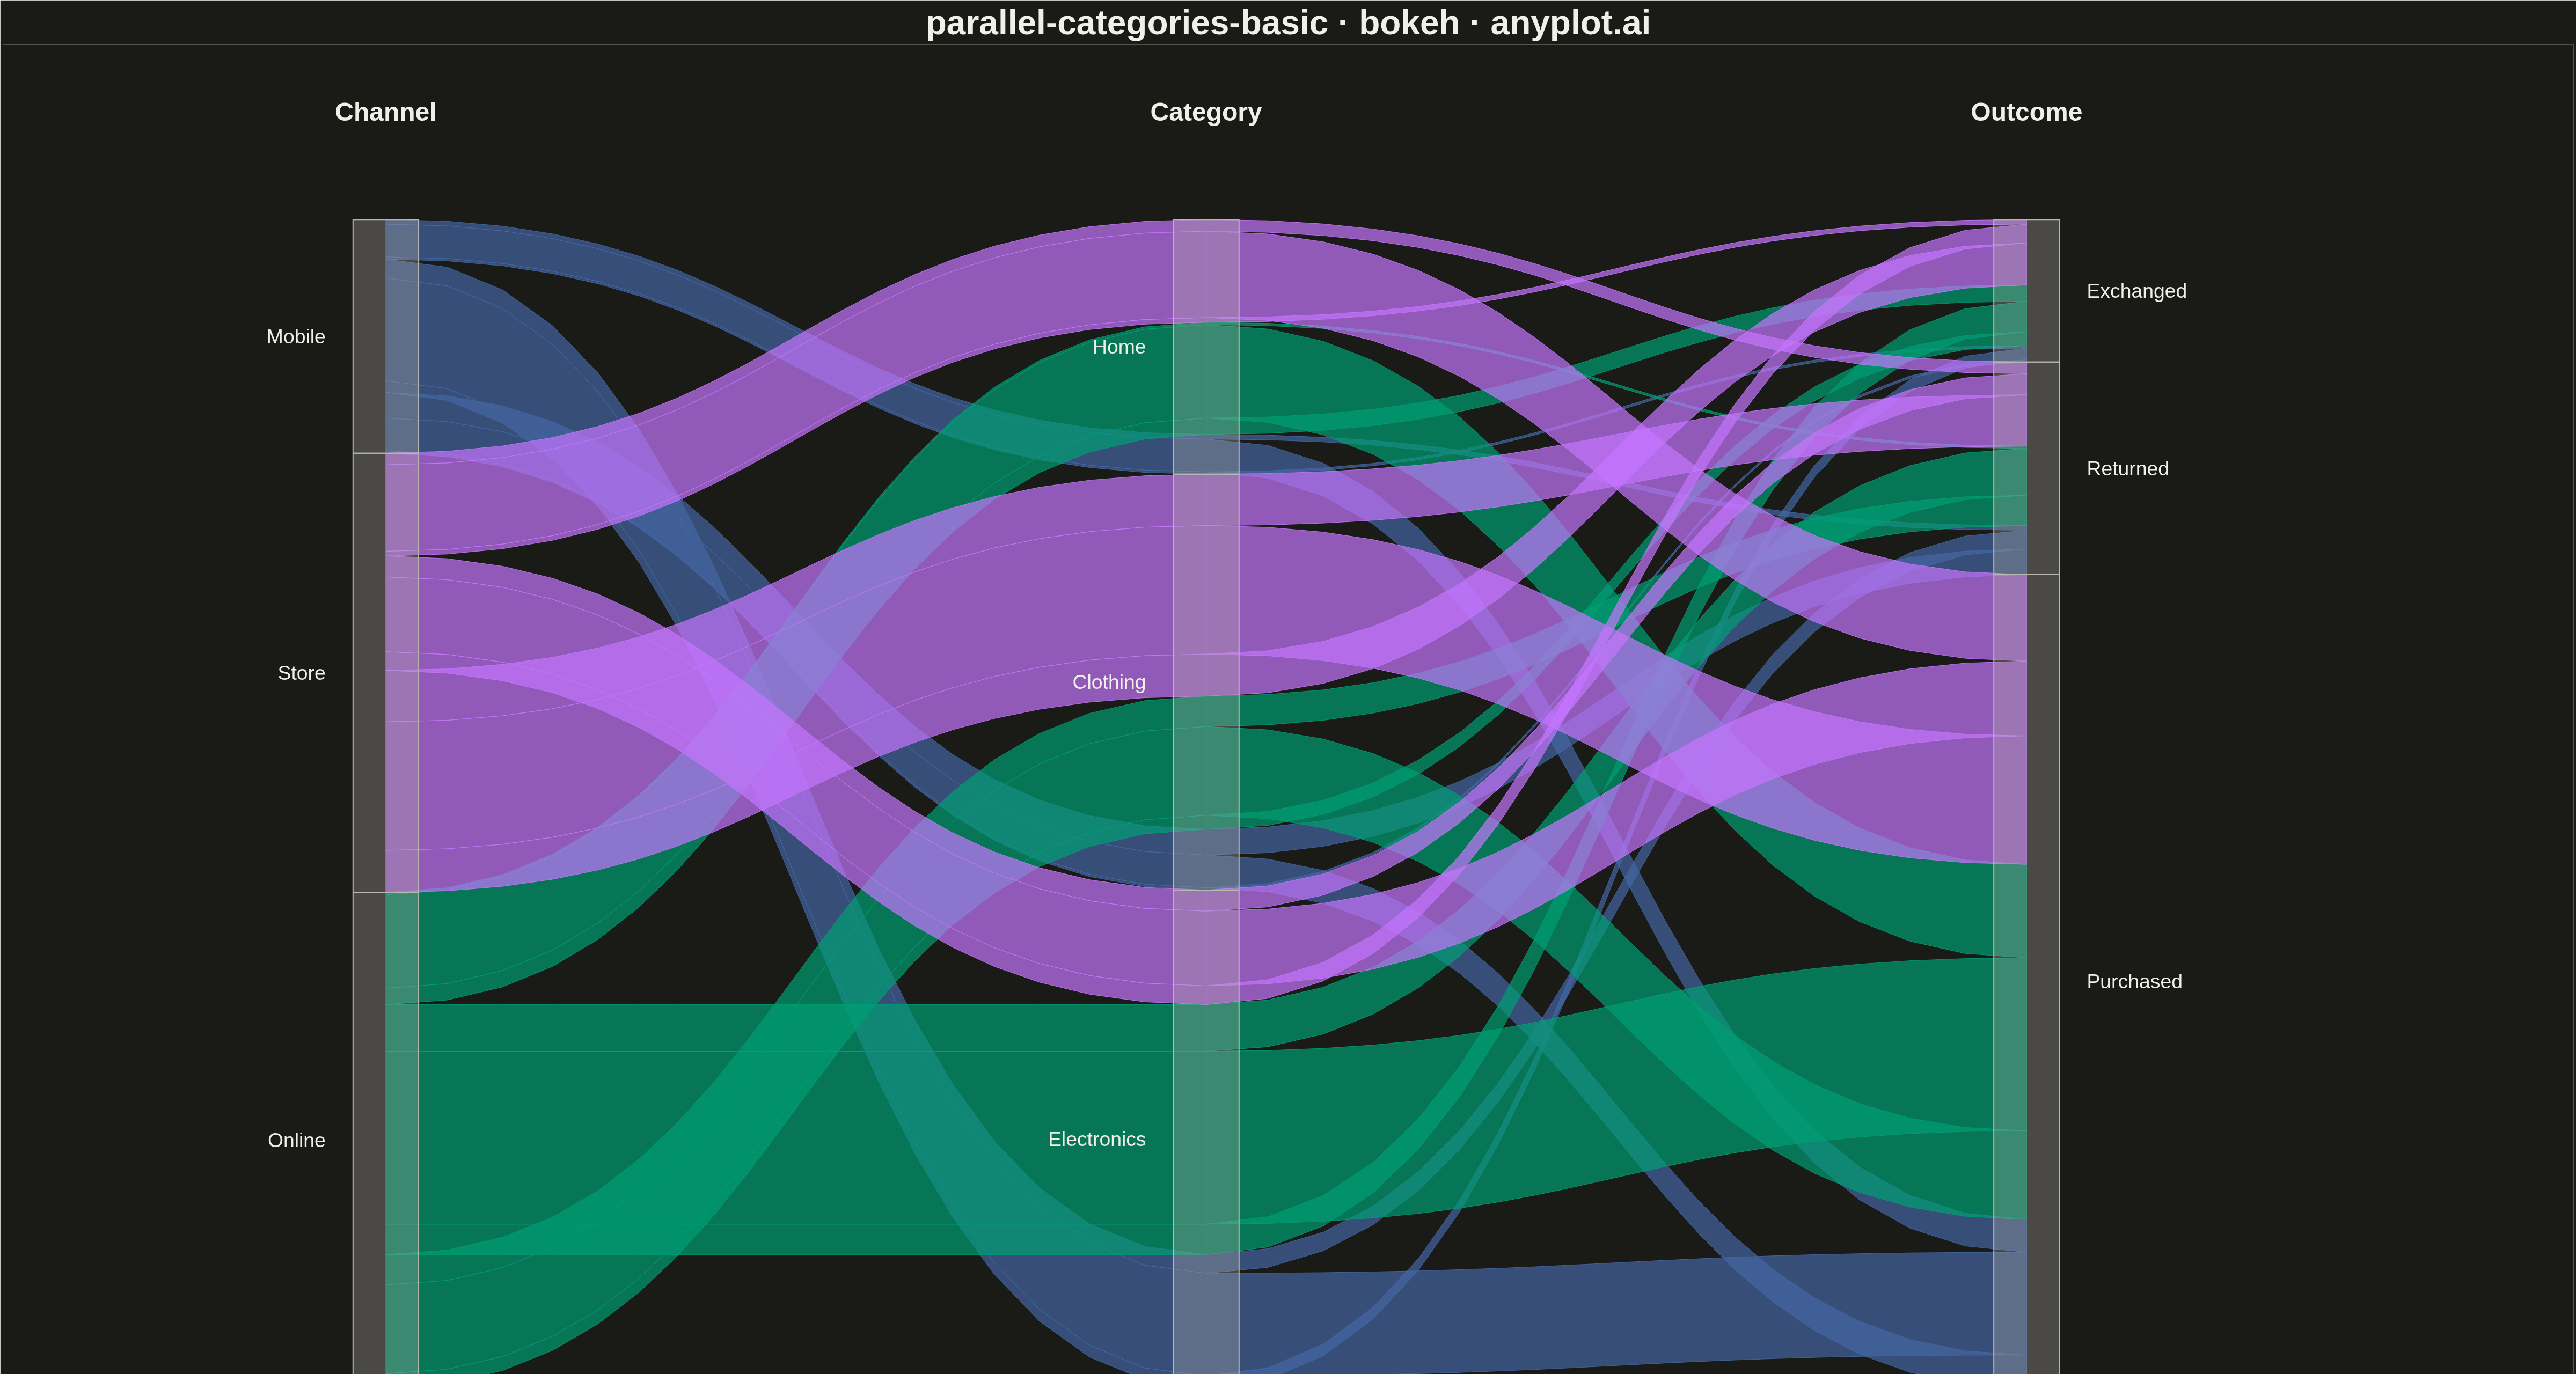
A parallel categories plot visualizes categorical data across multiple dimensions, with vertical axes representing each categorical variable and ribbons connecting categories to show observation flow. Unlike parallel coordinates (which use lines for numeric data), parallel categories use width-proportional ribbons to show counts or frequencies, making it ideal for understanding how categorical values co-occur and flow across multiple classification dimensions.
""" anyplot.ai
parallel-categories-basic: Basic Parallel Categories Plot
Library: bokeh 3.9.0 | Python 3.13.13
Quality: 96/100 | Updated: 2026-05-13
"""

import os
import time
from pathlib import Path

import numpy as np
import pandas as pd
from bokeh.io import output_file, save
from bokeh.models import ColumnDataSource, Label
from bokeh.plotting import figure
from selenium import webdriver
from selenium.webdriver.chrome.options import Options


# Theme tokens
THEME = os.getenv("ANYPLOT_THEME", "light")
PAGE_BG = "#FAF8F1" if THEME == "light" else "#1A1A17"
ELEVATED_BG = "#FFFDF6" if THEME == "light" else "#242420"
INK = "#1A1A17" if THEME == "light" else "#F0EFE8"
INK_SOFT = "#4A4A44" if THEME == "light" else "#B8B7B0"

# Okabe-Ito palette - first series always #009E73
IMPRINT = ["#009E73", "#C475FD", "#4467A3", "#BD8233", "#AE3030", "#2ABCCD", "#954477"]

# Data - Product purchase journey: Channel -> Category -> Outcome
np.random.seed(42)

channels = ["Online", "Store", "Mobile"]
categories = ["Electronics", "Clothing", "Home"]
outcomes = ["Purchased", "Returned", "Exchanged"]

# Generate data with realistic patterns
data = []
for _ in range(500):
    channel = np.random.choice(channels, p=[0.45, 0.35, 0.20])
    if channel == "Online":
        category = np.random.choice(categories, p=[0.5, 0.3, 0.2])
    elif channel == "Store":
        category = np.random.choice(categories, p=[0.2, 0.5, 0.3])
    else:
        category = np.random.choice(categories, p=[0.6, 0.25, 0.15])
    if category == "Electronics":
        outcome = np.random.choice(outcomes, p=[0.7, 0.2, 0.1])
    elif category == "Clothing":
        outcome = np.random.choice(outcomes, p=[0.6, 0.25, 0.15])
    else:
        outcome = np.random.choice(outcomes, p=[0.85, 0.1, 0.05])
    data.append({"Channel": channel, "Category": category, "Outcome": outcome})

df = pd.DataFrame(data)

# Aggregate data to get counts for each path
path_counts = df.groupby(["Channel", "Category", "Outcome"]).size().reset_index(name="count")

# Define dimensions and their unique values
dimensions = ["Channel", "Category", "Outcome"]
dim_values = {"Channel": channels, "Category": categories, "Outcome": outcomes}

# Calculate x positions for each dimension
x_positions = {dim: i * 1.5 for i, dim in enumerate(dimensions)}

# Total count for normalization
total_count = len(df)

# Build category positions for each dimension
dim_cat_positions = {}
for dim in dimensions:
    counts = df[dim].value_counts()
    positions = {}
    y_current = 0
    for cat in dim_values[dim]:
        count = counts.get(cat, 0)
        height = count / total_count
        positions[cat] = {"y_start": y_current, "height": height, "y_end": y_current + height}
        y_current += height
    dim_cat_positions[dim] = positions

# Create ribbons connecting categories between adjacent dimensions
ribbon_patches_x = []
ribbon_patches_y = []
ribbon_colors = []

# Color by first dimension (Channel) - using Okabe-Ito palette
channel_colors = {
    "Online": IMPRINT[0],  # #009E73
    "Store": IMPRINT[1],  # #C475FD
    "Mobile": IMPRINT[2],  # #4467A3
}

# Track running position within each category box
running_positions = {dim: dict.fromkeys(dim_values[dim], 0) for dim in dimensions}

# Process each unique path
for _, row in path_counts.iterrows():
    count = row["count"]
    ribbon_height = count / total_count

    # Get color based on first dimension
    color = channel_colors[row["Channel"]]

    # Create ribbons between each pair of adjacent dimensions
    for i in range(len(dimensions) - 1):
        dim1 = dimensions[i]
        dim2 = dimensions[i + 1]
        cat1 = row[dim1]
        cat2 = row[dim2]

        # Get x positions
        x1 = x_positions[dim1]
        x2 = x_positions[dim2]

        # Get y positions
        y1_base = dim_cat_positions[dim1][cat1]["y_start"]
        y1_start = y1_base + running_positions[dim1][cat1]
        y1_end = y1_start + ribbon_height

        y2_base = dim_cat_positions[dim2][cat2]["y_start"]
        y2_start = y2_base + running_positions[dim2][cat2]
        y2_end = y2_start + ribbon_height

        # Create smooth ribbon using bezier-like path
        x_mid = (x1 + x2) / 2
        num_curve_points = 20
        t = np.linspace(0, 1, num_curve_points)

        # Top edge: bezier from (x1, y1_end) to (x2, y2_end)
        top_x = x1 * (1 - t) ** 3 + 3 * x_mid * t * (1 - t) ** 2 + 3 * x_mid * t**2 * (1 - t) + x2 * t**3
        top_y = y1_end * (1 - t) ** 3 + 3 * y1_end * t * (1 - t) ** 2 + 3 * y2_end * t**2 * (1 - t) + y2_end * t**3

        # Bottom edge: bezier from (x2, y2_start) to (x1, y1_start) (reversed)
        bottom_x = x2 * (1 - t) ** 3 + 3 * x_mid * t * (1 - t) ** 2 + 3 * x_mid * t**2 * (1 - t) + x1 * t**3
        bottom_y = (
            y2_start * (1 - t) ** 3 + 3 * y2_start * t * (1 - t) ** 2 + 3 * y1_start * t**2 * (1 - t) + y1_start * t**3
        )

        # Combine to form closed polygon
        patch_x = np.concatenate([top_x, bottom_x])
        patch_y = np.concatenate([top_y, bottom_y])

        ribbon_patches_x.append(patch_x.tolist())
        ribbon_patches_y.append(patch_y.tolist())
        ribbon_colors.append(color)

        # Update running positions after processing
        if i == len(dimensions) - 2:
            for j in range(len(dimensions)):
                dim = dimensions[j]
                cat = row[dim]
                running_positions[dim][cat] += ribbon_height

# Reset running positions for proper tracking
running_positions = {dim: dict.fromkeys(dim_values[dim], 0) for dim in dimensions}

# Process each path again to correctly update positions
for _, row in path_counts.iterrows():
    count = row["count"]
    ribbon_height = count / total_count
    for dim in dimensions:
        cat = row[dim]
        running_positions[dim][cat] += ribbon_height

# Create figure
p = figure(
    width=4800,
    height=2700,
    title="parallel-categories-basic · bokeh · anyplot.ai",
    x_range=(-0.7, 4.0),
    y_range=(-0.05, 1.15),
    tools="",
    toolbar_location=None,
)

# Draw ribbons
for i in range(len(ribbon_patches_x)):
    source = ColumnDataSource(data={"x": [ribbon_patches_x[i]], "y": [ribbon_patches_y[i]]})
    p.patches(
        xs="x",
        ys="y",
        source=source,
        fill_color=ribbon_colors[i],
        fill_alpha=0.7,
        line_color=ribbon_colors[i],
        line_alpha=0.9,
        line_width=1,
    )

# Draw category boxes (rectangles for each category in each dimension)
box_width = 0.12
for dim in dimensions:
    x = x_positions[dim]
    for cat in dim_values[dim]:
        pos = dim_cat_positions[dim][cat]
        source = ColumnDataSource(
            data={
                "x": [[x - box_width / 2, x + box_width / 2, x + box_width / 2, x - box_width / 2]],
                "y": [[pos["y_start"], pos["y_start"], pos["y_end"], pos["y_end"]]],
            }
        )
        p.patches(xs="x", ys="y", source=source, fill_color=INK_SOFT, fill_alpha=0.3, line_color=INK_SOFT, line_width=2)

        # Add category label
        y_mid = (pos["y_start"] + pos["y_end"]) / 2
        if dim == dimensions[-1]:
            label_x = x + box_width / 2 + 0.05
            align = "left"
        else:
            label_x = x - box_width / 2 - 0.05
            align = "right"
        label = Label(
            x=label_x,
            y=y_mid,
            text=cat,
            text_font_size="28pt",
            text_color=INK,
            text_align=align,
            text_baseline="middle",
        )
        p.add_layout(label)

# Add dimension labels at the top
for dim in dimensions:
    x = x_positions[dim]
    label = Label(
        x=x,
        y=1.08,
        text=dim,
        text_font_size="36pt",
        text_color=INK,
        text_font_style="bold",
        text_align="center",
        text_baseline="bottom",
    )
    p.add_layout(label)

# Add legend - centered bottom for better balance
legend_items = [("Online", IMPRINT[0]), ("Store", IMPRINT[1]), ("Mobile", IMPRINT[2])]
legend_x_start = 0.8
legend_y = -0.02
for i, (name, color) in enumerate(legend_items):
    lx = legend_x_start + i * 0.5
    ly = legend_y
    # Legend box
    source = ColumnDataSource(
        data={"x": [[lx - 0.05, lx + 0.05, lx + 0.05, lx - 0.05]], "y": [[ly - 0.03, ly - 0.03, ly + 0.03, ly + 0.03]]}
    )
    p.patches(xs="x", ys="y", source=source, fill_color=color, fill_alpha=0.85, line_color=INK_SOFT, line_width=2)
    # Legend label
    label = Label(
        x=lx + 0.1,
        y=ly,
        text=name,
        text_font_size="24pt",
        text_color=INK_SOFT,
        text_align="left",
        text_baseline="middle",
    )
    p.add_layout(label)

# Style the figure
p.title.text_font_size = "48pt"
p.title.text_color = INK
p.title.align = "center"

# Hide axes and grid
p.xaxis.visible = False
p.yaxis.visible = False
p.xgrid.visible = False
p.ygrid.visible = False
p.outline_line_color = None

# Theme-adaptive background
p.background_fill_color = PAGE_BG
p.border_fill_color = PAGE_BG

# Save as HTML
output_file(f"plot-{THEME}.html")
save(p)

# Screenshot with headless Chrome using Selenium
W, H = 4800, 2700
opts = Options()
for arg in (
    "--headless=new",
    "--no-sandbox",
    "--disable-dev-shm-usage",
    "--disable-gpu",
    f"--window-size={W},{H}",
    "--hide-scrollbars",
):
    opts.add_argument(arg)
driver = webdriver.Chrome(options=opts)
driver.set_window_size(W, H)
driver.get(f"file://{Path(f'plot-{THEME}.html').resolve()}")
time.sleep(3)
driver.save_screenshot(f"plot-{THEME}.png")
driver.quit()
Runnable source as JSON, for any HTTP client: https://api.anyplot.ai/specs/parallel-categories-basic/bokeh/code. Any spec id and library id listed in llms-full.txt fit the same URL shape; every URL below is complete and callable.
{
  "spec_id": "parallel-categories-basic",
  "language": "python",
  "library": "bokeh",
  "page": "https://anyplot.ai/parallel-categories-basic/python/bokeh",
  "hub": "https://anyplot.ai/parallel-categories-basic",
  "code_json": "https://api.anyplot.ai/specs/parallel-categories-basic/bokeh/code",
  "spec_json": "https://api.anyplot.ai/specs/parallel-categories-basic",
  "render_light_png": "https://storage.googleapis.com/anyplot-images/plots/parallel-categories-basic/python/bokeh/plot-light.png",
  "render_dark_png": "https://storage.googleapis.com/anyplot-images/plots/parallel-categories-basic/python/bokeh/plot-dark.png",
  "interactive_light_html": "https://storage.googleapis.com/anyplot-images/plots/parallel-categories-basic/python/bokeh/plot-light.html",
  "interactive_dark_html": "https://storage.googleapis.com/anyplot-images/plots/parallel-categories-basic/python/bokeh/plot-dark.html",
  "quality_score": 96.0,
  "license": "MIT",
  "guide": "https://anyplot.ai/llms.txt"
}
Part of Basic Parallel Categories Plot on anyplot.ai.