The same plot in 14 other libraries — JavaScript: Chart.js, D3.js, Apache ECharts, MUI X Charts; Python: Altair, Bokeh, lets-plot, Matplotlib, Plotly, plotnine, Pygal, Seaborn; R: ggplot2; Julia: Makie.jl. Compare all 15 side by side: Basic Parallel Categories Plot in Python, R, Julia and JavaScript.
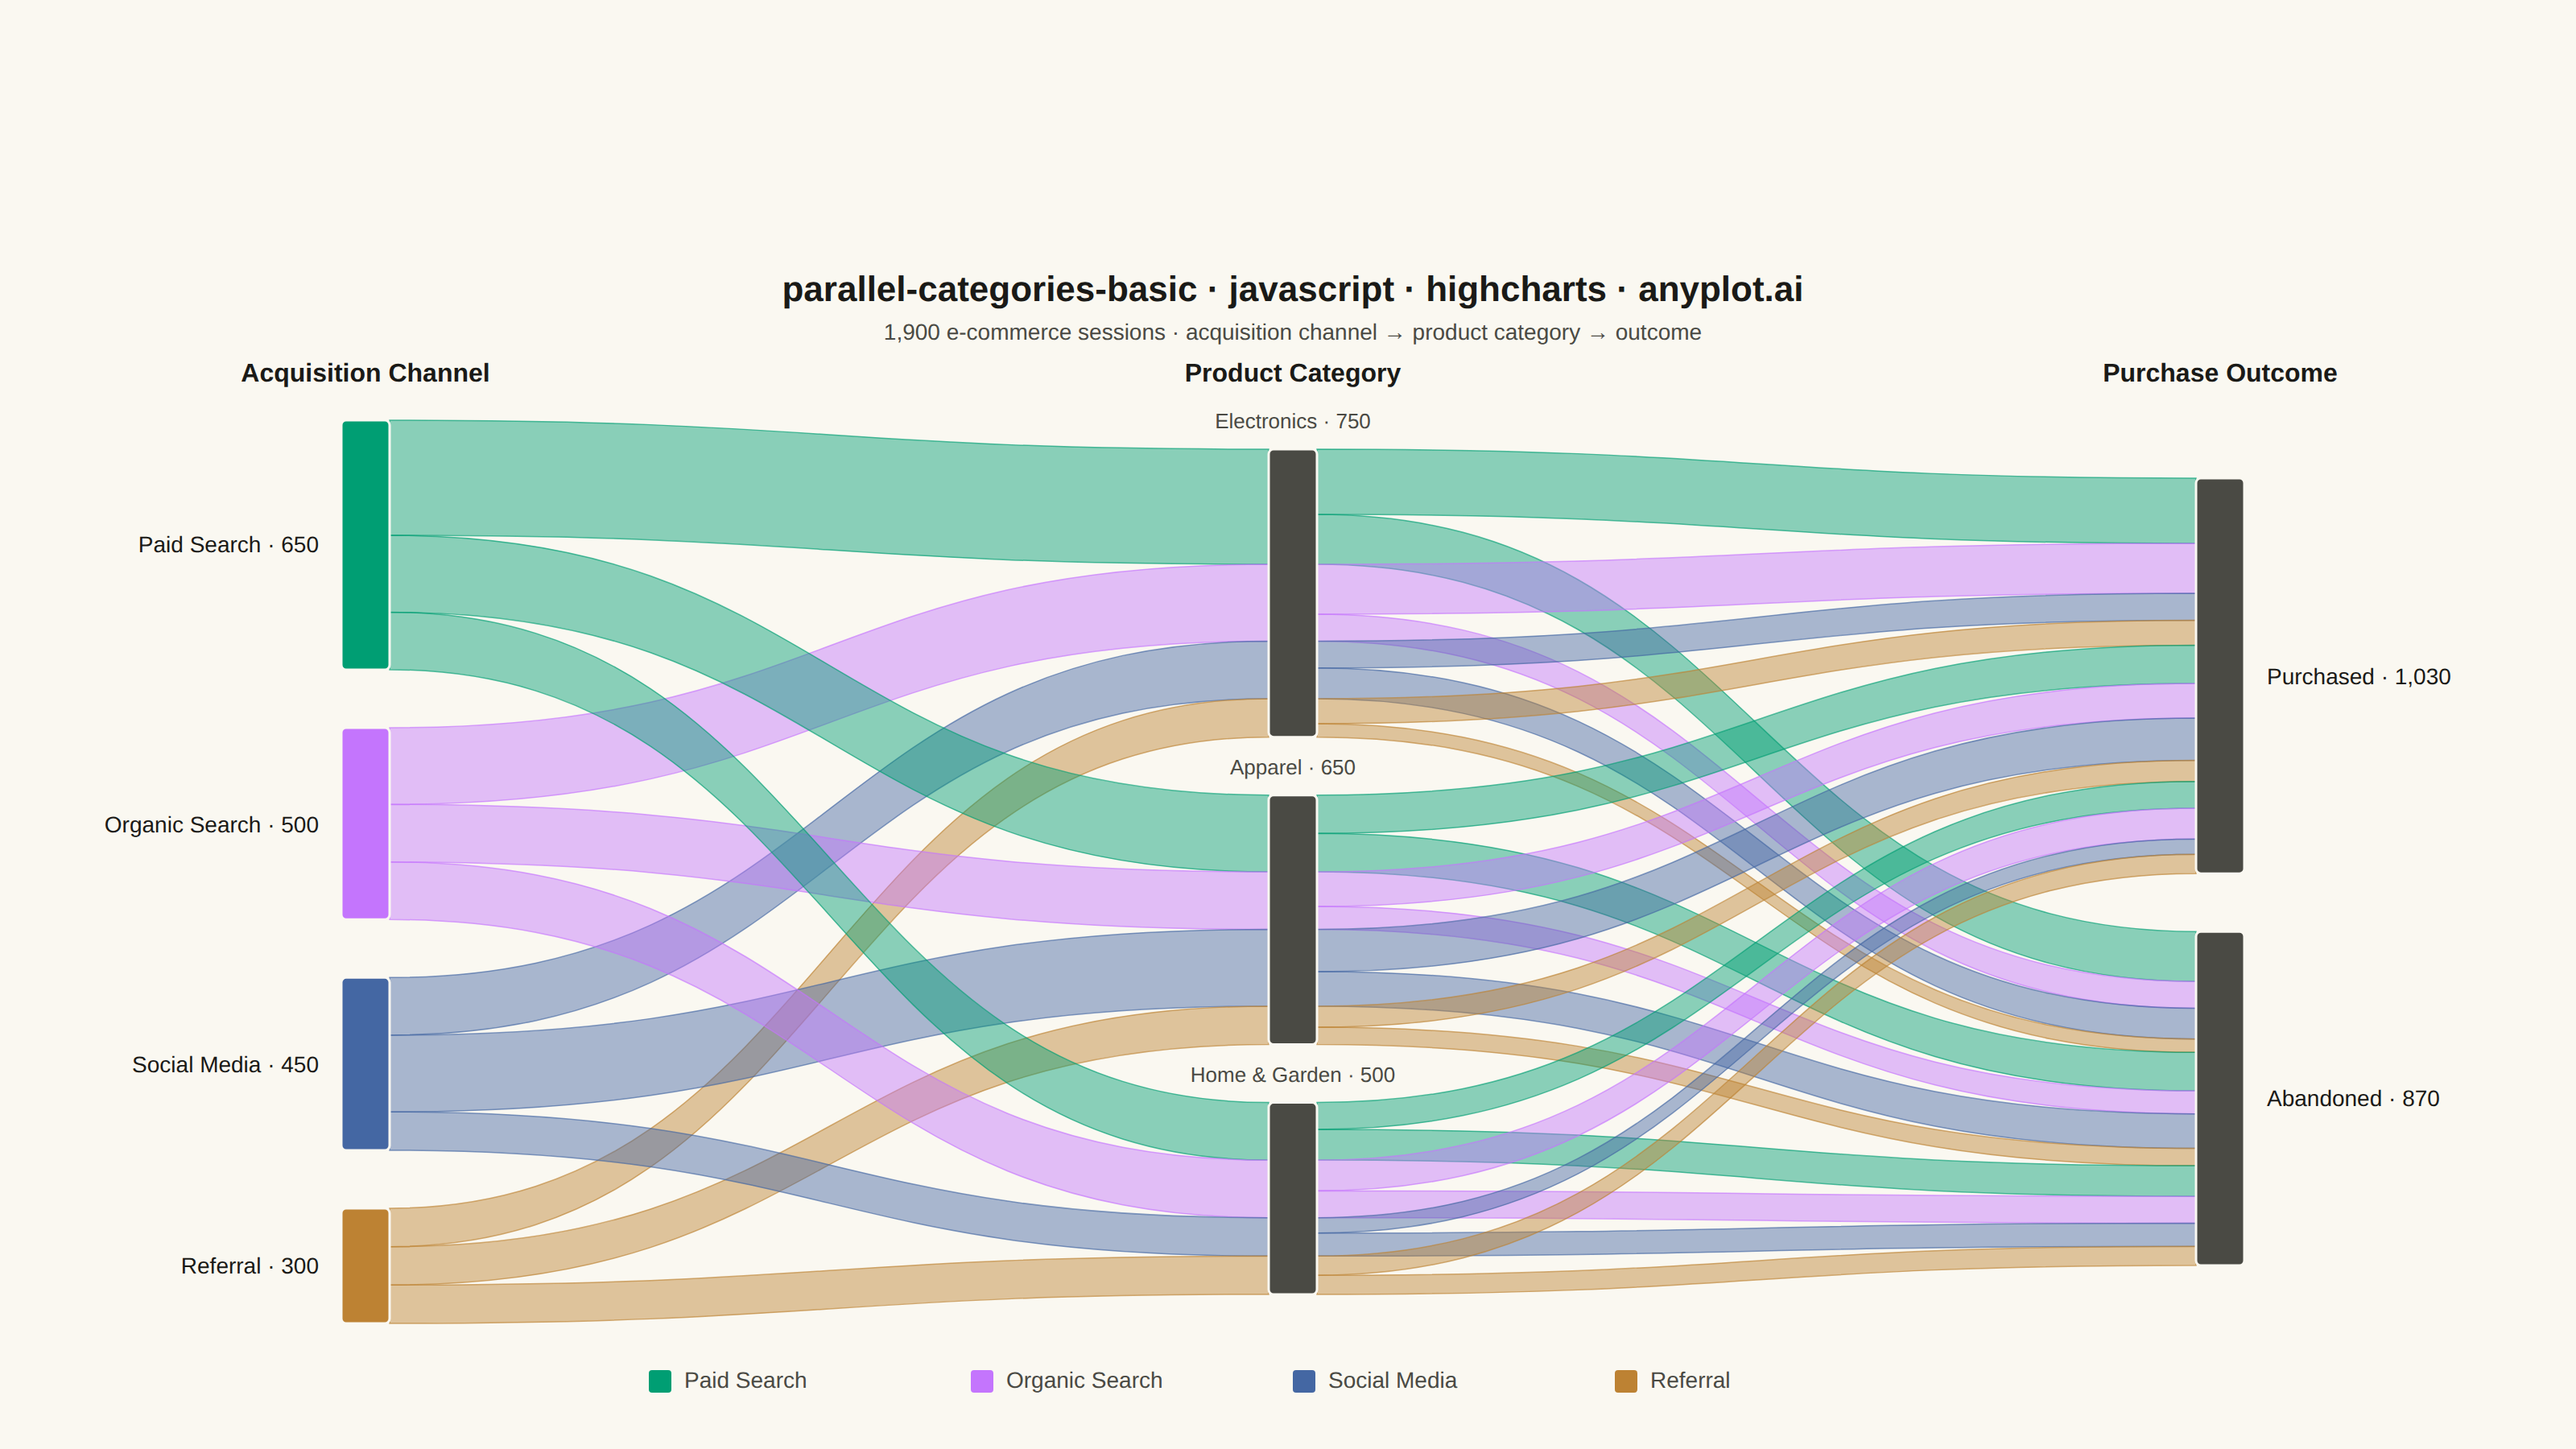
A parallel categories plot visualizes categorical data across multiple dimensions, with vertical axes representing each categorical variable and ribbons connecting categories to show observation flow. Unlike parallel coordinates (which use lines for numeric data), parallel categories use width-proportional ribbons to show counts or frequencies, making it ideal for understanding how categorical values co-occur and flow across multiple classification dimensions.
// anyplot.ai
// parallel-categories-basic: Basic Parallel Categories Plot
// Library: highcharts 12.6.0 | JavaScript 22.23.2
// Quality: 88/100 | Created: 2026-09-05

// Parallel categories needs width-proportional ribbons connecting categorical
// axes — visually the same shape as a Sankey diagram. The sankey/dependency-
// wheel series types live in an add-on module that isn't vendored here (see
// prompts/library/highcharts.md, "Forbidden patterns" — only the core bundle
// is loaded). The core SVGRenderer is not a module, though, so this snippet
// hand-draws the category axes and the ribbons connecting them with
// chart.renderer primitives inside a series-less chart.

const t = window.ANYPLOT_TOKENS;

// --- Data (in-memory, deterministic) ----------------------------------------
// 1,900 e-commerce sessions classified across three categorical dimensions:
// how the visitor arrived, which product category they browsed, and whether
// they purchased. Every session is exactly one (channel, product, outcome)
// combination, so ribbon widths and node heights stay internally consistent
// by construction — no separate rollup can drift out of balance.
const CHANNEL_ORDER = ["Paid Search", "Organic Search", "Social Media", "Referral"];
const PRODUCT_ORDER = ["Electronics", "Apparel", "Home & Garden"];
const OUTCOME_ORDER = ["Purchased", "Abandoned"];
const COLUMN_LABELS = ["Acquisition Channel", "Product Category", "Purchase Outcome"];

// Color by the first dimension (channel) so a ribbon's hue traces a session's
// origin all the way through the product and outcome columns. Palette
// positions follow CHANNEL_ORDER exactly — brand green goes to the first
// (topmost, largest) channel, not cherry-picked.
const CHANNEL_COLOR = {
  "Paid Search": t.palette[0], // brand green — first channel in canonical/visual order
  "Organic Search": t.palette[1],
  "Social Media": t.palette[2],
  Referral: t.palette[3],
};

const SESSIONS = [
  { channel: "Organic Search", product: "Electronics", outcome: "Purchased", value: 130 },
  { channel: "Organic Search", product: "Electronics", outcome: "Abandoned", value: 70 },
  { channel: "Organic Search", product: "Apparel", outcome: "Purchased", value: 90 },
  { channel: "Organic Search", product: "Apparel", outcome: "Abandoned", value: 60 },
  { channel: "Organic Search", product: "Home & Garden", outcome: "Purchased", value: 80 },
  { channel: "Organic Search", product: "Home & Garden", outcome: "Abandoned", value: 70 },
  { channel: "Paid Search", product: "Electronics", outcome: "Purchased", value: 170 },
  { channel: "Paid Search", product: "Electronics", outcome: "Abandoned", value: 130 },
  { channel: "Paid Search", product: "Apparel", outcome: "Purchased", value: 100 },
  { channel: "Paid Search", product: "Apparel", outcome: "Abandoned", value: 100 },
  { channel: "Paid Search", product: "Home & Garden", outcome: "Purchased", value: 70 },
  { channel: "Paid Search", product: "Home & Garden", outcome: "Abandoned", value: 80 },
  { channel: "Social Media", product: "Electronics", outcome: "Purchased", value: 70 },
  { channel: "Social Media", product: "Electronics", outcome: "Abandoned", value: 80 },
  { channel: "Social Media", product: "Apparel", outcome: "Purchased", value: 110 },
  { channel: "Social Media", product: "Apparel", outcome: "Abandoned", value: 90 },
  { channel: "Social Media", product: "Home & Garden", outcome: "Purchased", value: 40 },
  { channel: "Social Media", product: "Home & Garden", outcome: "Abandoned", value: 60 },
  { channel: "Referral", product: "Electronics", outcome: "Purchased", value: 65 },
  { channel: "Referral", product: "Electronics", outcome: "Abandoned", value: 35 },
  { channel: "Referral", product: "Apparel", outcome: "Purchased", value: 55 },
  { channel: "Referral", product: "Apparel", outcome: "Abandoned", value: 45 },
  { channel: "Referral", product: "Home & Garden", outcome: "Purchased", value: 50 },
  { channel: "Referral", product: "Home & Garden", outcome: "Abandoned", value: 50 },
];

const sumBy = (key, name) => SESSIONS.filter((s) => s[key] === name).reduce((sum, s) => sum + s.value, 0);
const channelTotal = Object.fromEntries(CHANNEL_ORDER.map((c) => [c, sumBy("channel", c)]));
const productTotal = Object.fromEntries(PRODUCT_ORDER.map((p) => [p, sumBy("product", p)]));
const outcomeTotal = Object.fromEntries(OUTCOME_ORDER.map((o) => [o, sumBy("outcome", o)]));
const TOTAL = SESSIONS.reduce((sum, s) => sum + s.value, 0);

// --- Chart (series-less; ribbons hand-drawn via chart.renderer) ------------
Highcharts.chart("container", {
  chart: {
    backgroundColor: "transparent",
    animation: false,
    spacingTop: 170,
    spacingBottom: 78,
    spacingLeft: 212,
    spacingRight: 206,
    style: { fontFamily: "inherit" },
    events: {
      load() {
        drawParallelCategories(this);
      },
    },
  },
  credits: { enabled: false },
  title: {
    text: "parallel-categories-basic · javascript · highcharts · anyplot.ai",
    style: { color: t.ink, fontSize: "22px", fontWeight: "600" },
    margin: 50,
  },
  subtitle: {
    text: "1,900 e-commerce sessions · acquisition channel → product category → outcome",
    style: { color: t.inkSoft, fontSize: "14px" },
  },
  xAxis: { visible: false },
  yAxis: { visible: false },
  legend: { enabled: false },
  series: [],
});

// Stacks `categories` top-to-bottom proportional to `totals`, using a single
// shared `scale` (so a value means the same number of pixels in every column)
// and centering the stack vertically when it's shorter than the tallest
// column's full span.
function buildSegments(chart, categories, totals, gap, scale) {
  const stackHeight = TOTAL * scale + gap * (categories.length - 1);
  let y = chart.plotTop + (chart.plotHeight - stackHeight) / 2;
  const segments = {};
  categories.forEach((cat) => {
    const h = totals[cat] * scale;
    segments[cat] = { top: y, bottom: y + h, height: h };
    y += h + gap;
  });
  return segments;
}

function drawParallelCategories(chart) {
  const r = chart.renderer;
  const nodeWidth = 30;
  const gap = 36; // wide enough for a label to sit in the gap above a segment
  const usableWidth = chart.plotWidth - nodeWidth;
  const colX = (i) => chart.plotLeft + nodeWidth / 2 + (usableWidth * i) / (COLUMN_LABELS.length - 1);

  // One shared scale (calibrated to the column with the most categories/gaps)
  // keeps a session worth the same pixel height in every column, so a ribbon
  // never tapers or flares just because two columns have a different category
  // count.
  const maxCategories = Math.max(CHANNEL_ORDER.length, PRODUCT_ORDER.length, OUTCOME_ORDER.length);
  const scale = (chart.plotHeight - gap * (maxCategories - 1)) / TOTAL;

  const channelSeg = buildSegments(chart, CHANNEL_ORDER, channelTotal, gap, scale);
  const productSeg = buildSegments(chart, PRODUCT_ORDER, productTotal, gap, scale);
  const outcomeSeg = buildSegments(chart, OUTCOME_ORDER, outcomeTotal, gap, scale);

  // Ribbons are grouped by originating channel so a hover can highlight one
  // channel's whole path (both hops) while dimming every other ribbon — the
  // same thin colored stroke also keeps each ribbon's edge legible where
  // translucent fills overlap and would otherwise blend into a muddy blob.
  const ribbonsByChannel = {};
  CHANNEL_ORDER.forEach((c) => (ribbonsByChannel[c] = []));
  const REST_FILL_OPACITY = 0.45;
  const REST_STROKE_OPACITY = 0.65;
  const HOVER_FILL_OPACITY = 0.85;
  const DIM_OPACITY = 0.08;

  const ribbon = (x0, y0Top, y0Bottom, x1, y1Top, y1Bottom, color, channel) => {
    const cx = (x0 + x1) / 2;
    const el = r.path([
      "M", x0, y0Top,
      "C", cx, y0Top, cx, y1Top, x1, y1Top,
      "L", x1, y1Bottom,
      "C", cx, y1Bottom, cx, y0Bottom, x0, y0Bottom,
      "Z",
    ])
      .attr({
        fill: color,
        "fill-opacity": REST_FILL_OPACITY,
        stroke: color,
        "stroke-width": 0.75,
        "stroke-opacity": REST_STROKE_OPACITY,
      })
      .css({ cursor: "pointer" })
      .add();
    ribbonsByChannel[channel].push(el);
    el.on("mouseover", () => highlightChannel(channel));
    el.on("mouseout", resetRibbons);
    return el;
  };

  function highlightChannel(channel) {
    Object.entries(ribbonsByChannel).forEach(([ch, elements]) => {
      const active = ch === channel;
      elements.forEach((el) =>
        el.attr({
          "fill-opacity": active ? HOVER_FILL_OPACITY : DIM_OPACITY,
          "stroke-opacity": active ? 1 : DIM_OPACITY,
        }),
      );
    });
  }

  function resetRibbons() {
    Object.values(ribbonsByChannel)
      .flat()
      .forEach((el) => el.attr({ "fill-opacity": REST_FILL_OPACITY, "stroke-opacity": REST_STROKE_OPACITY }));
  }

  // Stage 1 — Channel -> Product. Iterating products outer / channels inner
  // gives every product node a fixed, repeatable top-to-bottom order of
  // contributing channels, which is exactly the order stage 2 reads back to
  // keep each channel's ribbon in the same vertical band as it crosses the
  // product node.
  const srcCursor = {};
  const tgtCursor = {};
  CHANNEL_ORDER.forEach((c) => (srcCursor[c] = channelSeg[c].top));
  PRODUCT_ORDER.forEach((p) => (tgtCursor[p] = productSeg[p].top));
  const subBand = {};
  const x0a = colX(0) + nodeWidth / 2;
  const x1a = colX(1) - nodeWidth / 2;

  PRODUCT_ORDER.forEach((product) => {
    CHANNEL_ORDER.forEach((channel) => {
      const value = sumBy2("channel", channel, "product", product);
      if (value <= 0) return;
      const h = value * scale;
      const y0 = srcCursor[channel];
      const y1 = tgtCursor[product];
      ribbon(x0a, y0, y0 + h, x1a, y1, y1 + h, CHANNEL_COLOR[channel], channel);
      subBand[`${product}|${channel}`] = { top: y1, bottom: y1 + h };
      srcCursor[channel] += h;
      tgtCursor[product] += h;
    });
  });

  // Stage 2 — Product -> Outcome, split by the originating channel so the
  // color (and thus the traceable path) survives the second hop too.
  const tgtCursor2 = {};
  OUTCOME_ORDER.forEach((o) => (tgtCursor2[o] = outcomeSeg[o].top));
  const x0b = colX(1) + nodeWidth / 2;
  const x1b = colX(2) - nodeWidth / 2;

  PRODUCT_ORDER.forEach((product) => {
    CHANNEL_ORDER.forEach((channel) => {
      const key = `${product}|${channel}`;
      if (!subBand[key]) return;
      let localTop = subBand[key].top;
      OUTCOME_ORDER.forEach((outcome) => {
        const value = SESSIONS.find((s) => s.channel === channel && s.product === product && s.outcome === outcome)?.value ?? 0;
        if (value <= 0) return;
        const h = value * scale;
        const y1 = tgtCursor2[outcome];
        ribbon(x0b, localTop, localTop + h, x1b, y1, y1 + h, CHANNEL_COLOR[channel], channel);
        localTop += h;
        tgtCursor2[outcome] += h;
      });
    });
  });

  // Nodes on top of the ribbons: channel nodes carry the color key, product
  // and outcome nodes stay neutral so the ribbon color alone tells the story.
  const drawNode = (x, seg, fill) => {
    Object.values(seg).forEach((s) => {
      if (s.height < 1) return;
      r.rect(x - nodeWidth / 2, s.top, nodeWidth, s.height, 3)
        .attr({ fill, stroke: t.pageBg, "stroke-width": 1.5 })
        .add();
    });
  };
  CHANNEL_ORDER.forEach((c) => {
    const s = channelSeg[c];
    if (s.height < 1) return;
    r.rect(colX(0) - nodeWidth / 2, s.top, nodeWidth, s.height, 3)
      .attr({ fill: CHANNEL_COLOR[c], stroke: t.pageBg, "stroke-width": 1.5 })
      .css({ cursor: "pointer" })
      .on("mouseover", () => highlightChannel(c))
      .on("mouseout", resetRibbons)
      .add();
  });
  PRODUCT_ORDER.forEach((p) => drawNode(colX(1), { [p]: productSeg[p] }, t.inkSoft));
  OUTCOME_ORDER.forEach((o) => drawNode(colX(2), { [o]: outcomeSeg[o] }, t.inkSoft));

  // Column (dimension) headers.
  COLUMN_LABELS.forEach((label, i) => {
    r.text(label, colX(i), chart.plotTop - 24)
      .attr({ align: "center" })
      .css({ color: t.ink, fontSize: "16px", fontWeight: "600" })
      .add();
  });

  // Endpoint labels (channel + outcome) sit beside their nodes, where there's
  // open horizontal space; the middle (product) column labels sit just above
  // each node instead, since ribbons touch both of its long edges.
  CHANNEL_ORDER.forEach((c) => {
    const s = channelSeg[c];
    if (s.height < 1) return;
    r.text(`${c} · ${channelTotal[c].toLocaleString()}`, colX(0) - nodeWidth / 2 - 14, (s.top + s.bottom) / 2 + 5)
      .attr({ align: "right" })
      .css({ color: t.ink, fontSize: "14px" })
      .add();
  });
  OUTCOME_ORDER.forEach((o) => {
    const s = outcomeSeg[o];
    if (s.height < 1) return;
    r.text(`${o} · ${outcomeTotal[o].toLocaleString()}`, colX(2) + nodeWidth / 2 + 14, (s.top + s.bottom) / 2 + 5)
      .attr({ align: "left" })
      .css({ color: t.ink, fontSize: "14px" })
      .add();
  });
  PRODUCT_ORDER.forEach((p) => {
    const s = productSeg[p];
    if (s.height < 1) return;
    r.text(`${p} · ${productTotal[p].toLocaleString()}`, colX(1), s.top - gap / 2 + 5)
      .attr({ align: "center" })
      .css({ color: t.inkSoft, fontSize: "13px" })
      .add();
  });

  // Legend — identifies the channel colors, which is the dimension the
  // ribbons are keyed on throughout both hops. Also hoverable, so it doubles
  // as a discoverable entry point into the same path-highlight as the nodes.
  const itemWidth = 200;
  const legendWidth = itemWidth * CHANNEL_ORDER.length;
  const legendY = chart.plotTop + chart.plotHeight + 40;
  const legendStartX = chart.plotLeft + (chart.plotWidth - legendWidth) / 2;
  CHANNEL_ORDER.forEach((c, i) => {
    const itemX = legendStartX + i * itemWidth;
    const swatch = r.rect(itemX, legendY - 11, 14, 14, 2).attr({ fill: CHANNEL_COLOR[c] }).css({ cursor: "pointer" }).add();
    const label = r
      .text(c, itemX + 22, legendY)
      .attr({ align: "left" })
      .css({ color: t.inkSoft, fontSize: "14px", cursor: "pointer" })
      .add();
    [swatch, label].forEach((el) => {
      el.on("mouseover", () => highlightChannel(c));
      el.on("mouseout", resetRibbons);
    });
  });
}

// Small helper for the two-key sum used in stage 1 (kept separate from `sumBy`
// above, which only filters on one key).
function sumBy2(keyA, valA, keyB, valB) {
  return SESSIONS.filter((s) => s[keyA] === valA && s[keyB] === valB).reduce((sum, s) => sum + s.value, 0);
}
Runnable source as JSON, for any HTTP client: https://api.anyplot.ai/specs/parallel-categories-basic/highcharts/code. Any spec id and library id listed in llms-full.txt fit the same URL shape; every URL below is complete and callable.
{
  "spec_id": "parallel-categories-basic",
  "language": "javascript",
  "library": "highcharts",
  "page": "https://anyplot.ai/parallel-categories-basic/javascript/highcharts",
  "hub": "https://anyplot.ai/parallel-categories-basic",
  "code_json": "https://api.anyplot.ai/specs/parallel-categories-basic/highcharts/code",
  "spec_json": "https://api.anyplot.ai/specs/parallel-categories-basic",
  "render_light_png": "https://storage.googleapis.com/anyplot-images/plots/parallel-categories-basic/javascript/highcharts/plot-light.png",
  "render_dark_png": "https://storage.googleapis.com/anyplot-images/plots/parallel-categories-basic/javascript/highcharts/plot-dark.png",
  "interactive_light_html": "https://storage.googleapis.com/anyplot-images/plots/parallel-categories-basic/javascript/highcharts/plot-light.html",
  "interactive_dark_html": "https://storage.googleapis.com/anyplot-images/plots/parallel-categories-basic/javascript/highcharts/plot-dark.html",
  "quality_score": 88.0,
  "license": "MIT",
  "guide": "https://anyplot.ai/llms.txt"
}
Part of Basic Parallel Categories Plot on anyplot.ai.