The same plot in 14 other libraries — JavaScript: Chart.js, D3.js, Highcharts, MUI X Charts; Python: Altair, Bokeh, lets-plot, Matplotlib, Plotly, plotnine, Pygal, Seaborn; R: ggplot2; Julia: Makie.jl. Compare all 15 side by side: Basic Parallel Categories Plot in Python, R, Julia and JavaScript.
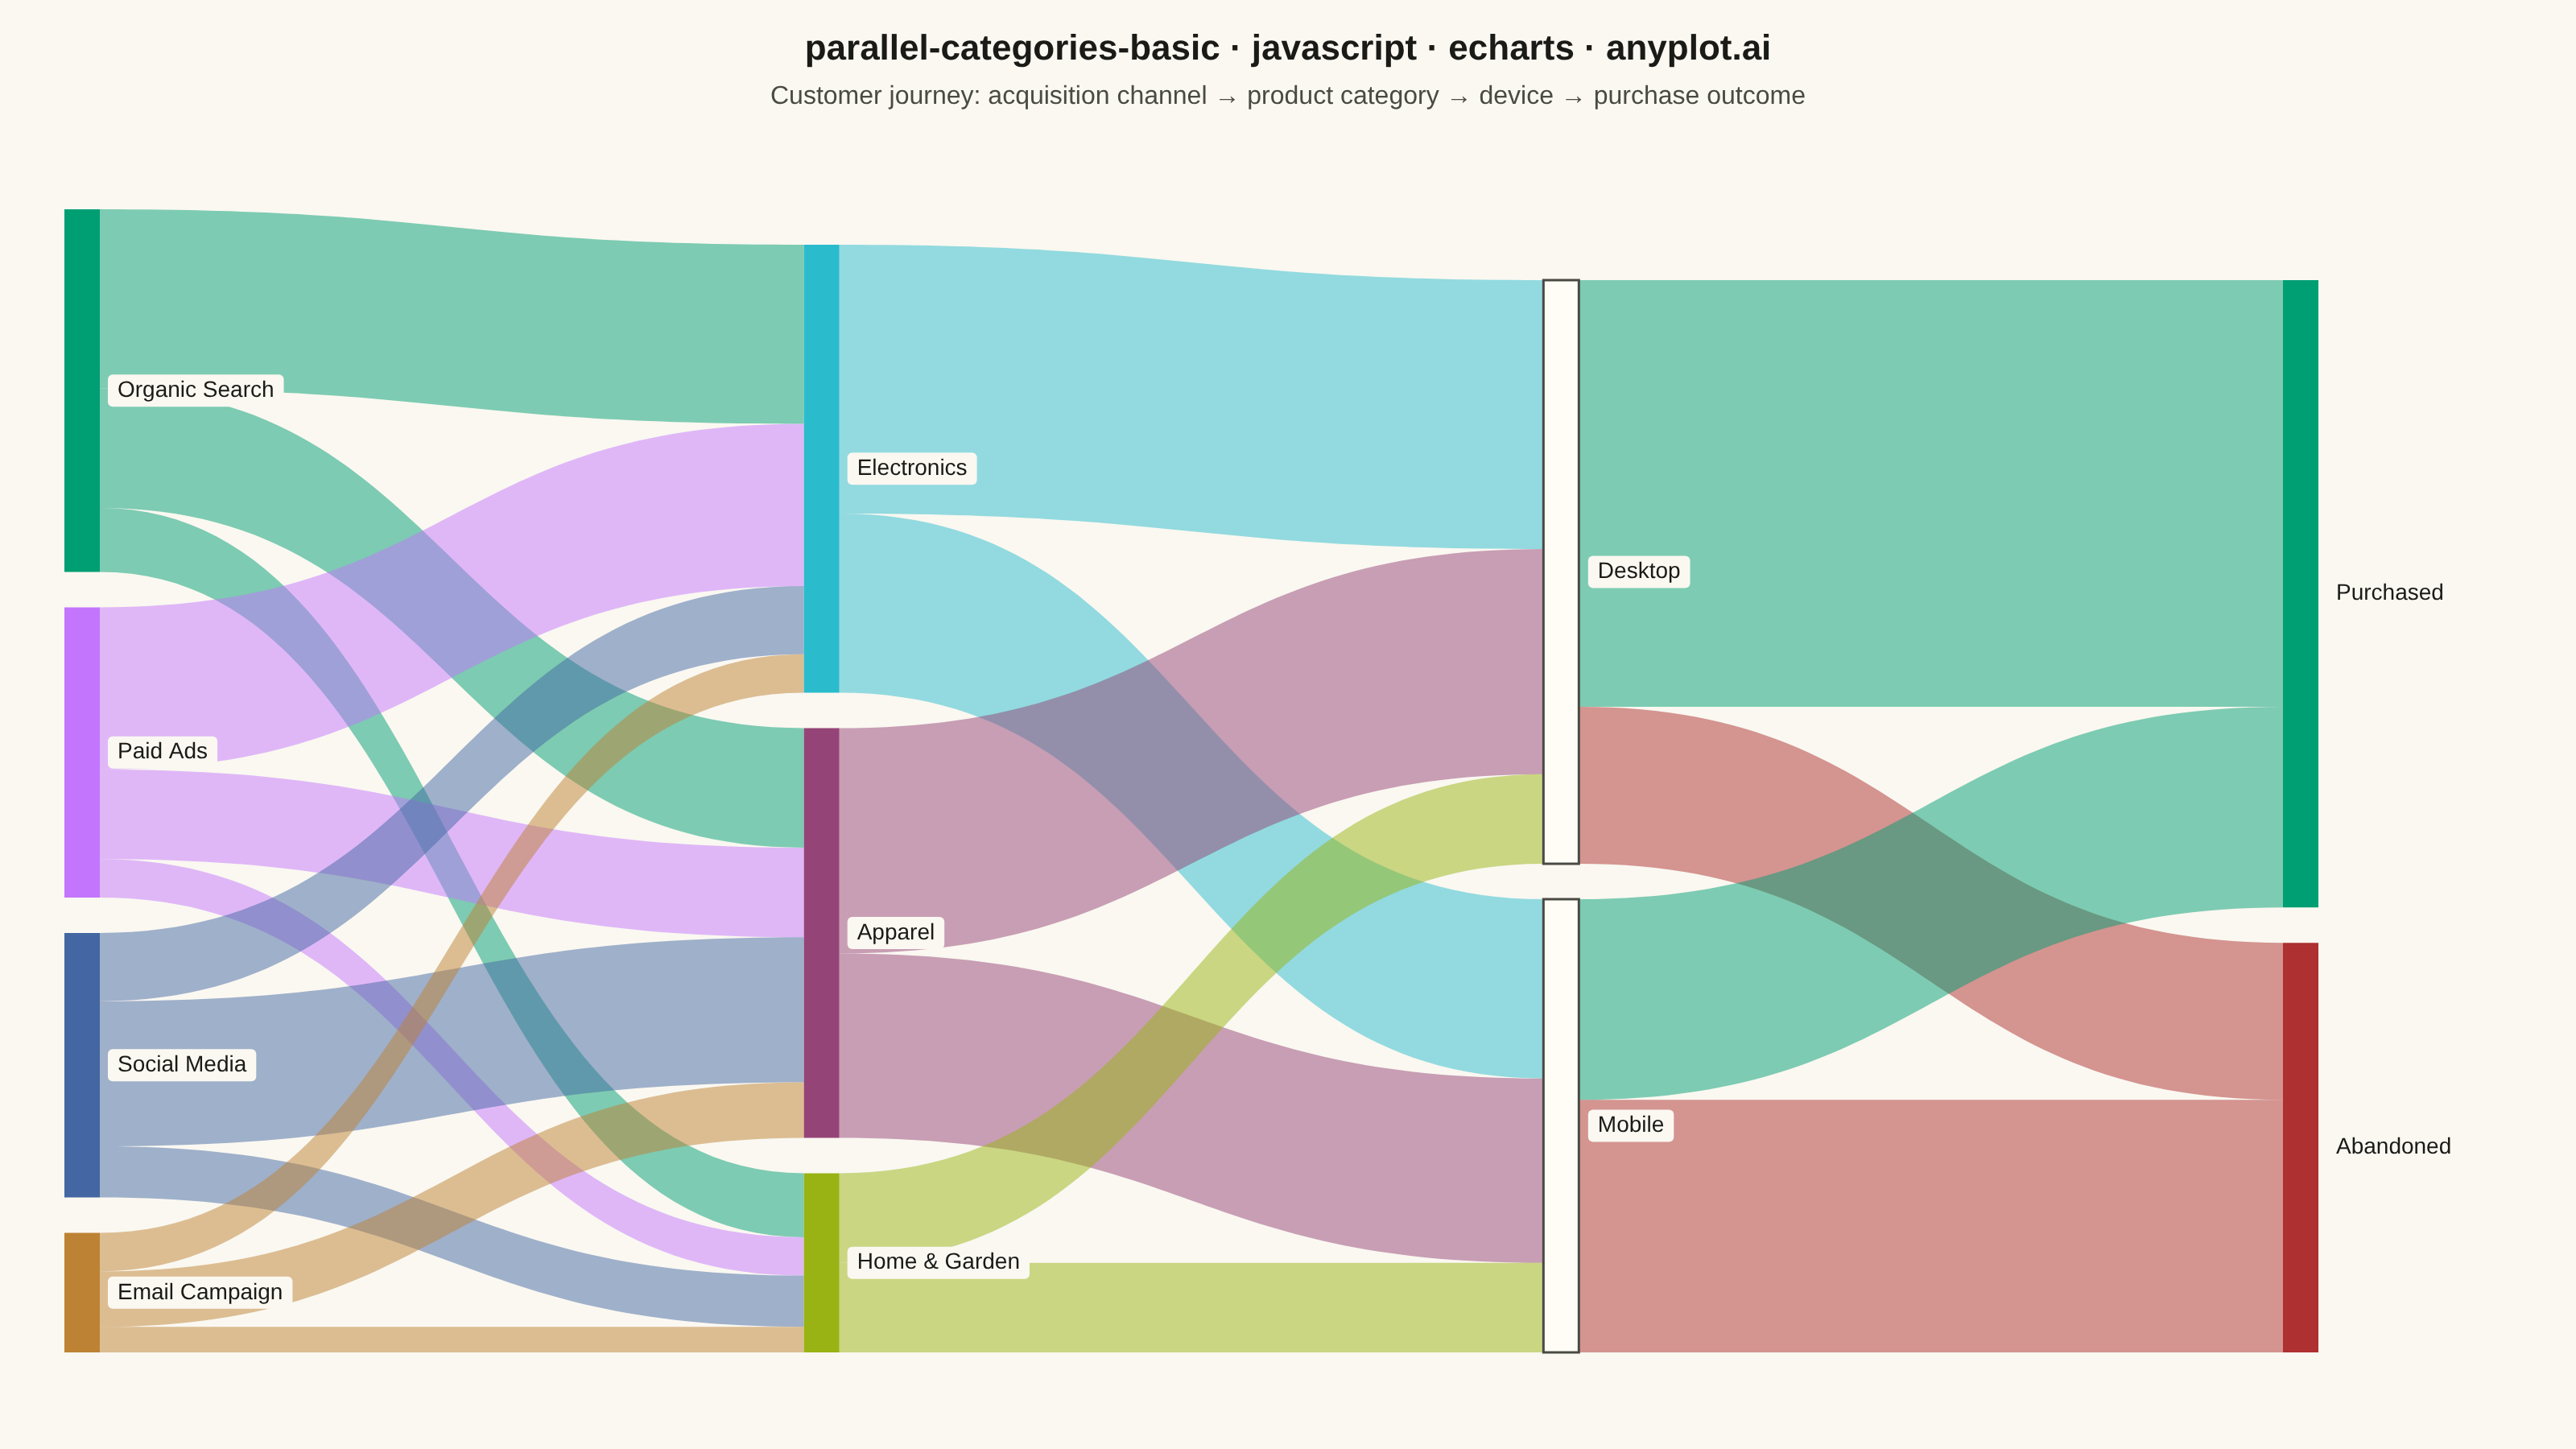
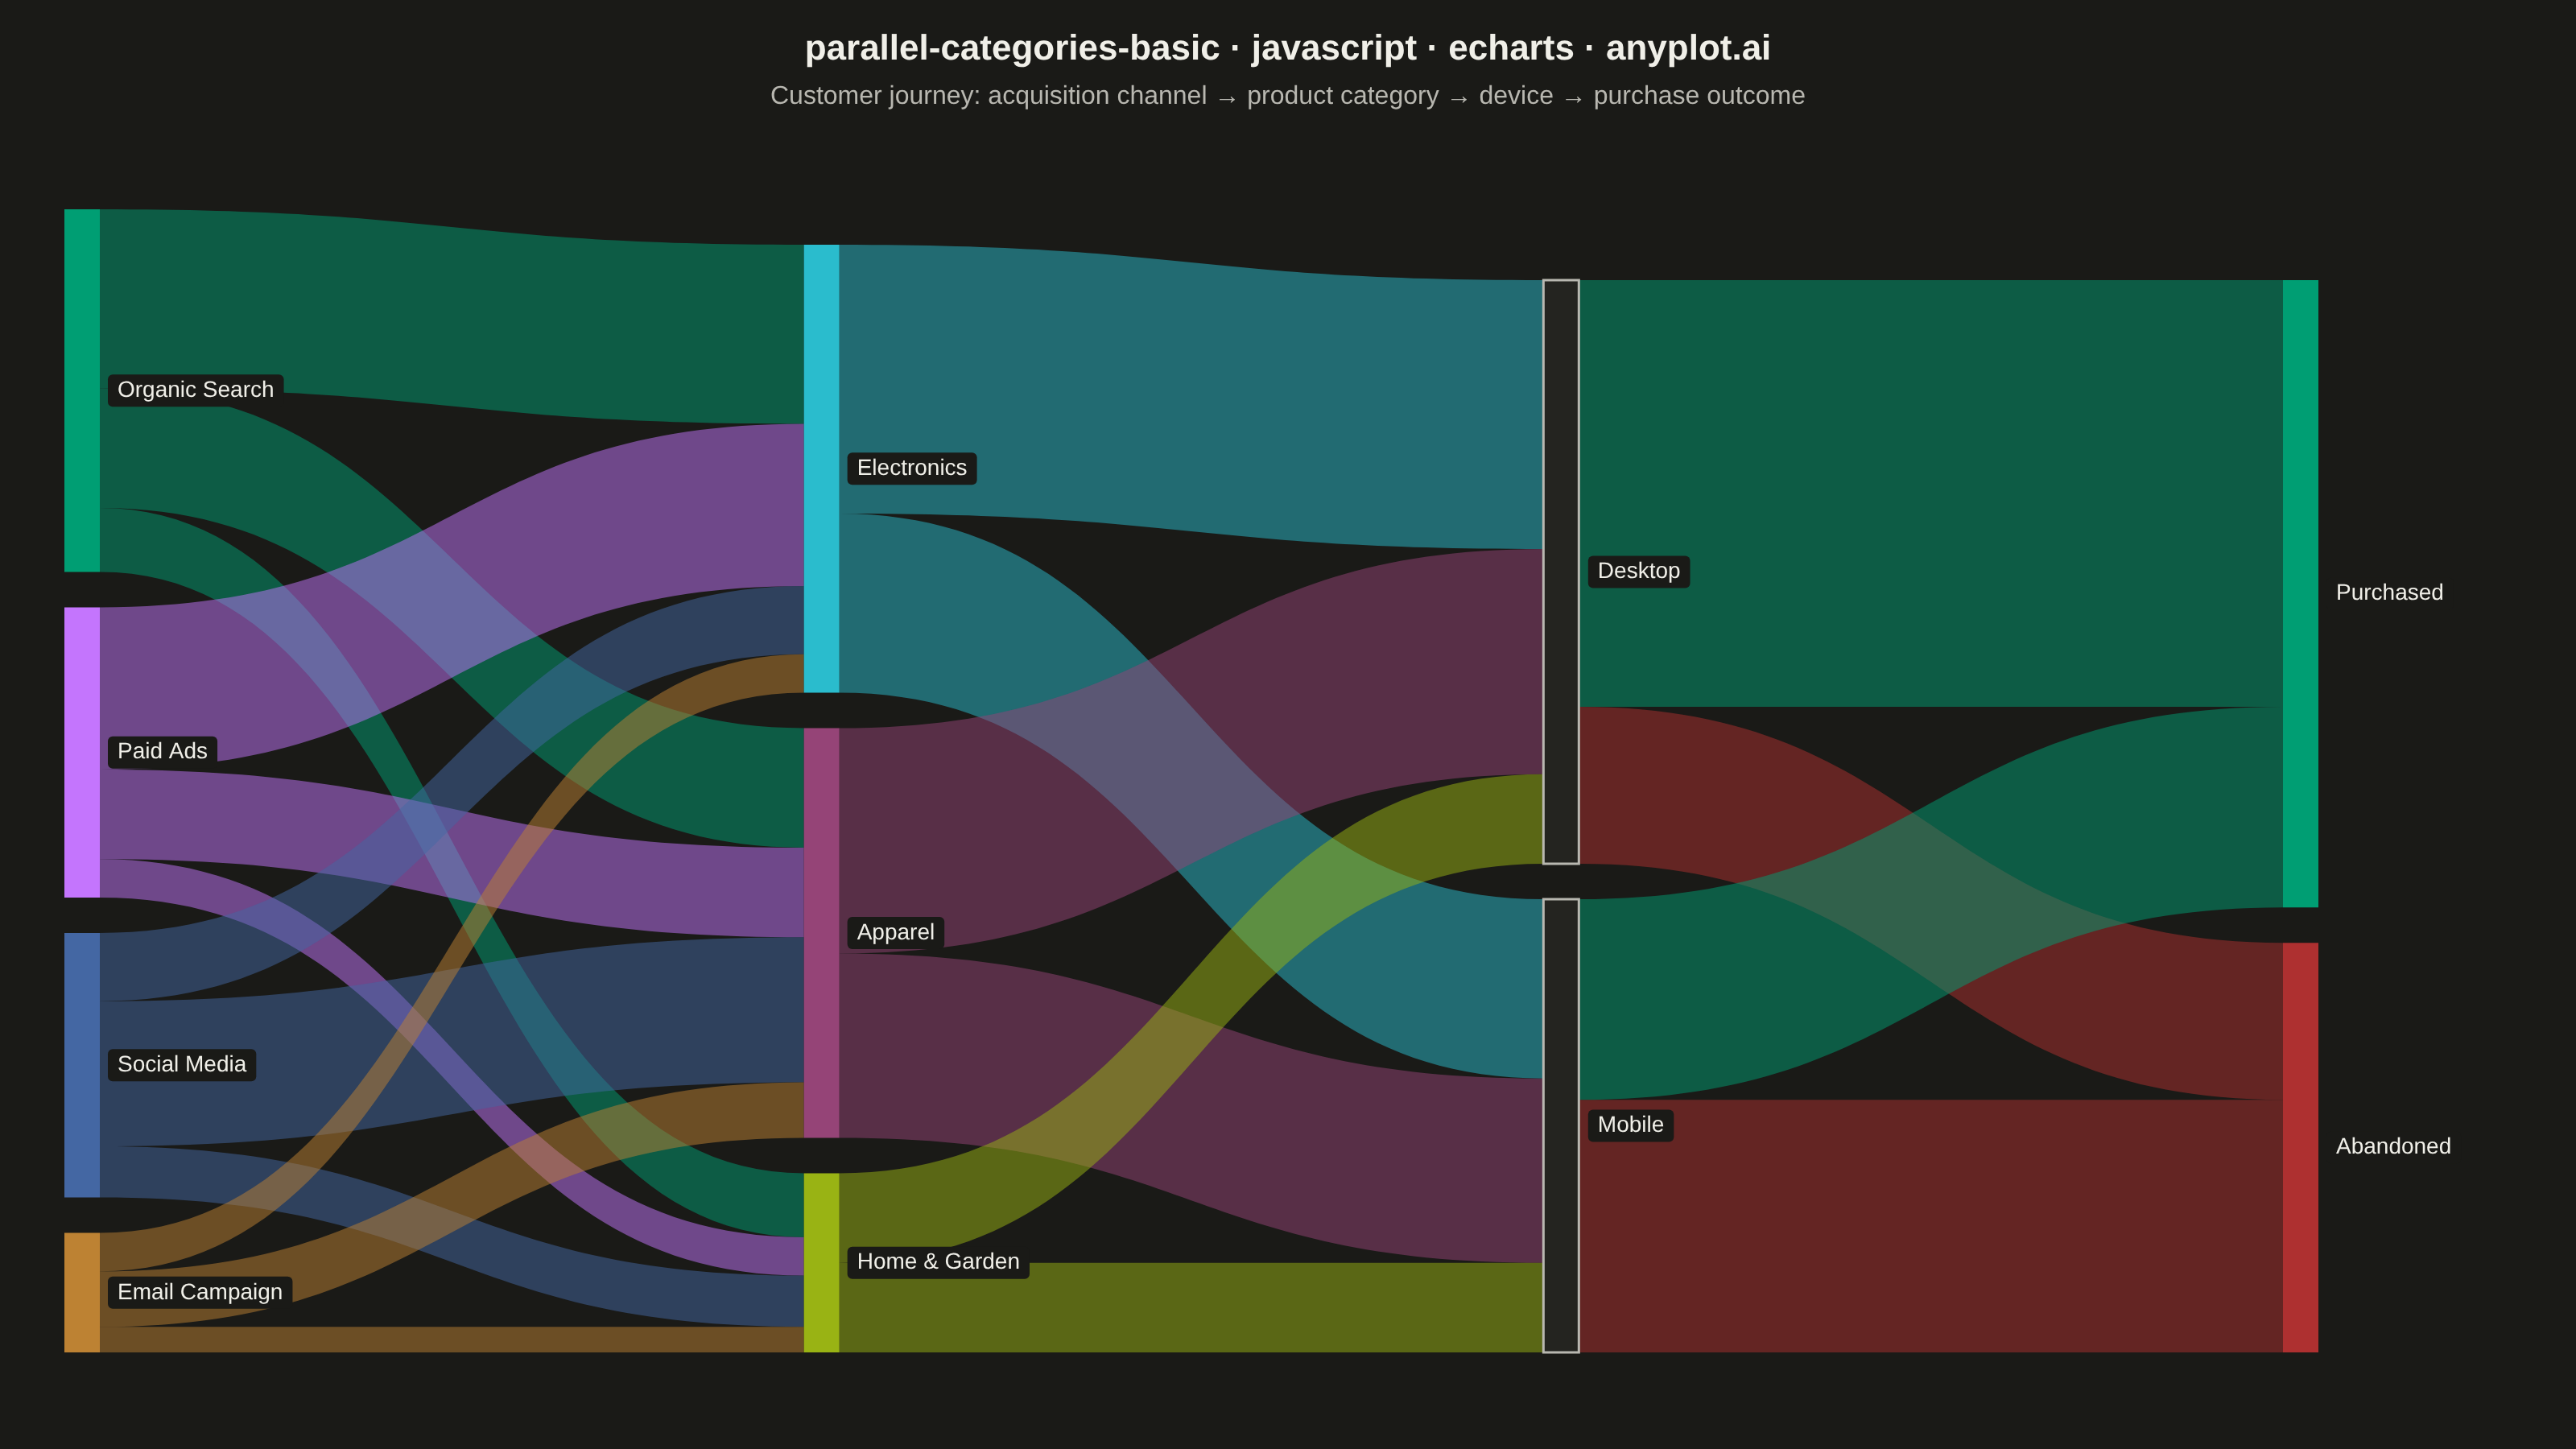
A parallel categories plot visualizes categorical data across multiple dimensions, with vertical axes representing each categorical variable and ribbons connecting categories to show observation flow. Unlike parallel coordinates (which use lines for numeric data), parallel categories use width-proportional ribbons to show counts or frequencies, making it ideal for understanding how categorical values co-occur and flow across multiple classification dimensions.
// anyplot.ai
// parallel-categories-basic: Basic Parallel Categories Plot
// Library: echarts 6.1.0 | JavaScript 22.23.2
// Quality: 89/100 | Created: 2026-09-05

const t = window.ANYPLOT_TOKENS;

// --- Data (in-memory, deterministic) ----------------------------------------
// Customer journey across four categorical dimensions: acquisition channel ->
// product category -> device type -> purchase outcome. ECharts has no
// dedicated "parallel categories" chart (that's a numeric parallel-coordinates
// variant); a Sankey diagram is its native equivalent for width-proportional
// ribbons flowing between categorical stages.
const CHANNELS = ["Organic Search", "Paid Ads", "Social Media", "Email Campaign"];
const CATEGORIES = ["Electronics", "Apparel", "Home & Garden"];
const DEVICES = ["Desktop", "Mobile"];
const OUTCOMES = ["Purchased", "Abandoned"];

// channel -> category visit counts
const channelToCategory = [
  ["Organic Search", "Electronics", 420],
  ["Organic Search", "Apparel", 280],
  ["Organic Search", "Home & Garden", 150],
  ["Paid Ads", "Electronics", 380],
  ["Paid Ads", "Apparel", 210],
  ["Paid Ads", "Home & Garden", 90],
  ["Social Media", "Electronics", 160],
  ["Social Media", "Apparel", 340],
  ["Social Media", "Home & Garden", 120],
  ["Email Campaign", "Electronics", 90],
  ["Email Campaign", "Apparel", 130],
  ["Email Campaign", "Home & Garden", 60],
];

// category -> device counts (each category's flow conserved into Desktop/Mobile)
const categoryToDevice = [
  ["Electronics", "Desktop", 630],
  ["Electronics", "Mobile", 420],
  ["Apparel", "Desktop", 528],
  ["Apparel", "Mobile", 432],
  ["Home & Garden", "Desktop", 210],
  ["Home & Garden", "Mobile", 210],
];

// device -> outcome counts (Desktop converts noticeably better than Mobile)
const deviceToOutcome = [
  ["Desktop", "Purchased", 1000],
  ["Desktop", "Abandoned", 368],
  ["Mobile", "Purchased", 470],
  ["Mobile", "Abandoned", 592],
];

// Color by first dimension (source channel) and last dimension (target
// outcome). Category nodes now carry their own semantic hue (fits the
// domain: Electronics -> cyan/tech, Home & Garden -> lime/growth, Apparel ->
// rose) so the middle of the flow keeps visual hierarchy instead of going
// fully neutral; only the small Desktop/Mobile waypoint stays neutral.
const channelColor = {
  "Organic Search": t.palette[0],
  "Paid Ads": t.palette[1],
  "Social Media": t.palette[2],
  "Email Campaign": t.palette[3],
};
const categoryColor = {
  Electronics: t.palette[5],
  "Home & Garden": t.palette[7],
  Apparel: t.palette[6],
};
const outcomeColor = { Purchased: t.palette[0], Abandoned: t.palette[4] };

const nodes = [
  ...CHANNELS.map((name) => ({
    name,
    itemStyle: { color: channelColor[name] },
  })),
  ...CATEGORIES.map((name) => ({
    name,
    itemStyle: { color: categoryColor[name] },
  })),
  ...DEVICES.map((name) => ({
    name,
    itemStyle: {
      color: t.elevatedBg,
      borderColor: t.inkSoft,
      borderWidth: 1.5,
    },
  })),
  ...OUTCOMES.map((name) => ({
    name,
    itemStyle: { color: outcomeColor[name] },
  })),
];

const links = [
  ...channelToCategory.map(([source, target, value]) => ({
    source,
    target,
    value,
    lineStyle: { color: channelColor[source], opacity: 0.5, curveness: 0.5 },
  })),
  ...categoryToDevice.map(([source, target, value]) => ({
    source,
    target,
    value,
    lineStyle: { color: categoryColor[source], opacity: 0.5, curveness: 0.5 },
  })),
  ...deviceToOutcome.map(([source, target, value]) => ({
    source,
    target,
    value,
    lineStyle: { color: outcomeColor[target], opacity: 0.5, curveness: 0.5 },
  })),
];

// --- Init --------------------------------------------------------------------
const chart = echarts.init(document.getElementById("container"));

// --- Option -------------------------------------------------------------------
chart.setOption({
  animation: false,
  backgroundColor: "transparent",
  title: {
    text: "parallel-categories-basic · javascript · echarts · anyplot.ai",
    subtext:
      "Customer journey: acquisition channel → product category → device → purchase outcome",
    left: "center",
    textStyle: { color: t.ink, fontSize: 22, fontWeight: 600 },
    subtextStyle: { color: t.inkSoft, fontSize: 16 },
  },
  tooltip: { trigger: "item" },
  series: [
    {
      type: "sankey",
      left: 40,
      right: 160,
      top: 130,
      bottom: 60,
      nodeWidth: 22,
      nodeGap: 22,
      nodeAlign: "justify",
      // Raised from the default 32: more Gauss-Seidel relaxation passes let
      // ECharts' own node-ordering algorithm converge further toward
      // fewer ribbon crossings.
      layoutIterations: 100,
      orient: "horizontal",
      draggable: false,
      emphasis: { focus: "adjacency" },
      label: {
        color: t.ink,
        fontSize: 14,
        fontWeight: 500,
        backgroundColor: t.pageBg,
        padding: [3, 6],
        borderRadius: 3,
      },
      data: nodes,
      links,
    },
  ],
});
Runnable source as JSON, for any HTTP client: https://api.anyplot.ai/specs/parallel-categories-basic/echarts/code. Any spec id and library id listed in llms-full.txt fit the same URL shape; every URL below is complete and callable.
{
  "spec_id": "parallel-categories-basic",
  "language": "javascript",
  "library": "echarts",
  "page": "https://anyplot.ai/parallel-categories-basic/javascript/echarts",
  "hub": "https://anyplot.ai/parallel-categories-basic",
  "code_json": "https://api.anyplot.ai/specs/parallel-categories-basic/echarts/code",
  "spec_json": "https://api.anyplot.ai/specs/parallel-categories-basic",
  "render_light_png": "https://storage.googleapis.com/anyplot-images/plots/parallel-categories-basic/javascript/echarts/plot-light.png",
  "render_dark_png": "https://storage.googleapis.com/anyplot-images/plots/parallel-categories-basic/javascript/echarts/plot-dark.png",
  "interactive_light_html": "https://storage.googleapis.com/anyplot-images/plots/parallel-categories-basic/javascript/echarts/plot-light.html",
  "interactive_dark_html": "https://storage.googleapis.com/anyplot-images/plots/parallel-categories-basic/javascript/echarts/plot-dark.html",
  "quality_score": 89.0,
  "license": "MIT",
  "guide": "https://anyplot.ai/llms.txt"
}
Part of Basic Parallel Categories Plot on anyplot.ai.