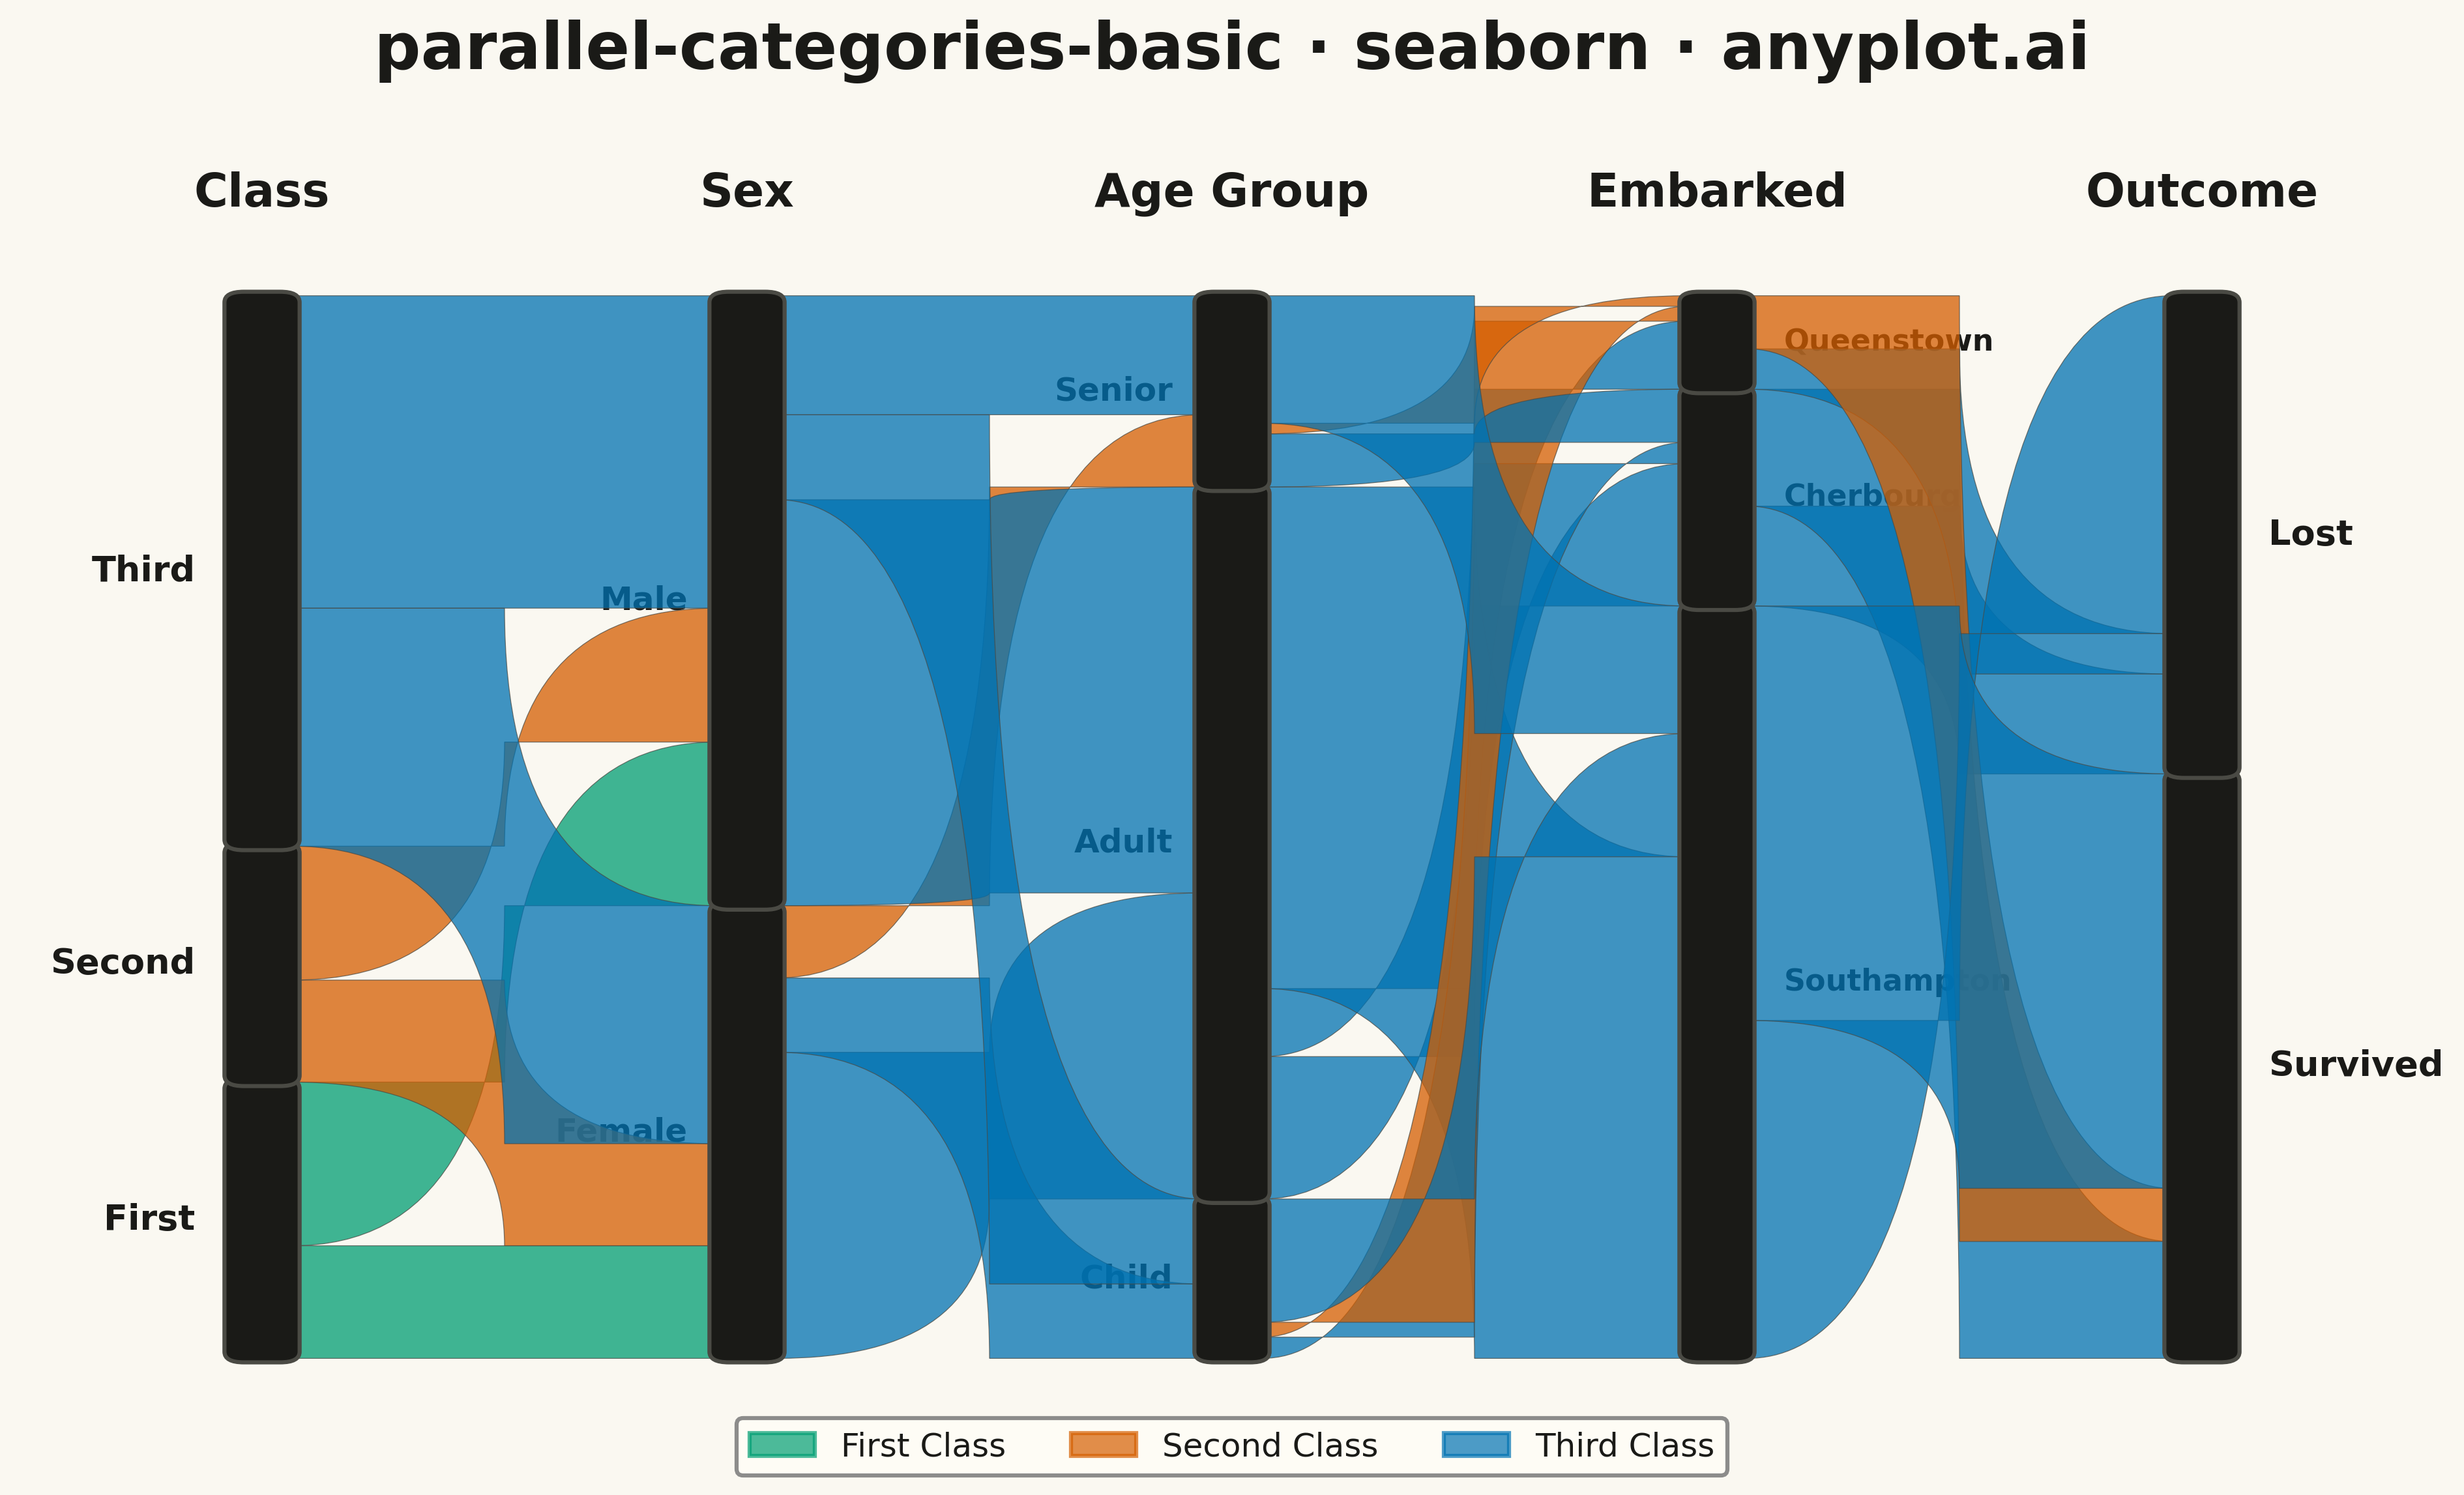
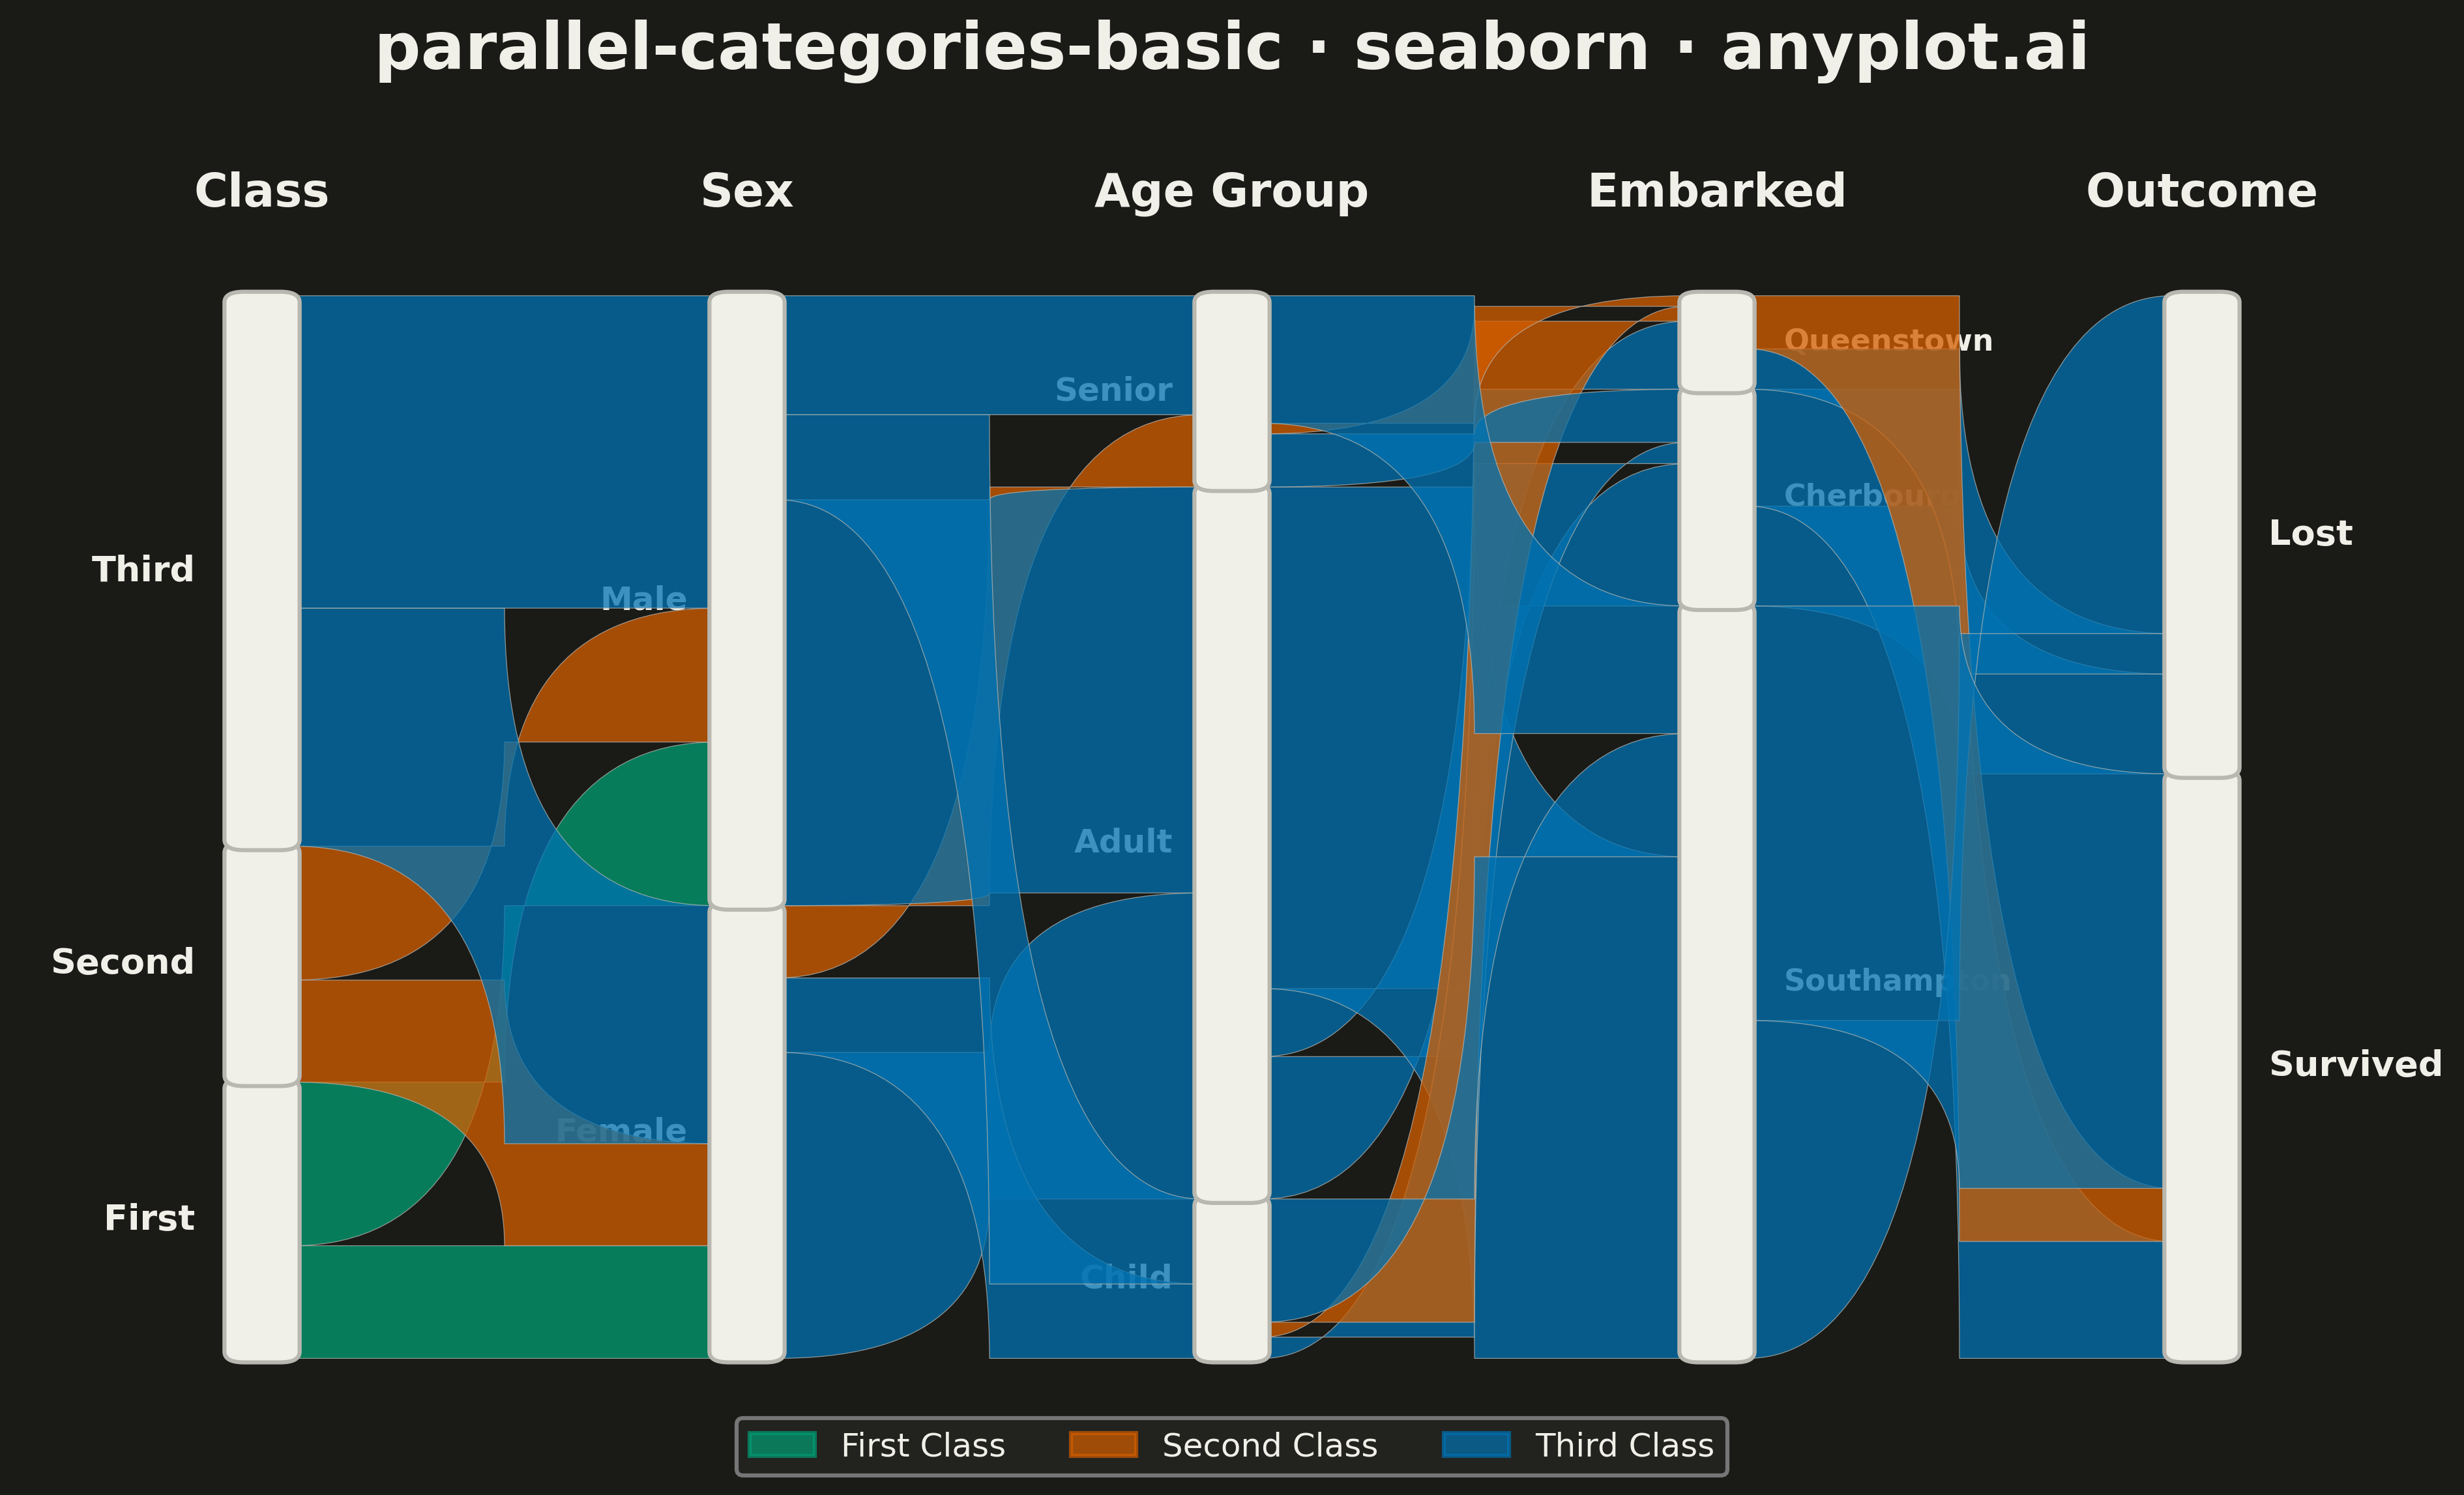
A parallel categories plot visualizes categorical data across multiple dimensions, with vertical axes representing each categorical variable and ribbons connecting categories to show observation flow. Unlike parallel coordinates (which use lines for numeric data), parallel categories use width-proportional ribbons to show counts or frequencies, making it ideal for understanding how categorical values co-occur and flow across multiple classification dimensions.
""" anyplot.ai
parallel-categories-basic: Basic Parallel Categories Plot
Library: seaborn 0.13.2 | Python 3.13.13
Quality: 63/100 | Updated: 2026-05-13
"""

import matplotlib.patches as mpatches
import matplotlib.pyplot as plt
import numpy as np
import pandas as pd
import seaborn as sns
from matplotlib.path import Path


# Set seaborn style for consistent aesthetics
sns.set_style("whitegrid")
sns.set_context("talk", font_scale=1.2)

# Use seaborn's colorblind-safe palette for accessibility
class_palette = sns.color_palette("colorblind", 3)
class_colors = {"First": class_palette[0], "Second": class_palette[1], "Third": class_palette[2]}

# Data - Titanic-style dataset with categorical dimensions
np.random.seed(42)

n_samples = 500
data = {
    "Class": np.random.choice(["First", "Second", "Third"], n_samples, p=[0.25, 0.25, 0.50]),
    "Sex": np.random.choice(["Male", "Female"], n_samples, p=[0.55, 0.45]),
    "Age Group": np.random.choice(["Child", "Adult", "Senior"], n_samples, p=[0.15, 0.70, 0.15]),
    "Embarked": np.random.choice(["Southampton", "Cherbourg", "Queenstown"], n_samples, p=[0.70, 0.20, 0.10]),
}

# Create survival based on realistic patterns
survival_prob = np.zeros(n_samples)
for i in range(n_samples):
    p = 0.3
    if data["Class"][i] == "First":
        p += 0.35
    elif data["Class"][i] == "Second":
        p += 0.15
    if data["Sex"][i] == "Female":
        p += 0.25
    if data["Age Group"][i] == "Child":
        p += 0.15
    survival_prob[i] = min(p, 0.95)

data["Outcome"] = np.where(np.random.random(n_samples) < survival_prob, "Survived", "Lost")

df = pd.DataFrame(data)

# Aggregate data for parallel categories
dimensions = ["Class", "Sex", "Age Group", "Embarked", "Outcome"]
dim_orders = {
    "Class": ["First", "Second", "Third"],
    "Sex": ["Female", "Male"],
    "Age Group": ["Child", "Adult", "Senior"],
    "Embarked": ["Southampton", "Cherbourg", "Queenstown"],
    "Outcome": ["Survived", "Lost"],
}

# Create figure - removed inset to reduce crowding
fig, ax = plt.subplots(figsize=(16, 9))

# Calculate positions for each dimension
n_dims = len(dimensions)
x_positions = np.linspace(0.10, 0.90, n_dims)
dim_width = 0.025

# Track category positions and heights
category_positions = {}

# Draw category bars and labels
for dim_idx, dim in enumerate(dimensions):
    x_pos = x_positions[dim_idx]
    categories = dim_orders[dim]
    counts = df[dim].value_counts()
    total = counts.sum()
    heights = {cat: counts.get(cat, 0) / total for cat in categories}

    y_start, y_end = 0.08, 0.88
    y_range = y_end - y_start
    current_y = y_start

    for cat in categories:
        height = heights[cat] * y_range
        category_positions[(dim, cat)] = (x_pos, current_y, height)

        # Draw category rectangle
        rect = mpatches.FancyBboxPatch(
            (x_pos - dim_width / 2, current_y),
            dim_width,
            height,
            boxstyle="round,pad=0.003,rounding_size=0.008",
            facecolor="#3a3a3a",
            edgecolor="white",
            linewidth=1.5,
            zorder=10,
        )
        ax.add_patch(rect)

        # Place all category labels outside bars for better readability
        label_y = current_y + height / 2
        if dim_idx == 0:
            # First dimension: labels on left
            ax.text(
                x_pos - dim_width / 2 - 0.015, label_y, cat, ha="right", va="center", fontsize=13, fontweight="bold"
            )
        elif dim_idx == n_dims - 1:
            # Last dimension: labels on right
            ax.text(x_pos + dim_width / 2 + 0.015, label_y, cat, ha="left", va="center", fontsize=13, fontweight="bold")
        elif dim_idx == n_dims - 2:
            # Embarked dimension: labels on right to avoid ribbon overlap
            ax.text(x_pos + dim_width / 2 + 0.015, label_y, cat, ha="left", va="center", fontsize=11, fontweight="bold")
        else:
            # Other middle dimensions: labels on left
            ax.text(
                x_pos - dim_width / 2 - 0.012, label_y, cat, ha="right", va="center", fontsize=12, fontweight="bold"
            )

        current_y += height

# Draw ribbons connecting categories
for i in range(n_dims - 1):
    dim1, dim2 = dimensions[i], dimensions[i + 1]
    x1, x2 = x_positions[i], x_positions[i + 1]
    flow_counts = df.groupby([dim1, dim2]).size().reset_index(name="count")

    cat1_current = {cat: category_positions[(dim1, cat)][1] for cat in dim_orders[dim1]}
    cat2_current = {cat: category_positions[(dim2, cat)][1] for cat in dim_orders[dim2]}

    total_count = len(df)
    y_range = 0.80

    for _, row in flow_counts.iterrows():
        cat1, cat2, count = row[dim1], row[dim2], row["count"]
        ribbon_height = (count / total_count) * y_range

        y1_bottom = cat1_current[cat1]
        y2_bottom = cat2_current[cat2]
        y1_top = y1_bottom + ribbon_height
        y2_top = y2_bottom + ribbon_height

        cat1_current[cat1] = y1_top
        cat2_current[cat2] = y2_top

        x_mid = (x1 + x2) / 2

        verts = [
            (x1 + dim_width / 2, y1_bottom),
            (x_mid, y1_bottom),
            (x_mid, y2_bottom),
            (x2 - dim_width / 2, y2_bottom),
            (x2 - dim_width / 2, y2_top),
            (x_mid, y2_top),
            (x_mid, y1_top),
            (x1 + dim_width / 2, y1_top),
            (x1 + dim_width / 2, y1_bottom),
        ]

        codes = [
            Path.MOVETO,
            Path.CURVE3,
            Path.CURVE3,
            Path.LINETO,
            Path.LINETO,
            Path.CURVE3,
            Path.CURVE3,
            Path.LINETO,
            Path.CLOSEPOLY,
        ]

        path = Path(verts, codes)

        # Color by Class category
        first_cat = df.loc[(df[dim1] == cat1) & (df[dim2] == cat2), "Class"].mode()
        color = class_colors.get(first_cat.iloc[0], class_palette[0]) if len(first_cat) > 0 else class_palette[0]

        patch = mpatches.PathPatch(path, facecolor=color, edgecolor="white", linewidth=0.3, alpha=0.55, zorder=5)
        ax.add_patch(patch)

# Add dimension labels at the top
for dim_idx, dim in enumerate(dimensions):
    ax.text(
        x_positions[dim_idx],
        0.94,
        dim,
        ha="center",
        va="bottom",
        fontsize=17,
        fontweight="bold",
        color=class_palette[0],
    )

# Legend for Class colors
legend_patches = [
    mpatches.Patch(color=class_colors["First"], alpha=0.7, label="First Class"),
    mpatches.Patch(color=class_colors["Second"], alpha=0.7, label="Second Class"),
    mpatches.Patch(color=class_colors["Third"], alpha=0.7, label="Third Class"),
]
ax.legend(
    handles=legend_patches,
    loc="lower center",
    fontsize=12,
    framealpha=0.9,
    edgecolor="gray",
    ncol=3,
    bbox_to_anchor=(0.5, -0.02),
)

# Style adjustments
ax.set_xlim(0, 1)
ax.set_ylim(0, 1.02)
ax.set_aspect("auto")
ax.axis("off")

# Title
ax.set_title("parallel-categories-basic · seaborn · pyplots.ai", fontsize=24, fontweight="bold", pad=15)

plt.savefig("plot.png", dpi=300, bbox_inches="tight", facecolor="white")
Runnable source as JSON, for any HTTP client: https://api.anyplot.ai/specs/parallel-categories-basic/seaborn/code. Any spec id and library id listed in llms-full.txt fit the same URL shape; every URL below is complete and callable.
{
  "spec_id": "parallel-categories-basic",
  "language": "python",
  "library": "seaborn",
  "page": "https://anyplot.ai/parallel-categories-basic/python/seaborn",
  "hub": "https://anyplot.ai/parallel-categories-basic",
  "code_json": "https://api.anyplot.ai/specs/parallel-categories-basic/seaborn/code",
  "spec_json": "https://api.anyplot.ai/specs/parallel-categories-basic",
  "render_light_png": "https://storage.googleapis.com/anyplot-images/plots/parallel-categories-basic/python/seaborn/plot-light.png",
  "render_dark_png": "https://storage.googleapis.com/anyplot-images/plots/parallel-categories-basic/python/seaborn/plot-dark.png",
  "quality_score": 63.0,
  "license": "MIT",
  "guide": "https://anyplot.ai/llms.txt"
}
Part of Basic Parallel Categories Plot on anyplot.ai.