The same plot in 14 other libraries — Python: Altair, Bokeh, lets-plot, Matplotlib, Plotly, plotnine, Pygal, Seaborn; R: ggplot2; JavaScript: Chart.js, D3.js, Apache ECharts, Highcharts, MUI X Charts. Compare all 15 side by side: Basic Parallel Categories Plot in Python, R, Julia and JavaScript.
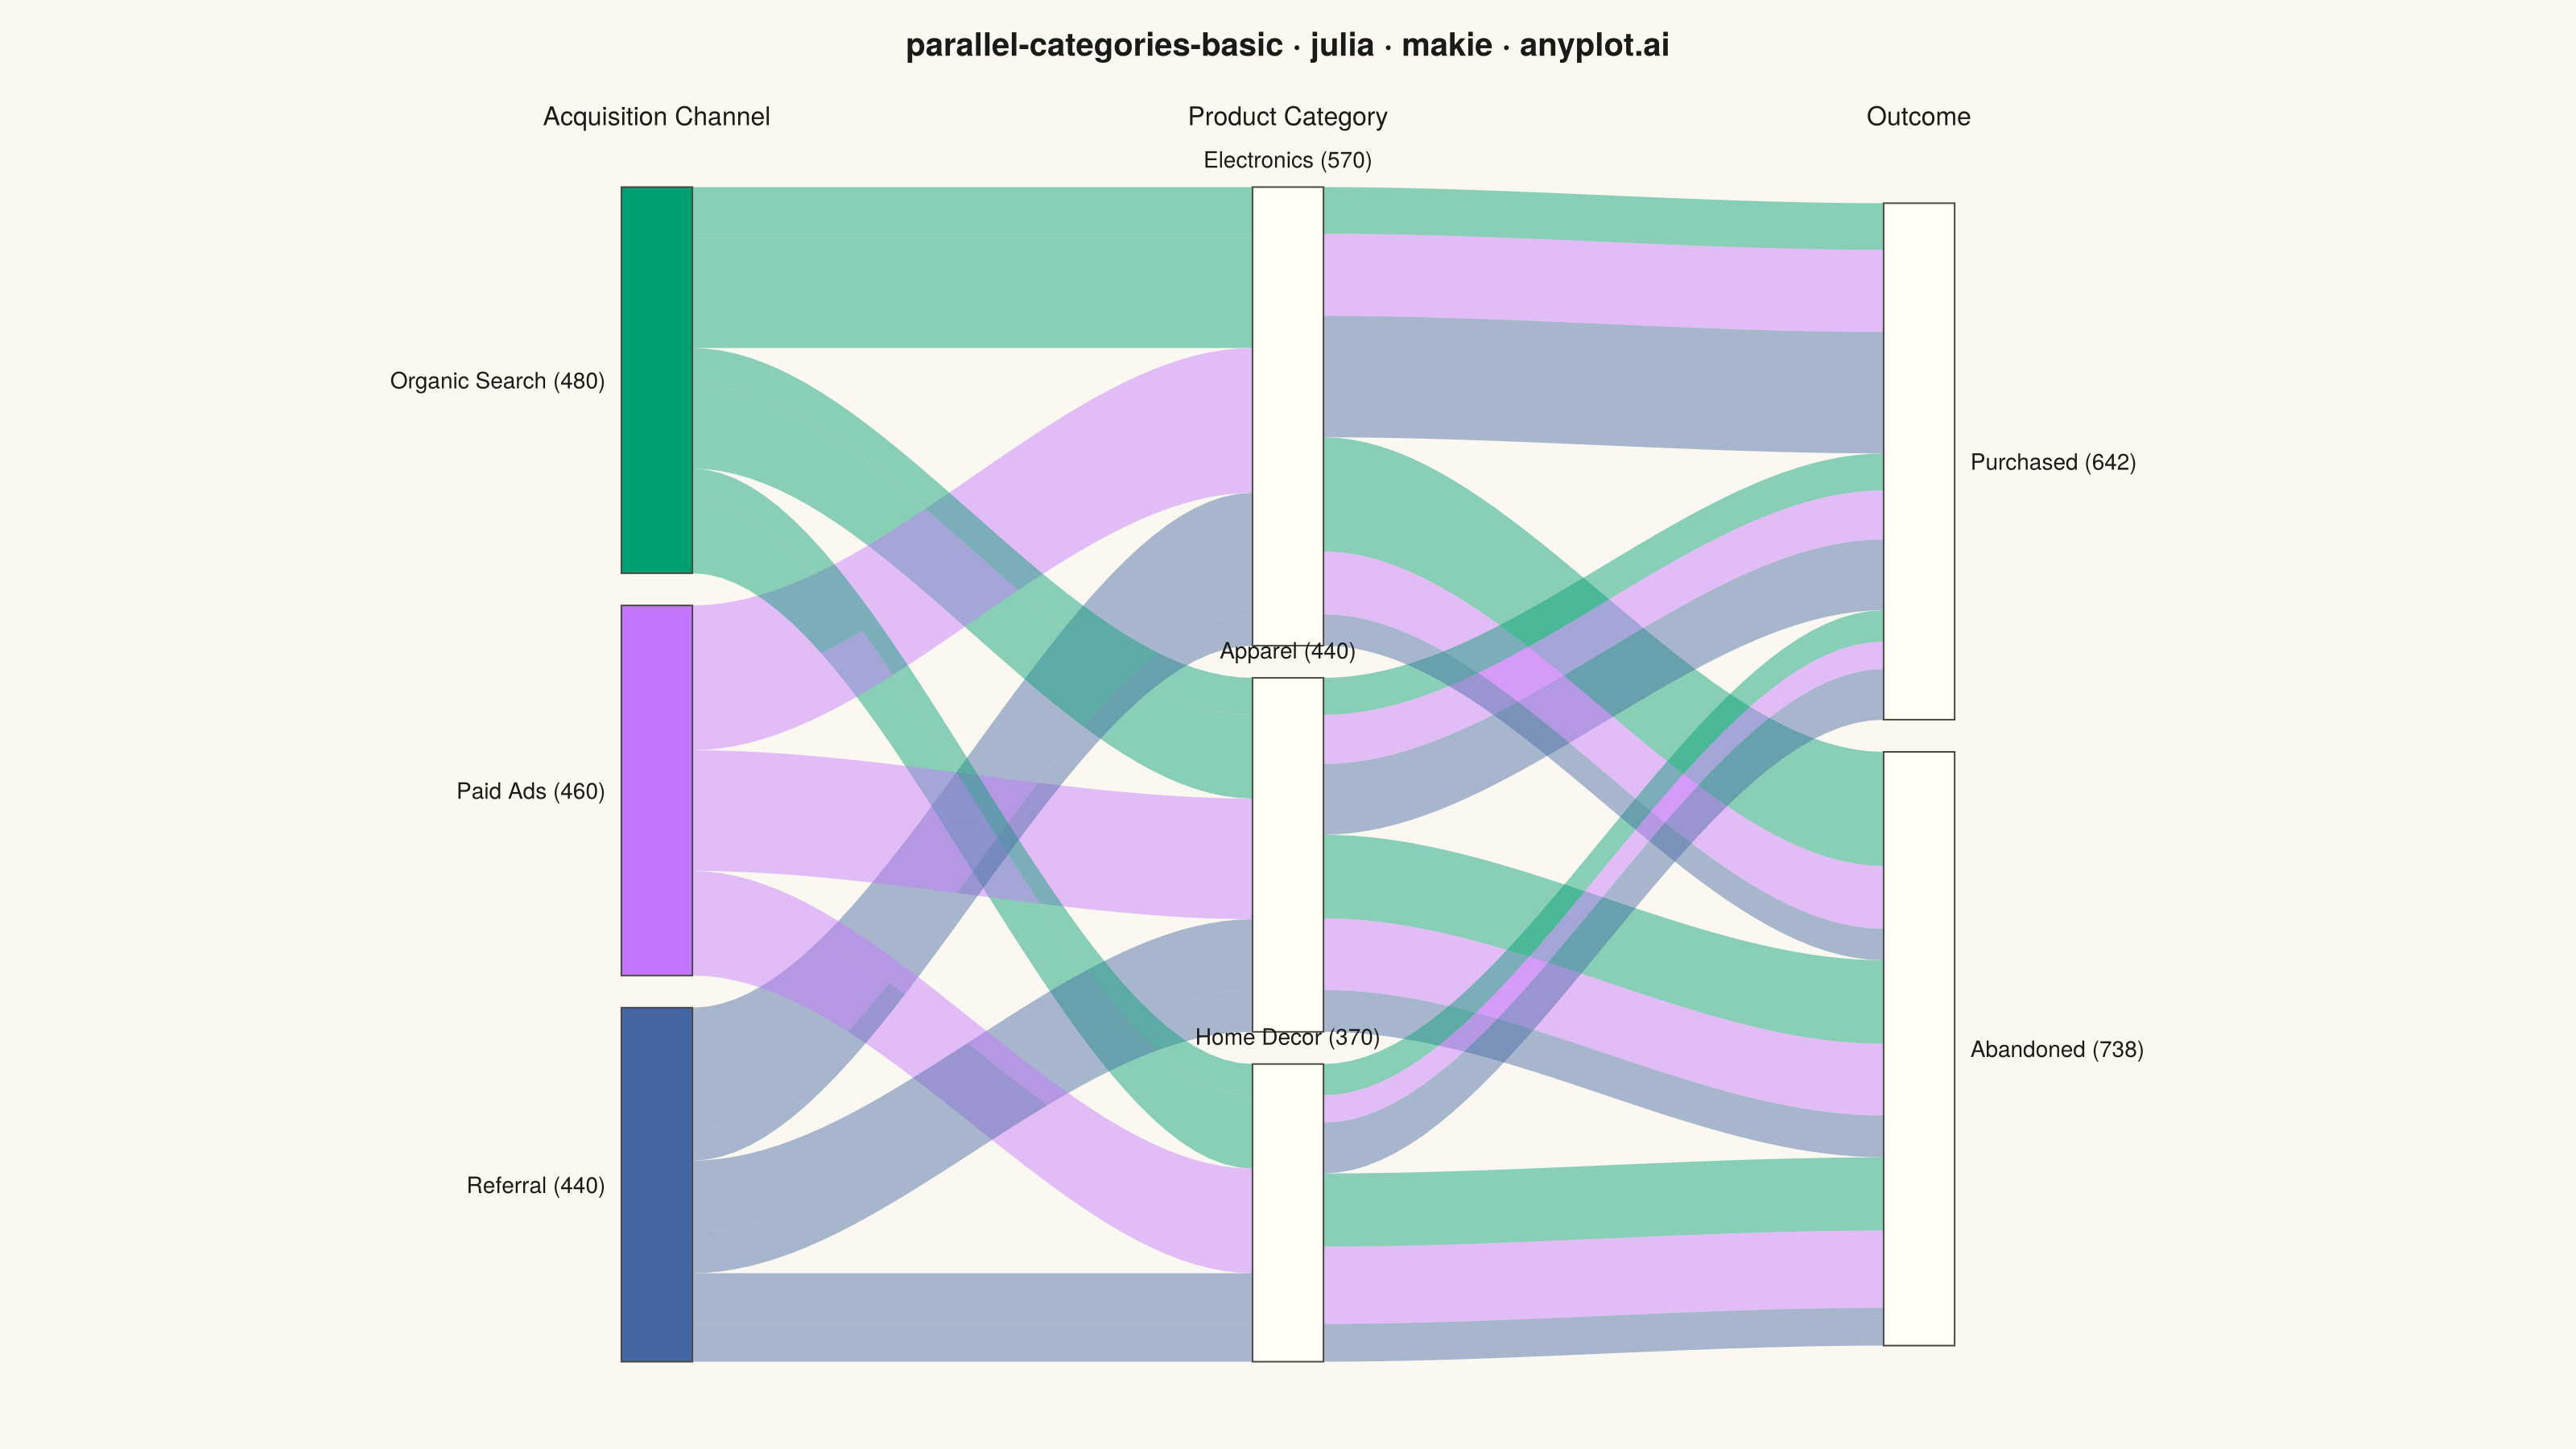
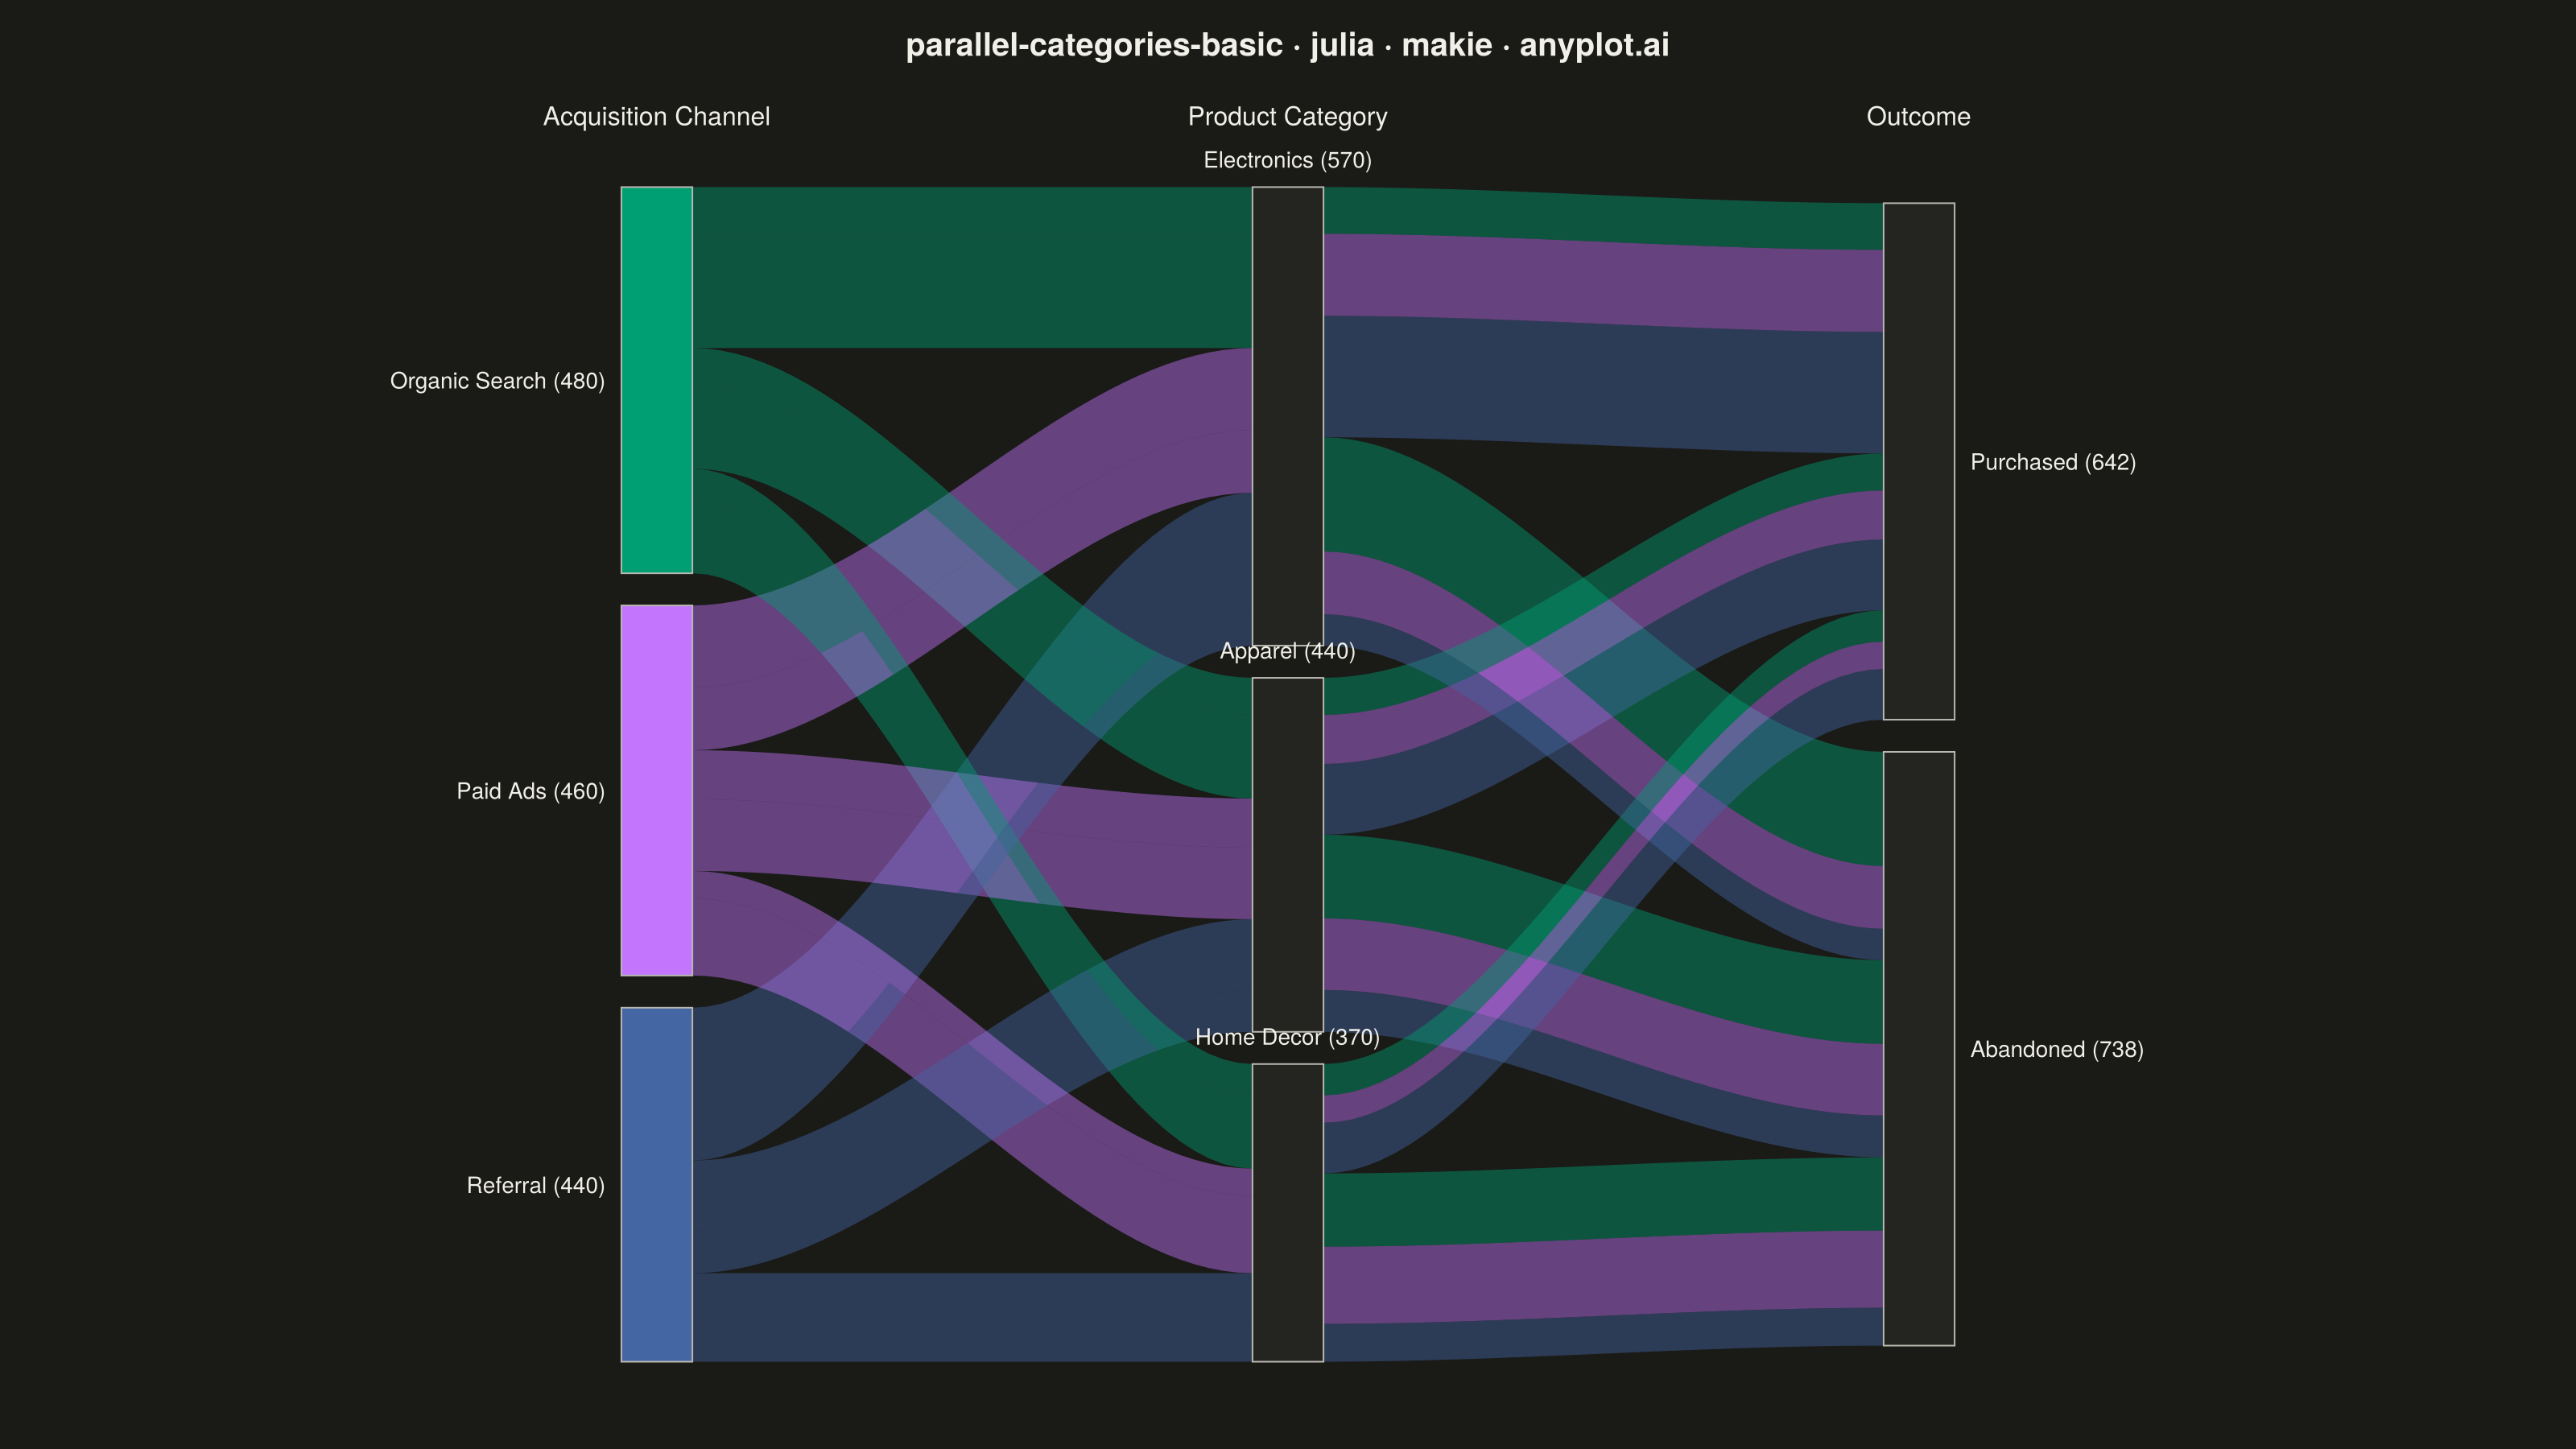
A parallel categories plot visualizes categorical data across multiple dimensions, with vertical axes representing each categorical variable and ribbons connecting categories to show observation flow. Unlike parallel coordinates (which use lines for numeric data), parallel categories use width-proportional ribbons to show counts or frequencies, making it ideal for understanding how categorical values co-occur and flow across multiple classification dimensions.
# anyplot.ai
# parallel-categories-basic: Basic Parallel Categories Plot
# Library: makie 0.21.9 | Julia 1.11.9
# Quality: 85/100 | Created: 2026-09-05

using CairoMakie
using Colors

# --- Theme tokens ------------------------------------------------------------
const THEME = get(ENV, "ANYPLOT_THEME", "light")
const PAGE_BG = THEME == "light" ? colorant"#FAF8F1" : colorant"#1A1A17"
const ELEVATED_BG = THEME == "light" ? colorant"#FFFDF6" : colorant"#242420"
const INK = THEME == "light" ? colorant"#1A1A17" : colorant"#F0EFE8"
const INK_SOFT = THEME == "light" ? colorant"#4A4A44" : colorant"#B8B7B0"
const IMPRINT_PALETTE = [
    colorant"#009E73", colorant"#C475FD", colorant"#4467A3", colorant"#BD8233",
    colorant"#AE3030", colorant"#2ABCCD", colorant"#954477", colorant"#99B314",
]

# --- Data: customer journey from acquisition channel to product to outcome --
channels = ["Organic Search", "Paid Ads", "Referral"]
products = ["Electronics", "Apparel", "Home Decor"]
outcomes = ["Purchased", "Abandoned"]

# (channel_idx, product_idx, outcome_idx, session_count)
combos = [
    (1, 1, 1, 58), (1, 1, 2, 142),
    (1, 2, 1, 46), (1, 2, 2, 104),
    (1, 3, 1, 39), (1, 3, 2, 91),
    (2, 1, 1, 102), (2, 1, 2, 78),
    (2, 2, 1, 61), (2, 2, 2, 89),
    (2, 3, 1, 34), (2, 3, 2, 96),
    (3, 1, 1, 151), (3, 1, 2, 39),
    (3, 2, 1, 88), (3, 2, 2, 52),
    (3, 3, 1, 63), (3, 3, 2, 47),
]

channel_totals = [sum(c[4] for c in combos if c[1] == i) for i in 1:length(channels)]
product_totals = [sum(c[4] for c in combos if c[2] == i) for i in 1:length(products)]
outcome_totals = [sum(c[4] for c in combos if c[3] == i) for i in 1:length(outcomes)]

# --- Layout: stack each dimension's categories top-to-bottom, centered ------
const GAP = 40.0

function node_tops(totals)
    total_height = sum(totals) + GAP * (length(totals) - 1)
    tops = Float64[]
    y = total_height / 2
    for cnt in totals
        push!(tops, y)
        y -= cnt + GAP
    end
    return tops
end

channel_tops = node_tops(channel_totals)
product_tops = node_tops(product_totals)
outcome_tops = node_tops(outcome_totals)

# Stacks the combos touching a node top-to-bottom by `order_key`, so each
# node edge can use an order tailored to the ribbons it feeds. A node's
# rectangle is solid (no internal ribbon path is drawn), so its incoming
# edge (grouped by source category) and outgoing edge (grouped by target
# category) are free to use independent stacking orders — this is what
# keeps same-outcome ribbons contiguous and minimizes crossings, per the
# spec's guidance to order categories to reduce crossings.
function stack_positions(n_categories, dim_idx, tops, order_key)
    offsets = Dict{NTuple{3,Int},Tuple{Float64,Float64}}()
    for ci in 1:n_categories
        cat_combos = sort(filter(c -> c[dim_idx] == ci, combos); by=order_key)
        current_top = tops[ci]
        for c in cat_combos
            y_bottom = current_top - c[4]
            offsets[(c[1], c[2], c[3])] = (current_top, y_bottom)
            current_top = y_bottom
        end
    end
    return offsets
end

# Channel's only edge feeds product nodes -> order by (product, outcome).
channel_pos = stack_positions(length(channels), 1, channel_tops, c -> (c[2], c[3]))
# Product's incoming edge meets the channel edge -> order by (channel, outcome).
product_pos_in = stack_positions(length(products), 2, product_tops, c -> (c[1], c[3]))
# Product's outgoing edge feeds outcome nodes -> order by (outcome, channel),
# so purchased- and abandoned-bound ribbons leave each product as two
# contiguous bands instead of interleaved by channel.
product_pos_out = stack_positions(length(products), 2, product_tops, c -> (c[3], c[1]))
# Outcome's only edge meets the product edge -> order by (product, channel).
outcome_pos = stack_positions(length(outcomes), 3, outcome_tops, c -> (c[2], c[1]))

# --- Figure -------------------------------------------------------------------
fig = Figure(
    resolution = (1600, 900),
    fontsize = 14,
    backgroundcolor = PAGE_BG,
)

const X1, X2, X3 = 0.0, 1.6, 3.2

ax = Axis(
    fig[1, 1];
    title = "parallel-categories-basic · julia · makie · anyplot.ai",
    titlesize = 20,
    titlecolor = INK,
    backgroundcolor = PAGE_BG,
    xgridvisible = false,
    ygridvisible = false,
)
hidespines!(ax)
hidexdecorations!(ax)
hideydecorations!(ax)
xlims!(ax, X1 - 1.6, X3 + 1.6)

# --- Ribbons: smooth bands colored by acquisition channel (source dim) ------
const NODE_HW = 0.09
const N_SAMPLES = 40

smoothstep(t) = t * t * (3 - 2t)

function draw_ribbon!(ax, x_left, x_right, y_top_l, y_bot_l, y_top_r, y_bot_r, color)
    xs = range(x_left, x_right; length=N_SAMPLES)
    t = smoothstep.((xs .- x_left) ./ (x_right - x_left))
    y_top = y_top_l .+ (y_top_r - y_top_l) .* t
    y_bot = y_bot_l .+ (y_bot_r - y_bot_l) .* t
    ribbon_color = RGBAf(color.r, color.g, color.b, 0.45)
    band!(ax, xs, y_bot, y_top; color=ribbon_color)
end

# Draw the widest ribbons first so the remaining crossings — thinner ribbons
# layered on top — stay individually readable instead of disappearing under
# a wide band's translucent fill.
for c in sort(combos; by=x -> -x[4])
    key = (c[1], c[2], c[3])
    channel_color = IMPRINT_PALETTE[c[1]]

    yt_l, yb_l = channel_pos[key]
    yt_r, yb_r = product_pos_in[key]
    draw_ribbon!(ax, X1 + NODE_HW, X2 - NODE_HW, yt_l, yb_l, yt_r, yb_r, channel_color)

    yt_l2, yb_l2 = product_pos_out[key]
    yt_r2, yb_r2 = outcome_pos[key]
    draw_ribbon!(ax, X2 + NODE_HW, X3 - NODE_HW, yt_l2, yb_l2, yt_r2, yb_r2, channel_color)
end

# --- Nodes: rectangles per category, labeled with name + total count -------
function draw_node!(ax, x, y_top, y_bottom, color, label, label_side)
    poly!(
        ax,
        Point2f[
            (x - NODE_HW, y_bottom), (x + NODE_HW, y_bottom),
            (x + NODE_HW, y_top), (x - NODE_HW, y_top),
        ];
        color=color, strokecolor=INK_SOFT, strokewidth=1,
    )
    y_mid = (y_top + y_bottom) / 2
    if label_side == :left
        text!(ax, x - NODE_HW - 0.04, y_mid; text=label, align=(:right, :center),
            color=INK, fontsize=14)
    elseif label_side == :right
        text!(ax, x + NODE_HW + 0.04, y_mid; text=label, align=(:left, :center),
            color=INK, fontsize=14)
    else
        text!(ax, x, y_top + 18; text=label, align=(:center, :bottom),
            color=INK, fontsize=14)
    end
end

for (i, name) in enumerate(channels)
    y_top = channel_tops[i]
    draw_node!(ax, X1, y_top, y_top - channel_totals[i], IMPRINT_PALETTE[i],
        "$(name) ($(channel_totals[i]))", :left)
end

for (i, name) in enumerate(products)
    y_top = product_tops[i]
    draw_node!(ax, X2, y_top, y_top - product_totals[i], ELEVATED_BG,
        "$(name) ($(product_totals[i]))", :top)
end

for (i, name) in enumerate(outcomes)
    y_top = outcome_tops[i]
    draw_node!(ax, X3, y_top, y_top - outcome_totals[i], ELEVATED_BG,
        "$(name) ($(outcome_totals[i]))", :right)
end

# --- Dimension headers --------------------------------------------------------
header_y = maximum([channel_tops[1], product_tops[1], outcome_tops[1]]) + 70
text!(ax, X1, header_y; text="Acquisition Channel", align=(:center, :bottom),
    color=INK, fontsize=16)
text!(ax, X2, header_y; text="Product Category", align=(:center, :bottom),
    color=INK, fontsize=16)
text!(ax, X3, header_y; text="Outcome", align=(:center, :bottom),
    color=INK, fontsize=16)

# --- Save ----------------------------------------------------------------------
save("plot-$(THEME).png", fig; px_per_unit=2)
Runnable source as JSON, for any HTTP client: https://api.anyplot.ai/specs/parallel-categories-basic/makie/code. Any spec id and library id listed in llms-full.txt fit the same URL shape; every URL below is complete and callable.
{
  "spec_id": "parallel-categories-basic",
  "language": "julia",
  "library": "makie",
  "page": "https://anyplot.ai/parallel-categories-basic/julia/makie",
  "hub": "https://anyplot.ai/parallel-categories-basic",
  "code_json": "https://api.anyplot.ai/specs/parallel-categories-basic/makie/code",
  "spec_json": "https://api.anyplot.ai/specs/parallel-categories-basic",
  "render_light_png": "https://storage.googleapis.com/anyplot-images/plots/parallel-categories-basic/julia/makie/plot-light.png",
  "render_dark_png": "https://storage.googleapis.com/anyplot-images/plots/parallel-categories-basic/julia/makie/plot-dark.png",
  "quality_score": 85.0,
  "license": "MIT",
  "guide": "https://anyplot.ai/llms.txt"
}
Part of Basic Parallel Categories Plot on anyplot.ai.