The same plot in 14 other libraries — JavaScript: Chart.js, D3.js, Apache ECharts, Highcharts; Python: Altair, Bokeh, lets-plot, Matplotlib, Plotly, plotnine, Pygal, Seaborn; R: ggplot2; Julia: Makie.jl. Compare all 15 side by side: Basic Parallel Categories Plot in Python, R, Julia and JavaScript.
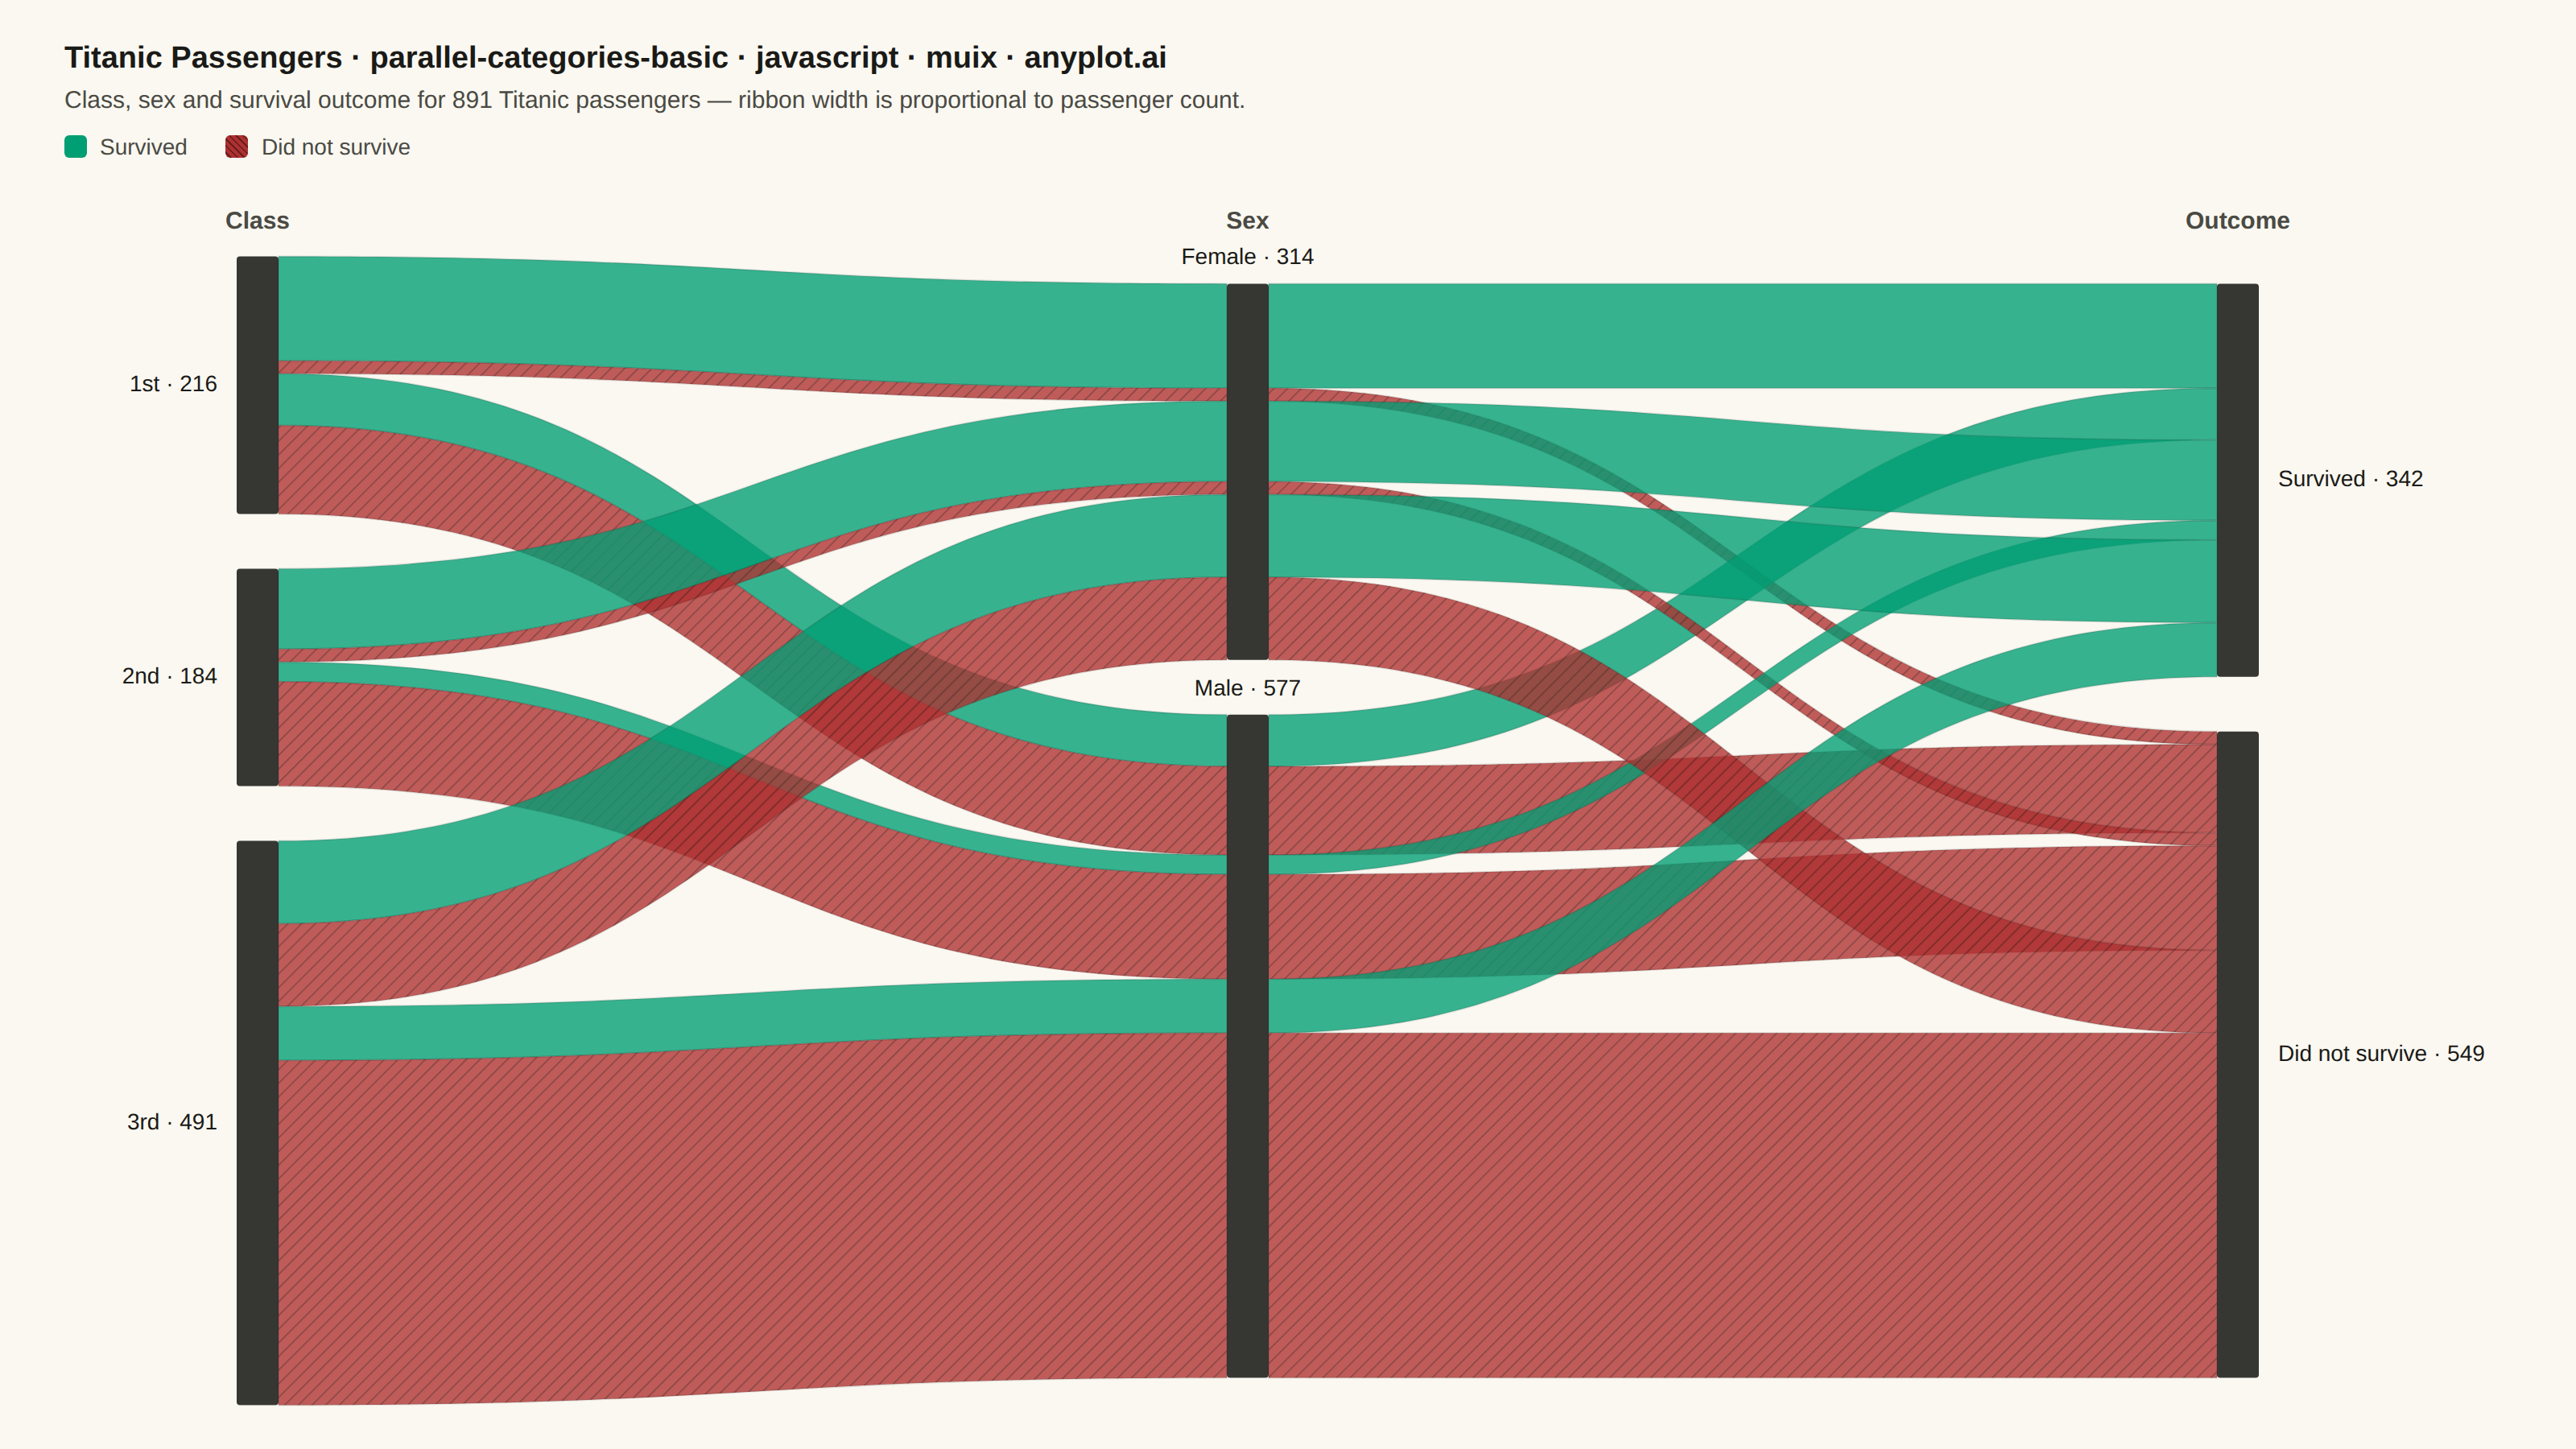
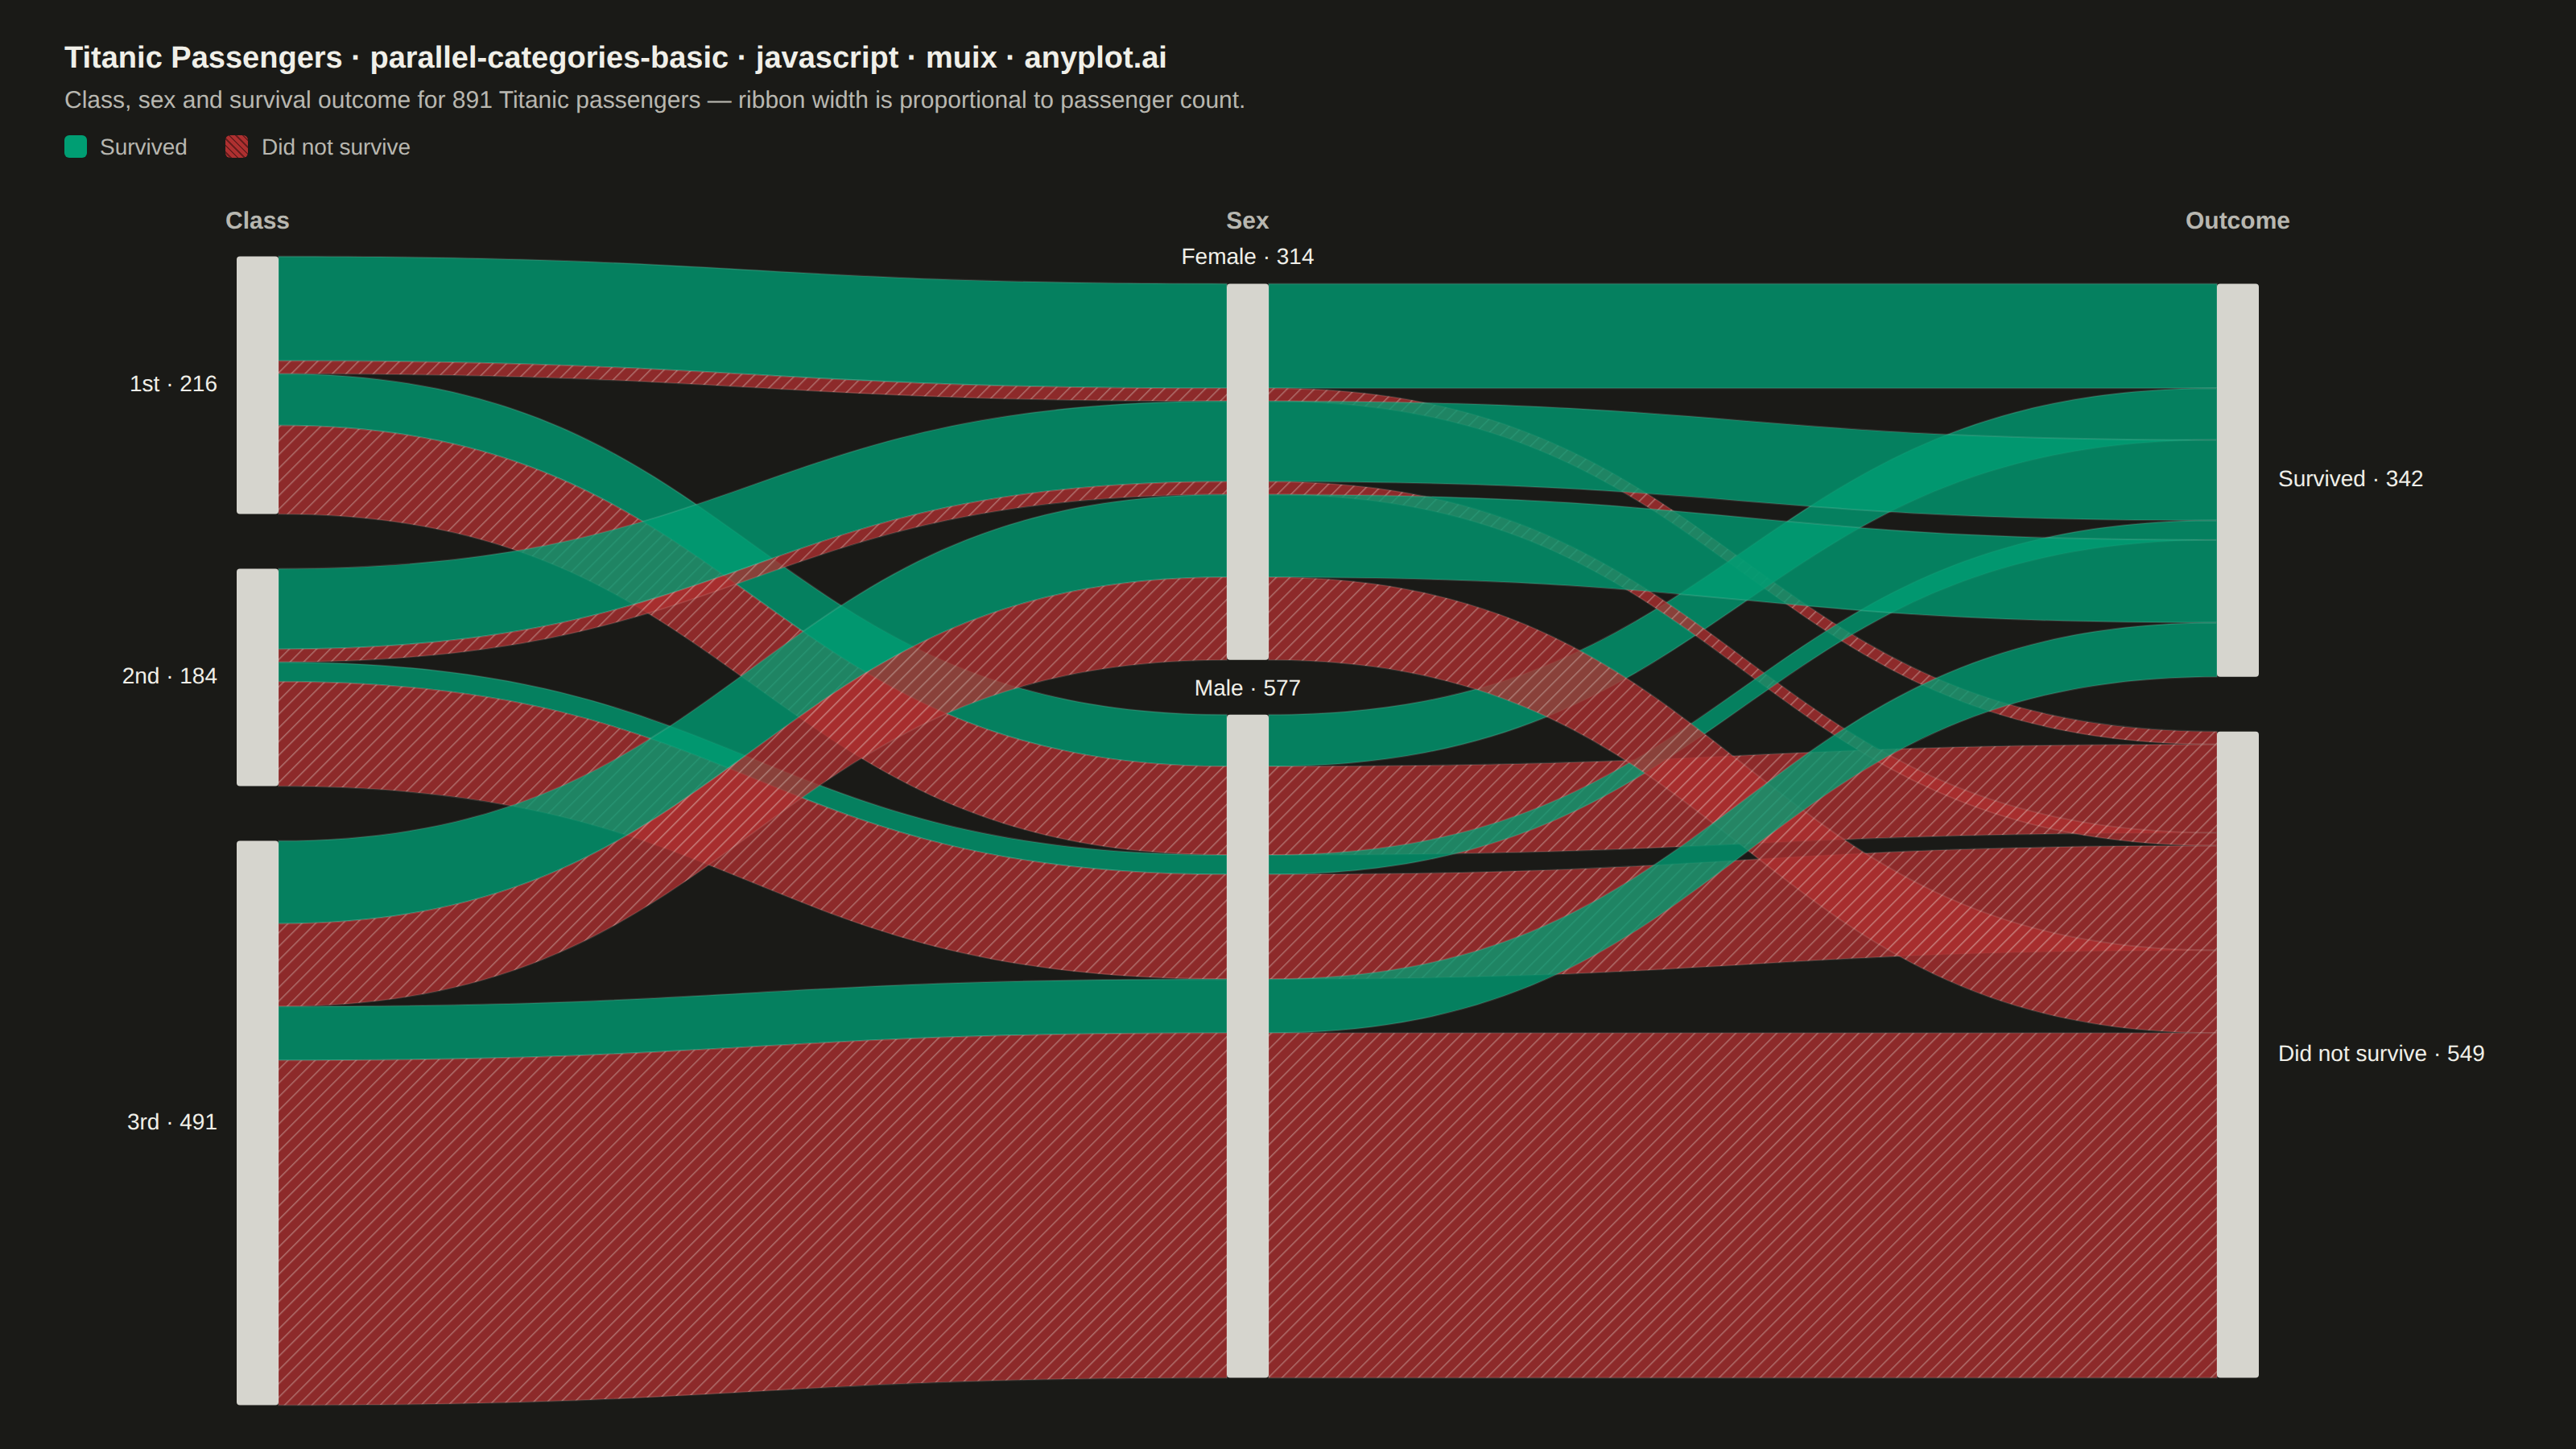
A parallel categories plot visualizes categorical data across multiple dimensions, with vertical axes representing each categorical variable and ribbons connecting categories to show observation flow. Unlike parallel coordinates (which use lines for numeric data), parallel categories use width-proportional ribbons to show counts or frequencies, making it ideal for understanding how categorical values co-occur and flow across multiple classification dimensions.
// anyplot.ai
// parallel-categories-basic: Basic Parallel Categories Plot
// Library: muix 7.29.1 | JavaScript 22.23.2
// Quality: 92/100 | Created: 2026-09-05
import { useState } from "react";
import { ChartContainer } from "@mui/x-charts/ChartContainer";
import { useDrawingArea } from "@mui/x-charts/hooks";

const t = window.ANYPLOT_TOKENS;

// --- Data: Titanic passengers by class, sex and outcome (in-memory, deterministic) ---
// Class -> Sex -> Outcome, one row per unique combination (Kaggle "train.csv" tallies).
const CLASS_ORDER = ["1st", "2nd", "3rd"];
const SEX_ORDER = ["Female", "Male"];
const OUTCOME_ORDER = ["Survived", "Did not survive"];

const ROWS = [
  { cls: "1st", sex: "Female", outcome: "Survived", n: 91 },
  { cls: "1st", sex: "Female", outcome: "Did not survive", n: 3 },
  { cls: "1st", sex: "Male", outcome: "Survived", n: 45 },
  { cls: "1st", sex: "Male", outcome: "Did not survive", n: 77 },
  { cls: "2nd", sex: "Female", outcome: "Survived", n: 70 },
  { cls: "2nd", sex: "Female", outcome: "Did not survive", n: 6 },
  { cls: "2nd", sex: "Male", outcome: "Survived", n: 17 },
  { cls: "2nd", sex: "Male", outcome: "Did not survive", n: 91 },
  { cls: "3rd", sex: "Female", outcome: "Survived", n: 72 },
  { cls: "3rd", sex: "Female", outcome: "Did not survive", n: 72 },
  { cls: "3rd", sex: "Male", outcome: "Survived", n: 47 },
  { cls: "3rd", sex: "Male", outcome: "Did not survive", n: 300 },
];

const TOTAL = ROWS.reduce((sum, r) => sum + r.n, 0);
const GAP = 34; // px between stacked node segments within a column
const NODE_HALF = 13; // half-width of a node rectangle
const MIN_SEG = 8; // px floor per ribbon segment so near-zero counts (e.g. n=3) stay a visible sliver

// Outcome carries the semantic color: Survived -> brand green, Did not survive -> matte red.
const outcomeColor = (outcome) => (outcome === "Survived" ? t.palette[0] : t.palette[4]);

// Sum row counts grouped by the given key ("cls" | "sex" | "outcome") - real totals, used for node labels.
function nodeTotals(key) {
  const totals = new Map();
  ROWS.forEach((r) => totals.set(r[key], (totals.get(r[key]) || 0) + r.n));
  return totals;
}

// Floor-applied stacking height per node: sums each row's max(count*k, MIN_SEG), so a node's
// rectangle exactly matches the space its (possibly floor-boosted) row segments occupy.
function effectiveHeights(key, k) {
  const heights = new Map();
  ROWS.forEach((r) => {
    const h = Math.max(r.n * k, MIN_SEG);
    heights.set(r[key], (heights.get(r[key]) || 0) + h);
  });
  return heights;
}

// Stack a column's nodes top-to-bottom in `order`, vertically centered in the drawing area.
function layoutColumn(order, totals, heights, area) {
  const contentHeight = order.reduce((s, name) => s + heights.get(name), 0) + GAP * (order.length - 1);
  let y = area.top + (area.height - contentHeight) / 2;
  const nodes = {};
  order.forEach((name) => {
    const h = heights.get(name);
    nodes[name] = { y0: y, y1: y + h, total: totals.get(name) };
    y += h + GAP;
  });
  return nodes;
}

// For every row, find its stacked sub-segment [y0, y1] within its column's node (floor-applied height).
function rowSegments(key, nodes, k) {
  const cursor = {};
  return ROWS.map((r) => {
    const name = r[key];
    if (cursor[name] === undefined) cursor[name] = nodes[name].y0;
    const y0 = cursor[name];
    const y1 = y0 + Math.max(r.n * k, MIN_SEG);
    cursor[name] = y1;
    return { ...r, y0, y1 };
  });
}

// A ribbon between two vertical segments at x0 and x1, bulging via mirrored bezier curves.
function ribbonPath(x0, y0a, y1a, x1, y0b, y1b) {
  const xm = (x0 + x1) / 2;
  return `M${x0},${y0a} C${xm},${y0a} ${xm},${y0b} ${x1},${y0b} L${x1},${y1b} C${xm},${y1b} ${xm},${y1a} ${x0},${y1a} Z`;
}

function ParallelCategories() {
  const area = useDrawingArea();
  const [hoveredRow, setHoveredRow] = useState(null);
  const maxNodes = Math.max(CLASS_ORDER.length, SEX_ORDER.length, OUTCOME_ORDER.length);
  const k = (area.height - GAP * (maxNodes - 1)) / TOTAL;

  const colX = [area.left, area.left + area.width / 2, area.left + area.width];
  const clsTotals = nodeTotals("cls");
  const sexTotals = nodeTotals("sex");
  const outcomeTotals = nodeTotals("outcome");
  const clsHeights = effectiveHeights("cls", k);
  const sexHeights = effectiveHeights("sex", k);
  const outcomeHeights = effectiveHeights("outcome", k);
  const clsNodes = layoutColumn(CLASS_ORDER, clsTotals, clsHeights, area);
  const sexNodes = layoutColumn(SEX_ORDER, sexTotals, sexHeights, area);
  const outcomeNodes = layoutColumn(OUTCOME_ORDER, outcomeTotals, outcomeHeights, area);

  const clsSegs = rowSegments("cls", clsNodes, k);
  const sexSegs = rowSegments("sex", sexNodes, k);
  const outcomeSegs = rowSegments("outcome", outcomeNodes, k);

  // Ribbon fill/stroke by hover state: the hovered row's full class->sex->outcome path
  // brightens while every other ribbon dims, tracing one flow across all three columns.
  function ribbonStyle(i) {
    const isHovered = hoveredRow === i;
    const isDimmed = hoveredRow !== null && !isHovered;
    return {
      fillOpacity: isDimmed ? 0.12 : isHovered ? 0.92 : 0.78,
      strokeOpacity: isDimmed ? 0.06 : isHovered ? 0.35 : 0.12,
      strokeWidth: isHovered ? 1.5 : 1,
    };
  }

  return (
    <g>
      <defs>
        {/* Secondary, color-independent cue for "Did not survive" ribbons (diagonal hatch),
            so red/green stay distinguishable for deuteranope/protanope viewers. */}
        <pattern id="outcome-hatch" patternUnits="userSpaceOnUse" width={6} height={6} patternTransform="rotate(45)">
          <line x1={0} y1={0} x2={0} y2={6} stroke={t.ink} strokeOpacity={0.45} strokeWidth={1.5} />
        </pattern>
      </defs>

      {["Class", "Sex", "Outcome"].map((label, i) => (
        <text
          key={label}
          x={colX[i]}
          y={area.top - 22}
          textAnchor="middle"
          fontSize={15}
          fontWeight={600}
          fill={t.inkSoft}
        >
          {label}
        </text>
      ))}

      {ROWS.map((r, i) => {
        const d = ribbonPath(
          colX[0] + NODE_HALF,
          clsSegs[i].y0,
          clsSegs[i].y1,
          colX[1] - NODE_HALF,
          sexSegs[i].y0,
          sexSegs[i].y1
        );
        const style = ribbonStyle(i);
        return (
          <g key={`link1-${i}`}>
            <path
              d={d}
              fill={outcomeColor(r.outcome)}
              stroke={t.ink}
              cursor="pointer"
              {...style}
              onMouseEnter={() => setHoveredRow(i)}
              onMouseLeave={() => setHoveredRow(null)}
            />
            {r.outcome === "Did not survive" && (
              <path d={d} fill="url(#outcome-hatch)" fillOpacity={style.fillOpacity} pointerEvents="none" />
            )}
          </g>
        );
      })}
      {ROWS.map((r, i) => {
        const d = ribbonPath(
          colX[1] + NODE_HALF,
          sexSegs[i].y0,
          sexSegs[i].y1,
          colX[2] - NODE_HALF,
          outcomeSegs[i].y0,
          outcomeSegs[i].y1
        );
        const style = ribbonStyle(i);
        return (
          <g key={`link2-${i}`}>
            <path
              d={d}
              fill={outcomeColor(r.outcome)}
              stroke={t.ink}
              cursor="pointer"
              {...style}
              onMouseEnter={() => setHoveredRow(i)}
              onMouseLeave={() => setHoveredRow(null)}
            />
            {r.outcome === "Did not survive" && (
              <path d={d} fill="url(#outcome-hatch)" fillOpacity={style.fillOpacity} pointerEvents="none" />
            )}
          </g>
        );
      })}

      {[clsNodes, sexNodes, outcomeNodes].map((nodes, ci) =>
        Object.entries(nodes).map(([name, node]) => (
          <rect
            key={`node-${ci}-${name}`}
            x={colX[ci] - NODE_HALF}
            y={node.y0}
            width={NODE_HALF * 2}
            height={node.y1 - node.y0}
            rx={2}
            fill={t.ink}
            fillOpacity={0.88}
          />
        ))
      )}

      {Object.entries(clsNodes).map(([name, node]) => (
        <text
          key={`label-cls-${name}`}
          x={colX[0] - NODE_HALF - 12}
          y={(node.y0 + node.y1) / 2}
          textAnchor="end"
          dominantBaseline="middle"
          fontSize={14}
          fill={t.ink}
        >
          {`${name} · ${node.total}`}
        </text>
      ))}
      {Object.entries(sexNodes).map(([name, node]) => (
        <text
          key={`label-sex-${name}`}
          x={colX[1]}
          y={node.y0 - 12}
          textAnchor="middle"
          fontSize={14}
          fill={t.ink}
        >
          {`${name} · ${node.total}`}
        </text>
      ))}
      {Object.entries(outcomeNodes).map(([name, node]) => (
        <text
          key={`label-outcome-${name}`}
          x={colX[2] + NODE_HALF + 12}
          y={(node.y0 + node.y1) / 2}
          textAnchor="start"
          dominantBaseline="middle"
          fontSize={14}
          fill={t.ink}
        >
          {`${name} · ${node.total}`}
        </text>
      ))}
    </g>
  );
}

export default function Chart() {
  const { width, height } = window.ANYPLOT_SIZE;
  const title = "Titanic Passengers · parallel-categories-basic · javascript · muix · anyplot.ai";
  const titleFontSize = Math.round(22 * (title.length > 67 ? 67 / title.length : 1));
  const headerH = 118;
  const pad = 40;

  return (
    <div
      style={{
        width,
        height,
        backgroundColor: t.pageBg,
        position: "relative",
        fontFamily: '"Helvetica Neue", Arial, sans-serif',
        boxSizing: "border-box",
      }}
    >
      <div style={{ position: "absolute", top: 26, left: pad, right: pad }}>
        <div style={{ color: t.ink, fontSize: titleFontSize, fontWeight: 600 }}>{title}</div>
        <div style={{ color: t.inkSoft, fontSize: 15, marginTop: 6 }}>
          Class, sex and survival outcome for 891 Titanic passengers — ribbon width is
          proportional to passenger count.
        </div>
        <div style={{ display: "flex", gap: 24, marginTop: 12, alignItems: "center" }}>
          {OUTCOME_ORDER.map((name) => (
            <div key={name} style={{ display: "flex", alignItems: "center", gap: 8 }}>
              <span
                style={{
                  width: 14,
                  height: 14,
                  borderRadius: 3,
                  backgroundColor: outcomeColor(name),
                  // "Did not survive" repeats the ribbons' diagonal-hatch cue, so the two
                  // outcomes stay distinguishable by texture alone, not just green vs. red.
                  backgroundImage:
                    name === "Did not survive"
                      ? "repeating-linear-gradient(45deg, transparent, transparent 2px, rgba(0,0,0,0.4) 2px, rgba(0,0,0,0.4) 3px)"
                      : undefined,
                  display: "inline-block",
                }}
              />
              <span style={{ color: t.inkSoft, fontSize: 14 }}>{name}</span>
            </div>
          ))}
        </div>
      </div>
      <div style={{ position: "absolute", top: headerH, left: pad }}>
        <ChartContainer
          width={width - pad * 2}
          height={height - headerH - pad / 2}
          series={[]}
          margin={{ top: 46, bottom: 12, left: 120, right: 170 }}
        >
          <ParallelCategories />
        </ChartContainer>
      </div>
    </div>
  );
}
Runnable source as JSON, for any HTTP client: https://api.anyplot.ai/specs/parallel-categories-basic/muix/code. Any spec id and library id listed in llms-full.txt fit the same URL shape; every URL below is complete and callable.
{
  "spec_id": "parallel-categories-basic",
  "language": "javascript",
  "library": "muix",
  "page": "https://anyplot.ai/parallel-categories-basic/javascript/muix",
  "hub": "https://anyplot.ai/parallel-categories-basic",
  "code_json": "https://api.anyplot.ai/specs/parallel-categories-basic/muix/code",
  "spec_json": "https://api.anyplot.ai/specs/parallel-categories-basic",
  "render_light_png": "https://storage.googleapis.com/anyplot-images/plots/parallel-categories-basic/javascript/muix/plot-light.png",
  "render_dark_png": "https://storage.googleapis.com/anyplot-images/plots/parallel-categories-basic/javascript/muix/plot-dark.png",
  "interactive_light_html": "https://storage.googleapis.com/anyplot-images/plots/parallel-categories-basic/javascript/muix/plot-light.html",
  "interactive_dark_html": "https://storage.googleapis.com/anyplot-images/plots/parallel-categories-basic/javascript/muix/plot-dark.html",
  "quality_score": 92.0,
  "license": "MIT",
  "guide": "https://anyplot.ai/llms.txt"
}
Part of Basic Parallel Categories Plot on anyplot.ai.