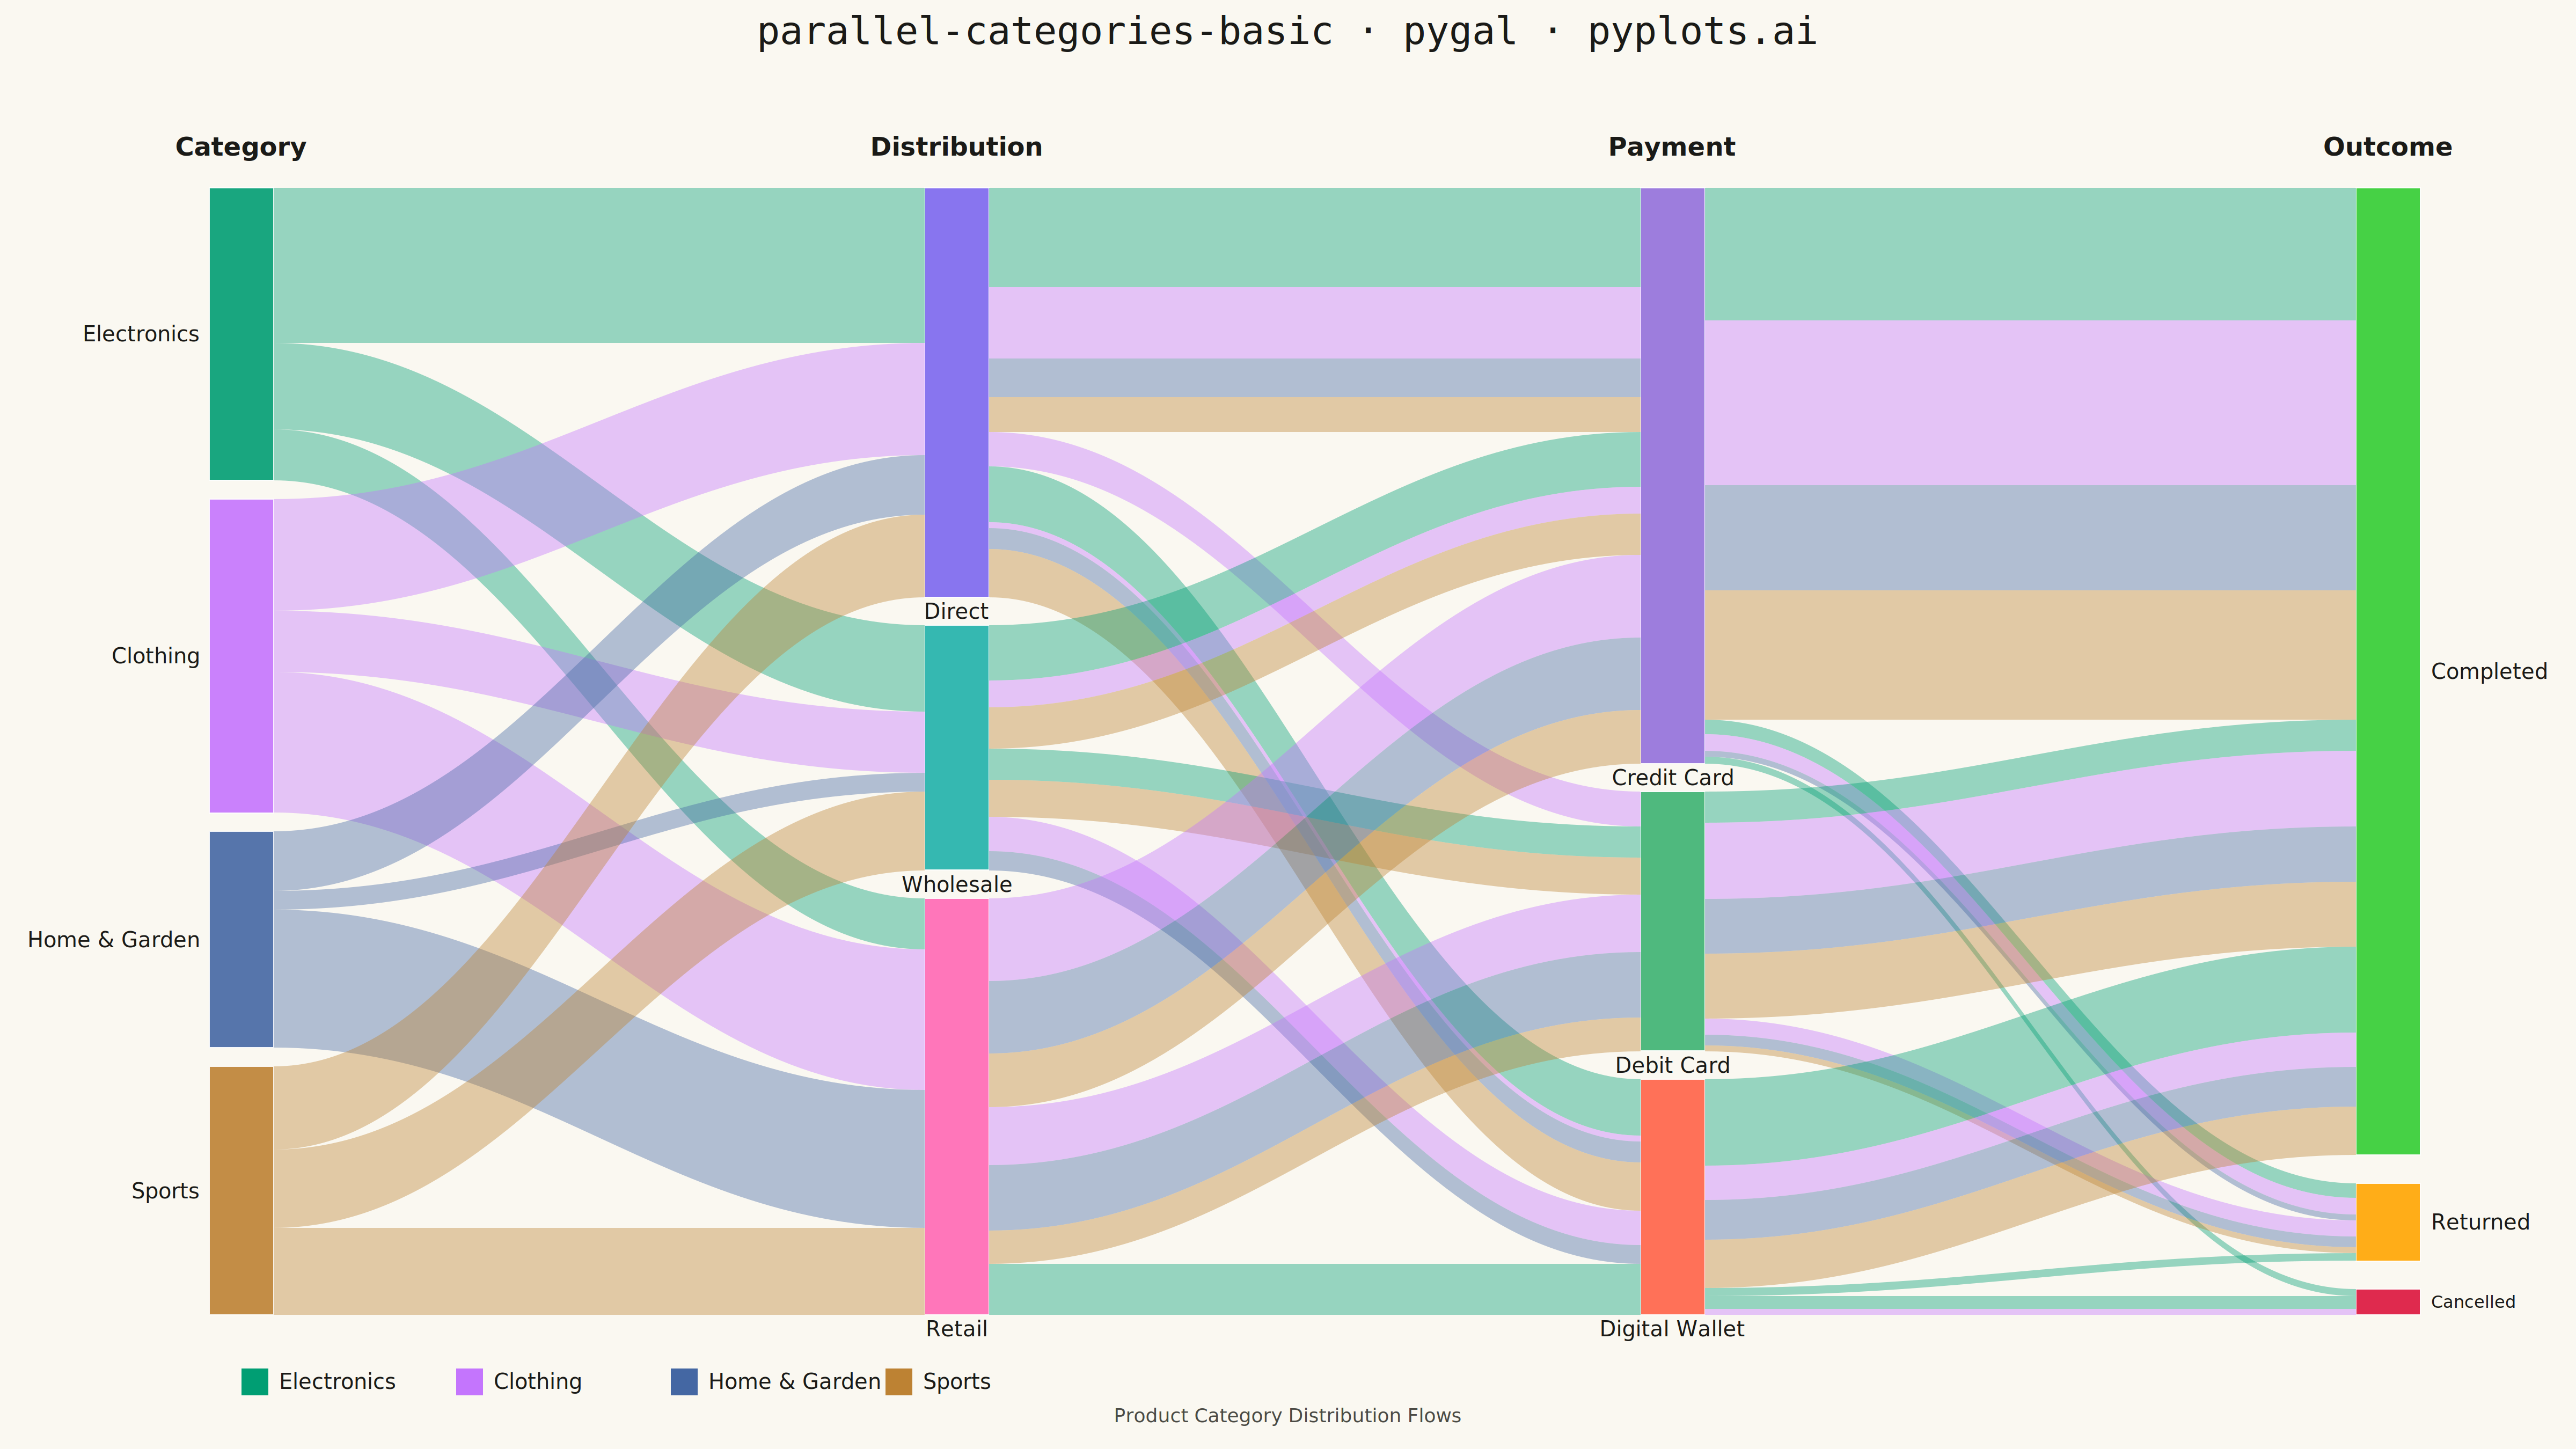
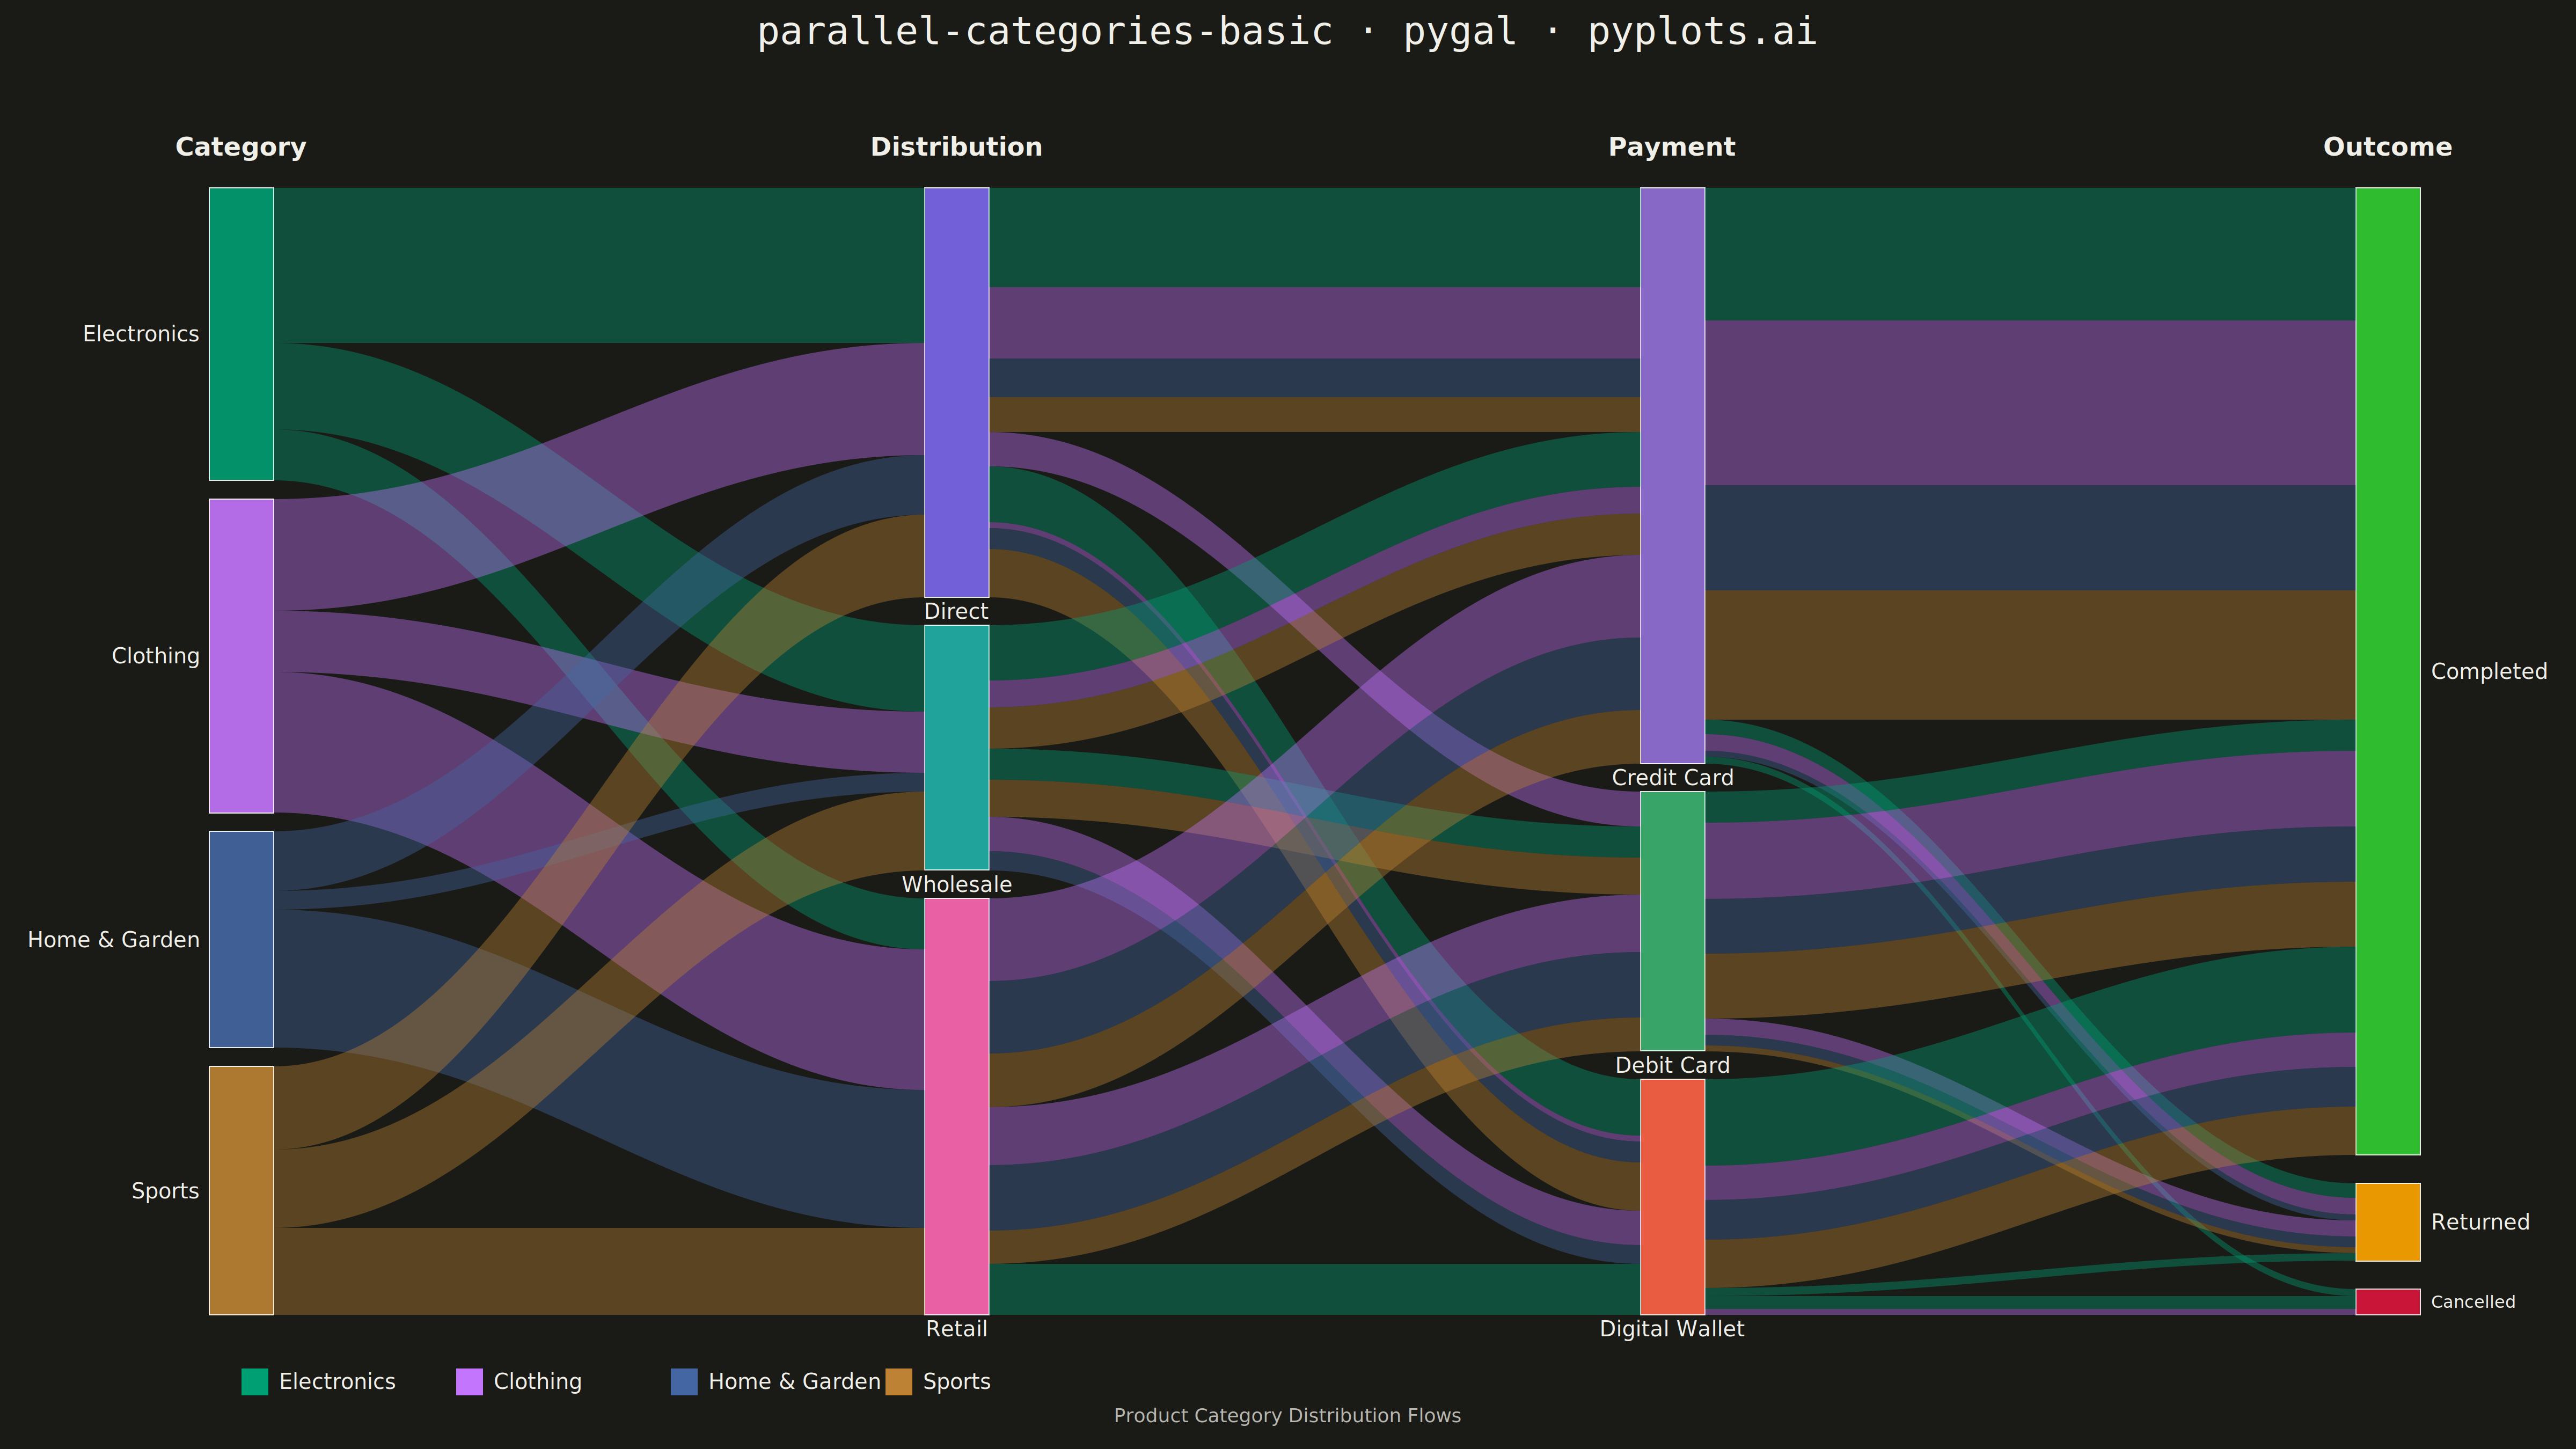
A parallel categories plot visualizes categorical data across multiple dimensions, with vertical axes representing each categorical variable and ribbons connecting categories to show observation flow. Unlike parallel coordinates (which use lines for numeric data), parallel categories use width-proportional ribbons to show counts or frequencies, making it ideal for understanding how categorical values co-occur and flow across multiple classification dimensions.
""" anyplot.ai
parallel-categories-basic: Basic Parallel Categories Plot
Library: pygal 3.1.0 | Python 3.13.13
Quality: 82/100 | Updated: 2026-05-13
"""
import os
import cairosvg
import numpy as np
import pygal
from pygal.style import Style
# Theme tokens
THEME = os.getenv("ANYPLOT_THEME", "light")
PAGE_BG = "#FAF8F1" if THEME == "light" else "#1A1A17"
INK = "#1A1A17" if THEME == "light" else "#F0EFE8"
INK_SOFT = "#4A4A44" if THEME == "light" else "#B8B7B0"
INK_MUTED = "#6B6A63" if THEME == "light" else "#A8A79F"
# Set seed for reproducibility
np.random.seed(42)
# Okabe-Ito palette (first series is always #009E73)
IMPRINT = ("#009E73", "#C475FD", "#4467A3", "#BD8233")
# Data: Product journey from category through distribution channel to outcome
# Changed from Online/Store/Mobile to Distribution Channels (Direct/Wholesale/Retail)
categories = ["Category", "Distribution", "Payment", "Outcome"]
dimension_values = {
"Category": ["Electronics", "Clothing", "Home & Garden", "Sports"],
"Distribution": ["Direct", "Wholesale", "Retail"],
"Payment": ["Credit Card", "Debit Card", "Digital Wallet"],
"Outcome": ["Completed", "Returned", "Cancelled"],
}
# Generate realistic distribution channel data
np.random.seed(42)
base_counts = {
# Electronics - balanced across channels
("Electronics", "Direct", "Credit Card", "Completed"): 450,
("Electronics", "Direct", "Credit Card", "Returned"): 85,
("Electronics", "Direct", "Digital Wallet", "Completed"): 280,
("Electronics", "Direct", "Digital Wallet", "Returned"): 45,
("Electronics", "Wholesale", "Credit Card", "Completed"): 320,
("Electronics", "Wholesale", "Debit Card", "Completed"): 180,
("Electronics", "Retail", "Digital Wallet", "Completed"): 220,
("Electronics", "Retail", "Digital Wallet", "Cancelled"): 75,
("Electronics", "Direct", "Credit Card", "Cancelled"): 40,
# Clothing - higher retail presence
("Clothing", "Direct", "Credit Card", "Completed"): 320,
("Clothing", "Direct", "Credit Card", "Returned"): 95,
("Clothing", "Direct", "Debit Card", "Completed"): 150,
("Clothing", "Direct", "Debit Card", "Returned"): 50,
("Clothing", "Retail", "Credit Card", "Completed"): 480,
("Clothing", "Retail", "Debit Card", "Completed"): 290,
("Clothing", "Retail", "Debit Card", "Returned"): 45,
("Clothing", "Wholesale", "Digital Wallet", "Completed"): 200,
("Clothing", "Wholesale", "Credit Card", "Completed"): 155,
("Clothing", "Direct", "Digital Wallet", "Cancelled"): 35,
# Home & Garden - more wholesale/retail
("Home & Garden", "Retail", "Credit Card", "Completed"): 420,
("Home & Garden", "Retail", "Debit Card", "Completed"): 320,
("Home & Garden", "Retail", "Debit Card", "Returned"): 60,
("Home & Garden", "Direct", "Credit Card", "Completed"): 190,
("Home & Garden", "Direct", "Credit Card", "Returned"): 35,
("Home & Garden", "Direct", "Digital Wallet", "Completed"): 120,
("Home & Garden", "Wholesale", "Digital Wallet", "Completed"): 110,
# Sports - strong direct/retail mix
("Sports", "Direct", "Digital Wallet", "Completed"): 280,
("Sports", "Direct", "Credit Card", "Completed"): 200,
("Sports", "Retail", "Credit Card", "Completed"): 310,
("Sports", "Retail", "Debit Card", "Completed"): 195,
("Sports", "Wholesale", "Credit Card", "Completed"): 240,
("Sports", "Wholesale", "Debit Card", "Completed"): 180,
("Sports", "Wholesale", "Debit Card", "Returned"): 35,
}
# Category colors use Okabe-Ito palette (first series is brand green #009E73)
category_colors = {
"Electronics": IMPRINT[0], # #009E73 (bluish green - brand)
"Clothing": IMPRINT[1], # #C475FD (vermillion)
"Home & Garden": IMPRINT[2], # #4467A3 (blue)
"Sports": IMPRINT[3], # #BD8233 (reddish purple)
}
# Secondary colors for middle dimensions - distinct but complementary
dimension_colors = {
"Distribution": {"Direct": "#7B68EE", "Wholesale": "#20B2AA", "Retail": "#FF69B4"},
"Payment": {"Credit Card": "#9370DB", "Debit Card": "#3CB371", "Digital Wallet": "#FF6347"},
"Outcome": {"Completed": "#32CD32", "Returned": "#FFA500", "Cancelled": "#DC143C"},
}
# Custom style for pygal with theme-adaptive colors
custom_style = Style(
background=PAGE_BG,
plot_background=PAGE_BG,
foreground=INK,
foreground_strong=INK,
foreground_subtle=INK_MUTED,
title_font_size=72,
)
# Create minimal chart for title rendering
chart = pygal.XY(
width=4800,
height=2700,
style=custom_style,
title="parallel-categories-basic · pygal · pyplots.ai",
show_legend=False,
show_x_guides=False,
show_y_guides=False,
show_x_labels=False,
show_y_labels=False,
dots_size=0,
stroke=False,
range=(0, 100),
xrange=(0, 100),
)
# Add empty data to avoid "No data" message
chart.add("", [(50, 50)])
# Render base SVG
base_svg = chart.render().decode("utf-8")
# SVG coordinate mapping
margin_left = 450
margin_right = 350
margin_top = 350
margin_bottom = 250
chart_width = 4800 - margin_left - margin_right
chart_height = 2700 - margin_top - margin_bottom
# Calculate positions for each dimension axis
n_dims = len(categories)
x_positions = [margin_left + i * chart_width / (n_dims - 1) for i in range(n_dims)]
bar_width = 120
gap_ratio = 0.05
# Calculate totals for each category in each dimension
dim_totals = {}
for dim_idx, dim_name in enumerate(categories):
dim_totals[dim_idx] = {}
for cat in dimension_values[dim_name]:
total = 0
for path, count in base_counts.items():
if path[dim_idx] == cat:
total += count
dim_totals[dim_idx][cat] = total
# Calculate node positions
node_positions = {}
for dim_idx, dim_name in enumerate(categories):
x = x_positions[dim_idx]
dim_total = sum(dim_totals[dim_idx].values())
total_gap = gap_ratio * chart_height
available_height = chart_height - total_gap
n_cats = len(dimension_values[dim_name])
gap_size = total_gap / max(1, n_cats - 1) if n_cats > 1 else 0
y_top = margin_top
for _cat_idx, cat in enumerate(dimension_values[dim_name]):
height = (dim_totals[dim_idx][cat] / dim_total) * available_height if dim_total > 0 else 0
y_bottom = y_top + height
node_positions[(dim_idx, cat)] = (y_top, y_bottom, x)
y_top = y_bottom + gap_size
# Build SVG elements
parallel_svg = '<g id="parallel-categories">'
# Draw nodes (category bars) for each dimension
for dim_idx, dim_name in enumerate(categories):
x = x_positions[dim_idx]
for cat in dimension_values[dim_name]:
y_top, y_bottom, _ = node_positions[(dim_idx, cat)]
height = y_bottom - y_top
if height < 1:
continue
# Color based on dimension
if dim_idx == 0:
fill_color = category_colors[cat]
else:
fill_color = dimension_colors[dim_name][cat]
parallel_svg += f'''
<rect x="{x - bar_width / 2:.0f}" y="{y_top:.0f}" width="{bar_width:.0f}" height="{height:.0f}"
fill="{fill_color}" stroke="white" stroke-width="2" opacity="0.9"/>'''
# Add dimension label at top
dim_name_escaped = dim_name.replace("&", "&")
parallel_svg += f'''
<text x="{x:.0f}" y="{margin_top - 60:.0f}" text-anchor="middle"
font-size="48" font-weight="bold" font-family="DejaVu Sans, sans-serif"
fill="{INK}">{dim_name_escaped}</text>'''
# Add category labels for each dimension with improved legibility
for dim_idx, dim_name in enumerate(categories):
x = x_positions[dim_idx]
for cat in dimension_values[dim_name]:
y_top, y_bottom, _ = node_positions[(dim_idx, cat)]
y_center = (y_top + y_bottom) / 2
height = y_bottom - y_top
# Position label based on dimension
if dim_idx == 0: # Left side - outside bar
label_x = x - bar_width / 2 - 20
anchor = "end"
elif dim_idx == n_dims - 1: # Right side - outside bar
label_x = x + bar_width / 2 + 20
anchor = "start"
else: # Middle dimensions - below the bar
label_x = x
anchor = "middle"
# Use consistent readable font size (minimum 32px for better legibility)
font_size = max(32, min(40, height * 0.35))
# Escape special characters
cat_escaped = cat.replace("&", "&")
if dim_idx in [0, n_dims - 1]:
# Side labels - next to bars
parallel_svg += f'''
<text x="{label_x:.0f}" y="{y_center:.0f}" text-anchor="{anchor}"
font-size="{font_size:.0f}" font-family="DejaVu Sans, sans-serif"
fill="{INK}" dominant-baseline="middle">{cat_escaped}</text>'''
else:
# Middle dimension labels - below each bar segment
label_y = y_bottom + 40
parallel_svg += f'''
<text x="{label_x:.0f}" y="{label_y:.0f}" text-anchor="{anchor}"
font-size="{font_size:.0f}" font-family="DejaVu Sans, sans-serif"
fill="{INK}">{cat_escaped}</text>'''
# Calculate flow offsets for drawing ribbons
source_offsets = {}
target_offsets = {}
for dim_idx in range(n_dims):
for cat in dimension_values[categories[dim_idx]]:
y_top, y_bottom, _ = node_positions[(dim_idx, cat)]
source_offsets[(dim_idx, cat)] = y_top
target_offsets[(dim_idx, cat)] = y_top
# Draw flows between consecutive dimensions
for dim_idx in range(n_dims - 1):
dim1_name = categories[dim_idx]
dim2_name = categories[dim_idx + 1]
x0 = x_positions[dim_idx]
x1 = x_positions[dim_idx + 1]
# Calculate total for normalization
dim1_total = sum(dim_totals[dim_idx].values())
dim2_total = sum(dim_totals[dim_idx + 1].values())
# Aggregate flows between consecutive dimensions
flow_aggregates = {}
for path, count in base_counts.items():
key = (path[dim_idx], path[dim_idx + 1], path[0])
if key not in flow_aggregates:
flow_aggregates[key] = 0
flow_aggregates[key] += count
# Sort flows for consistent drawing
sorted_flows = sorted(
flow_aggregates.items(),
key=lambda x: (dimension_values[dim1_name].index(x[0][0]), dimension_values[dim2_name].index(x[0][1])),
)
# Draw each flow
for (source_cat, target_cat, first_cat), flow_value in sorted_flows:
if flow_value <= 0:
continue
source_y_top, source_y_bottom, _ = node_positions[(dim_idx, source_cat)]
target_y_top, target_y_bottom, _ = node_positions[(dim_idx + 1, target_cat)]
source_dim_total = dim_totals[dim_idx][source_cat]
target_dim_total = dim_totals[dim_idx + 1][target_cat]
source_height = (
(flow_value / source_dim_total) * (source_y_bottom - source_y_top) if source_dim_total > 0 else 0
)
target_height = (
(flow_value / target_dim_total) * (target_y_bottom - target_y_top) if target_dim_total > 0 else 0
)
# Get current positions
y0_top = source_offsets[(dim_idx, source_cat)]
y0_bottom = y0_top + source_height
y1_top = target_offsets[(dim_idx + 1, target_cat)]
y1_bottom = y1_top + target_height
# Bezier curve control points
band_x0 = x0 + bar_width / 2
band_x1 = x1 - bar_width / 2
cx0 = band_x0 + 0.4 * (band_x1 - band_x0)
cx1 = band_x0 + 0.6 * (band_x1 - band_x0)
# Create path for the curved ribbon
path_d = (
f"M {band_x0:.0f},{y0_top:.0f} "
f"C {cx0:.0f},{y0_top:.0f} {cx1:.0f},{y1_top:.0f} {band_x1:.0f},{y1_top:.0f} "
f"L {band_x1:.0f},{y1_bottom:.0f} "
f"C {cx1:.0f},{y1_bottom:.0f} {cx0:.0f},{y0_bottom:.0f} {band_x0:.0f},{y0_bottom:.0f} "
f"Z"
)
# Color by first category
ribbon_color = category_colors[first_cat]
parallel_svg += f'''
<path d="{path_d}" fill="{ribbon_color}" fill-opacity="0.4" stroke="none"/>'''
# Update offsets
source_offsets[(dim_idx, source_cat)] = y0_bottom
target_offsets[(dim_idx + 1, target_cat)] = y1_bottom
# Add legend for categories
legend_x = margin_left
legend_y = chart_height + margin_top + 100
legend_spacing = 400
for idx, (cat, color) in enumerate(category_colors.items()):
lx = legend_x + idx * legend_spacing
cat_escaped = cat.replace("&", "&")
parallel_svg += f'''
<rect x="{lx:.0f}" y="{legend_y:.0f}" width="50" height="50" fill="{color}" stroke="none"/>
<text x="{lx + 70:.0f}" y="{legend_y + 38:.0f}" text-anchor="start"
font-size="40" font-family="DejaVu Sans, sans-serif" fill="{INK}">{cat_escaped}</text>'''
# Add subtitle
parallel_svg += f'''
<text x="2400" y="{chart_height + margin_top + 200:.0f}" text-anchor="middle"
font-size="36" font-style="italic" font-family="DejaVu Sans, sans-serif"
fill="{INK_SOFT}">Product Category Distribution Flows</text>'''
parallel_svg += "\n</g>"
# Insert elements before closing </svg> tag
svg_with_parallel = base_svg.replace("</svg>", f"{parallel_svg}\n</svg>")
# Save SVG
with open(f"plot-{THEME}.svg", "w") as f:
f.write(svg_with_parallel)
# Render to PNG
cairosvg.svg2png(bytestring=svg_with_parallel.encode("utf-8"), write_to=f"plot-{THEME}.png")
# Save HTML for interactive version
with open(f"plot-{THEME}.html", "w") as f:
f.write(f"""<!DOCTYPE html>
<html>
<head>
<title>parallel-categories-basic · pygal · pyplots.ai</title>
<style>
body {{ margin: 0; padding: 20px; background: {PAGE_BG}; font-family: sans-serif; }}
.container {{ max-width: 100%; margin: 0 auto; }}
object {{ width: 100%; height: auto; }}
</style>
</head>
<body>
<div class="container">
<object type="image/svg+xml" data="plot-{THEME}.svg">
Parallel categories diagram not supported
</object>
</div>
</body>
</html>""")
Runnable source as JSON, for any HTTP client: https://api.anyplot.ai/specs/parallel-categories-basic/pygal/code. Any spec id and library id listed in llms-full.txt fit the same URL shape; every URL below is complete and callable.
{
  "spec_id": "parallel-categories-basic",
  "language": "python",
  "library": "pygal",
  "page": "https://anyplot.ai/parallel-categories-basic/python/pygal",
  "hub": "https://anyplot.ai/parallel-categories-basic",
  "code_json": "https://api.anyplot.ai/specs/parallel-categories-basic/pygal/code",
  "spec_json": "https://api.anyplot.ai/specs/parallel-categories-basic",
  "render_light_png": "https://storage.googleapis.com/anyplot-images/plots/parallel-categories-basic/python/pygal/plot-light.png",
  "render_dark_png": "https://storage.googleapis.com/anyplot-images/plots/parallel-categories-basic/python/pygal/plot-dark.png",
  "interactive_light_html": "https://storage.googleapis.com/anyplot-images/plots/parallel-categories-basic/python/pygal/plot-light.html",
  "interactive_dark_html": "https://storage.googleapis.com/anyplot-images/plots/parallel-categories-basic/python/pygal/plot-dark.html",
  "quality_score": 82.0,
  "license": "MIT",
  "guide": "https://anyplot.ai/llms.txt"
}
Part of Basic Parallel Categories Plot on anyplot.ai.