The same plot in 14 other libraries — JavaScript: Chart.js, Apache ECharts, Highcharts, MUI X Charts; Python: Altair, Bokeh, lets-plot, Matplotlib, Plotly, plotnine, Pygal, Seaborn; R: ggplot2; Julia: Makie.jl. Compare all 15 side by side: Thermodynamic Phase Diagram (Pressure-Temperature) in Python, R, Julia and JavaScript.
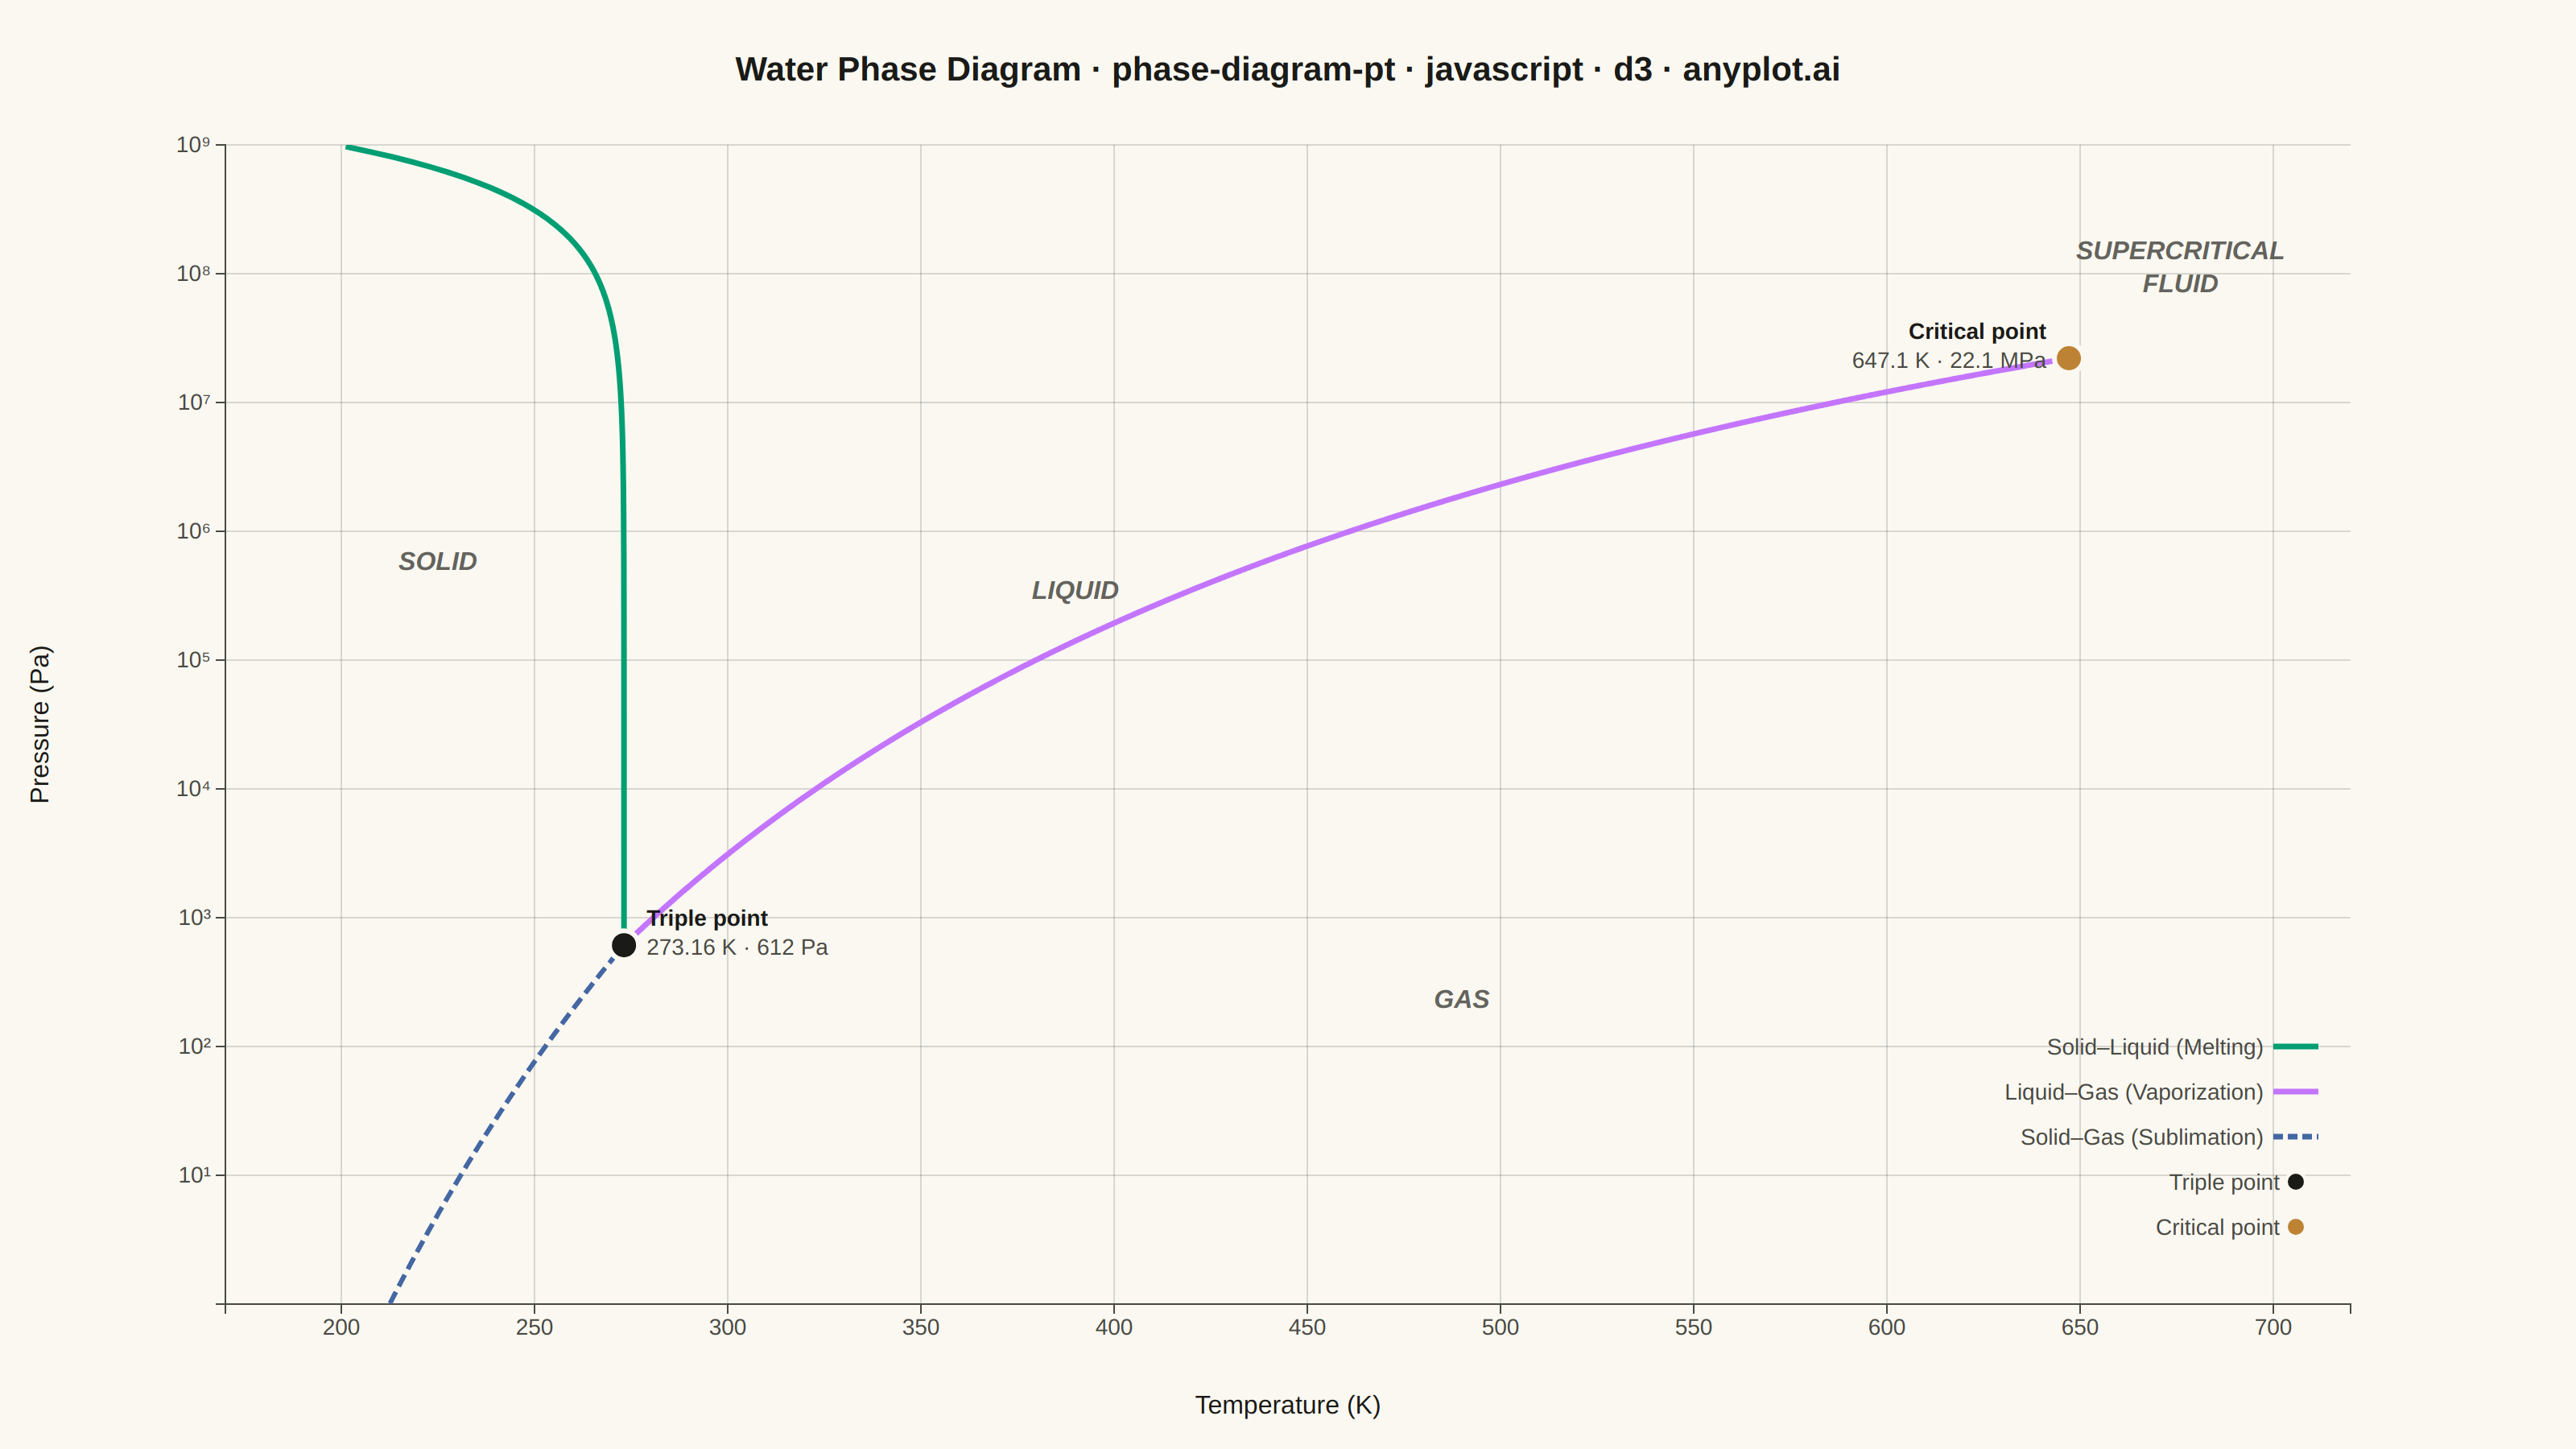
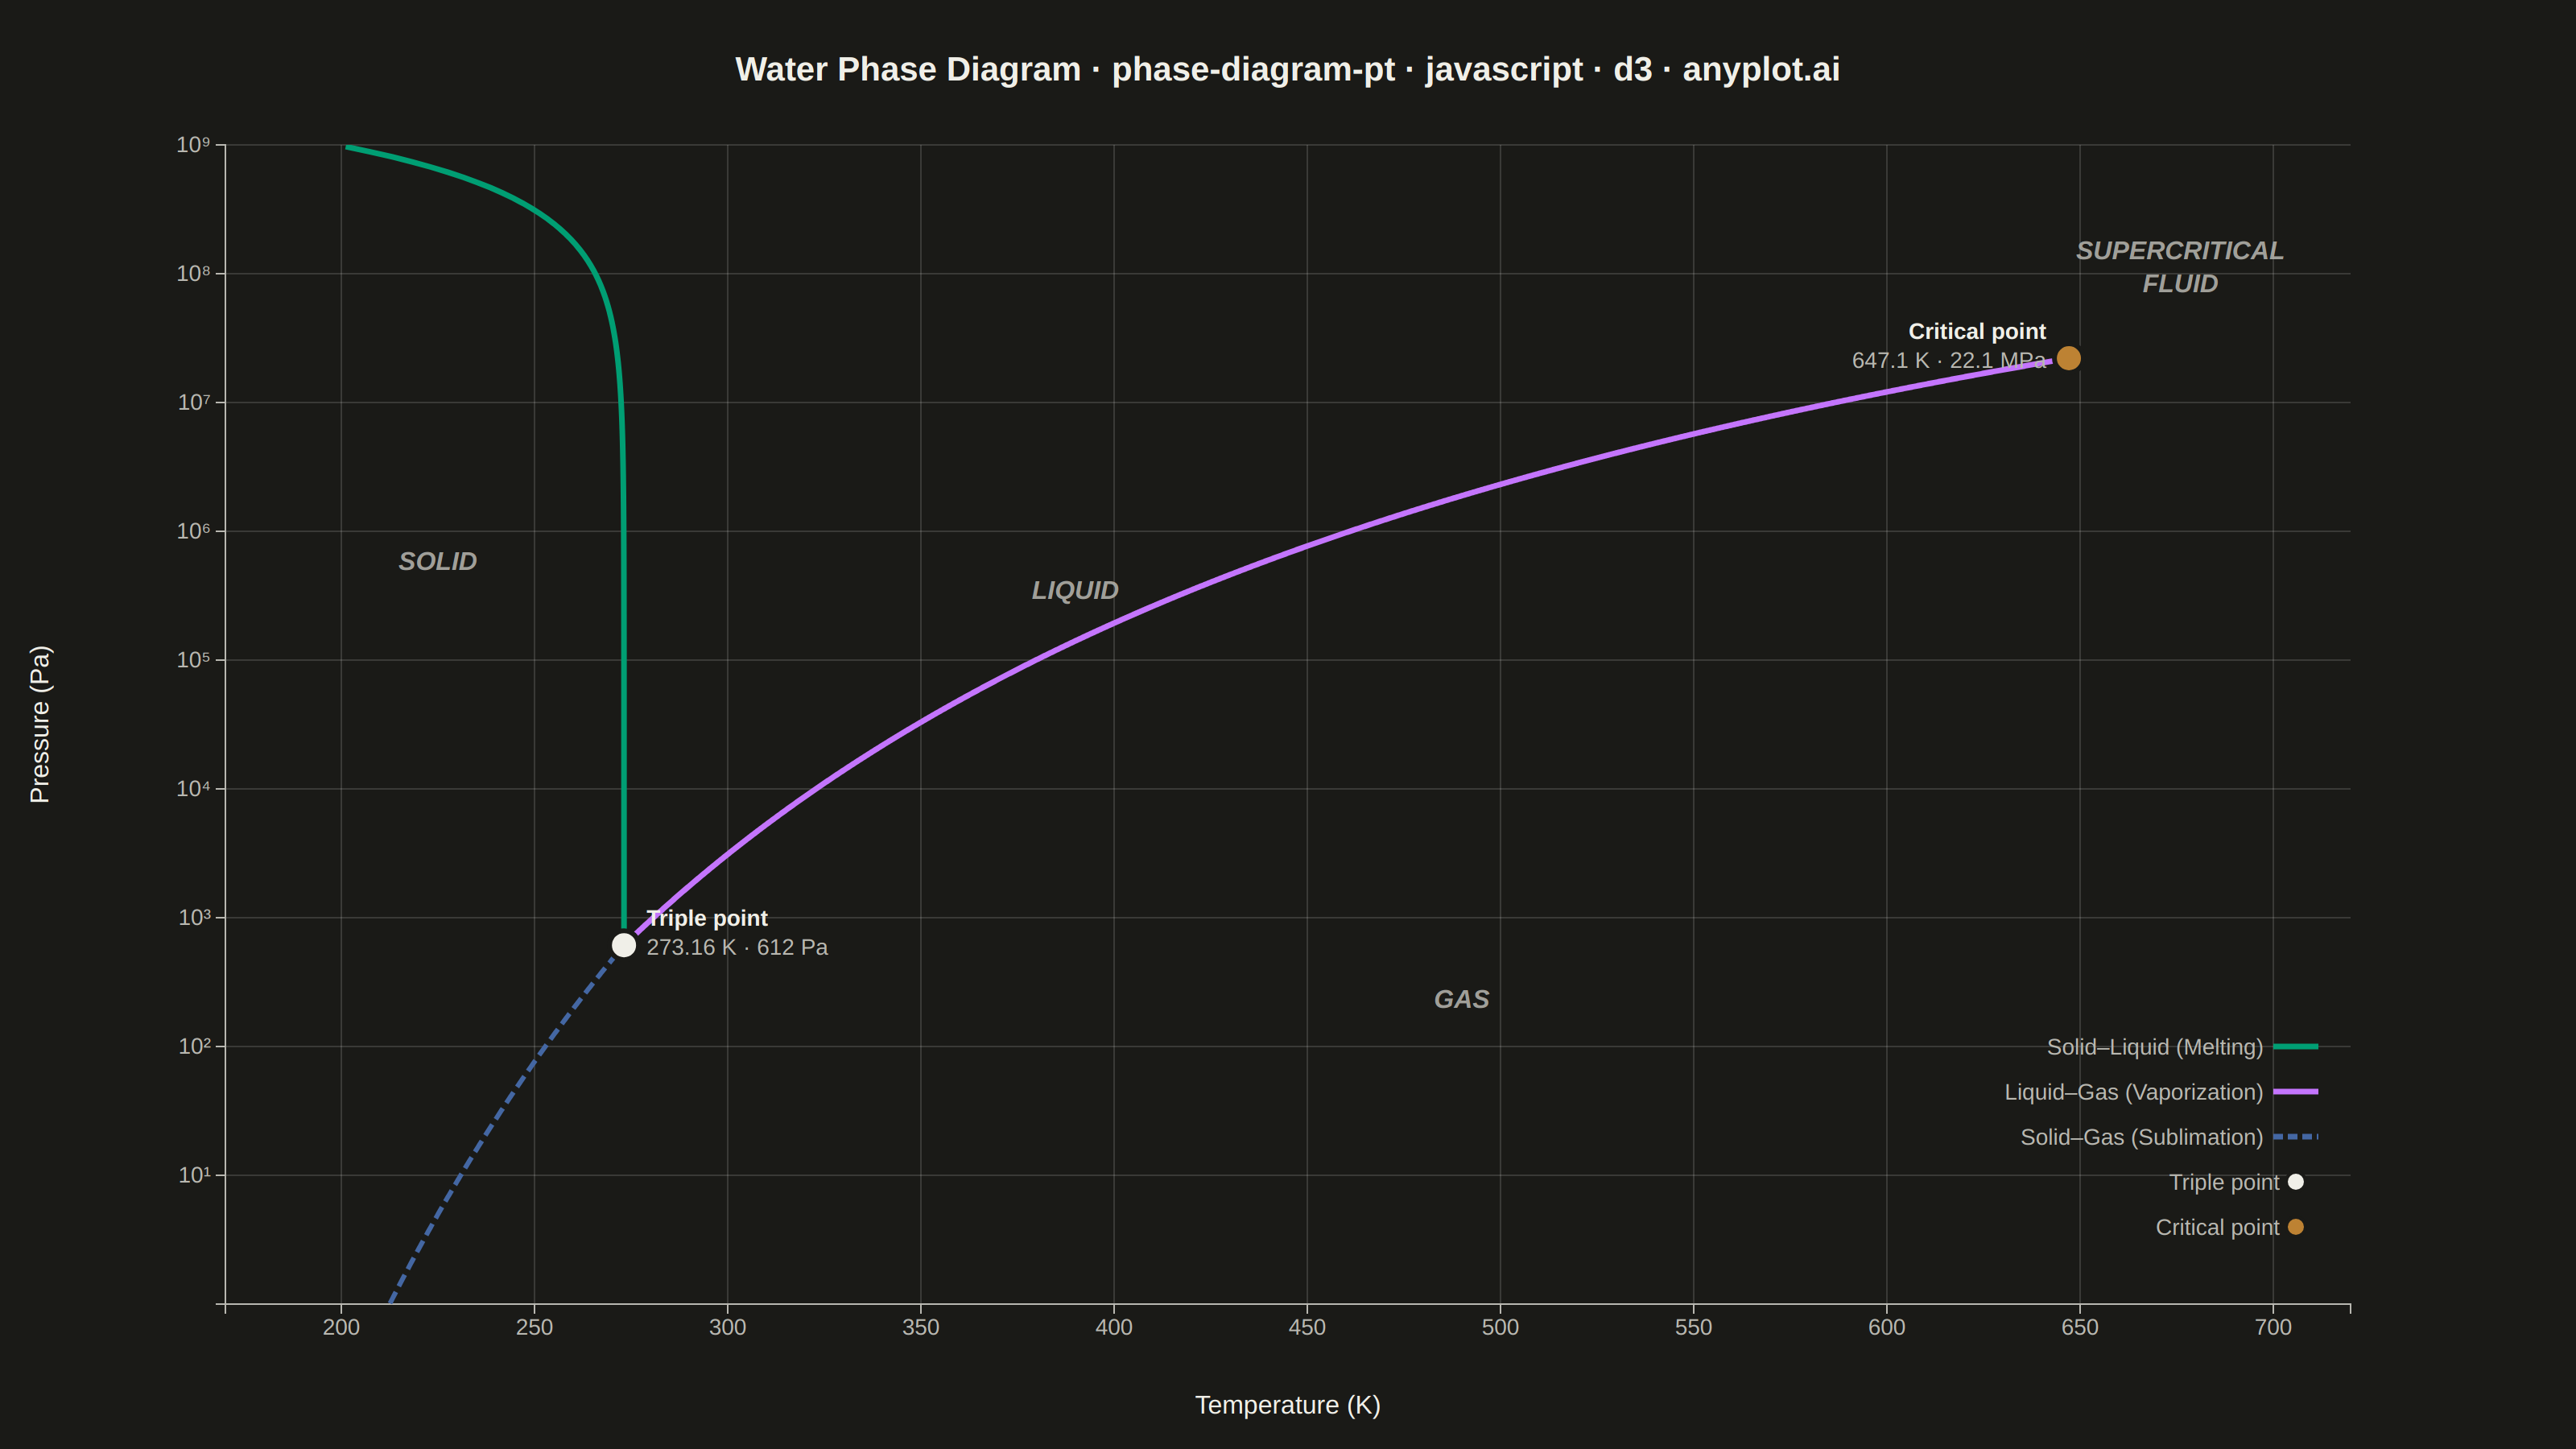
A pressure-temperature (P-T) phase diagram showing the boundaries between solid, liquid, and gas phases of a substance. The diagram includes the triple point where all three phases coexist and the critical point beyond which the liquid-gas distinction vanishes. This is one of the most fundamental diagrams in chemistry and physics, essential for understanding phase transitions and states of matter.
// anyplot.ai
// phase-diagram-pt: Thermodynamic Phase Diagram (Pressure-Temperature)
// Library: d3 7.9.0 | JavaScript 22.22.3
// Quality: 90/100 | Created: 2026-06-08

const t = window.ANYPLOT_TOKENS;
const { width, height } = window.ANYPLOT_SIZE;

const margin = { top: 90, right: 140, bottom: 90, left: 140 };
const iw = width - margin.left - margin.right;
const ih = height - margin.top - margin.bottom;

// --- Water phase diagram constants ---
const T_TRIPLE = 273.16, P_TRIPLE = 611.73;
const T_CRIT = 647.1, P_CRIT = 2.2064e7;
// Melting slope: negative for water (it expands on freezing)
const MELT_SLOPE = -1.346e7;   // Pa/K
const L_SUB_R = 6141;          // sublimation Clausius-Clapeyron L/R (K)
// Vaporization L/R calibrated so the curve terminates exactly at the critical point
const L_VAP_R = Math.log(P_CRIT / P_TRIPLE) / (1 / T_TRIPLE - 1 / T_CRIT);

// Unicode superscript digits for axis tick labels
const SUP_DIGITS = "⁰¹²³⁴⁵⁶⁷⁸⁹";
const toSup = n => String(n).split("").map(c => SUP_DIGITS[+c]).join("");

// Axis domain
const T_MIN = 170, T_MAX = 720;
const P_MIN = 1, P_MAX = 1e9;

// --- Generate phase boundary curves ---
const sublimData = [];
for (let Tv = 209; Tv <= T_TRIPLE; Tv += 0.3) {
  sublimData.push({ T: Tv, P: P_TRIPLE * Math.exp(L_SUB_R * (1 / T_TRIPLE - 1 / Tv)) });
}

const vapData = [];
for (let Tv = T_TRIPLE; Tv <= T_CRIT; Tv += 0.3) {
  vapData.push({ T: Tv, P: P_TRIPLE * Math.exp(L_VAP_R * (1 / T_TRIPLE - 1 / Tv)) });
}

const meltData = [];
for (let lP = Math.log10(P_TRIPLE); lP <= 9.15; lP += 0.04) {
  const P = Math.pow(10, lP);
  const T = T_TRIPLE + (P - P_TRIPLE) / MELT_SLOPE;
  if (T >= T_MIN && T <= T_MAX) meltData.push({ T, P });
}

// --- SVG ---
const svg = d3.select("#container").append("svg")
  .attr("width", width).attr("height", height);
const g = svg.append("g").attr("transform", `translate(${margin.left},${margin.top})`);

// --- Scales ---
const x = d3.scaleLinear().domain([T_MIN, T_MAX]).range([0, iw]);
const y = d3.scaleLog().base(10).domain([P_MIN, P_MAX]).range([ih, 0]);

// --- Gridlines ---
[1e1, 1e2, 1e3, 1e4, 1e5, 1e6, 1e7, 1e8, 1e9].forEach(p => {
  g.append("line")
    .attr("x1", 0).attr("x2", iw).attr("y1", y(p)).attr("y2", y(p))
    .attr("stroke", t.grid).attr("stroke-width", 1);
});
[200, 250, 300, 350, 400, 450, 500, 550, 600, 650, 700].forEach(temp => {
  g.append("line")
    .attr("x1", x(temp)).attr("x2", x(temp)).attr("y1", 0).attr("y2", ih)
    .attr("stroke", t.grid).attr("stroke-width", 1);
});

// --- Axes ---
const xAx = g.append("g").attr("transform", `translate(0,${ih})`)
  .call(d3.axisBottom(x)
    .tickValues([200, 250, 300, 350, 400, 450, 500, 550, 600, 650, 700])
    .tickSize(6));
xAx.selectAll("text").attr("fill", t.inkSoft).style("font-size", "14px");
xAx.selectAll("line").attr("stroke", t.inkSoft);
xAx.select(".domain").attr("stroke", t.inkSoft);

const yAx = g.append("g")
  .call(d3.axisLeft(y)
    .tickValues([1e1, 1e2, 1e3, 1e4, 1e5, 1e6, 1e7, 1e8, 1e9])
    .tickFormat(d => "10" + toSup(Math.round(Math.log10(d))))
    .tickSize(6));
yAx.selectAll("text").attr("fill", t.inkSoft).style("font-size", "14px");
yAx.selectAll("line").attr("stroke", t.inkSoft);
yAx.select(".domain").attr("stroke", t.inkSoft);

// --- Clip path for boundary curves ---
g.append("clipPath").attr("id", "plot-clip")
  .append("rect").attr("width", iw).attr("height", ih);

// --- Line generator ---
const mkLine = d3.line()
  .x(d => x(d.T))
  .y(d => y(d.P))
  .defined(d => d.T >= T_MIN && d.T <= T_MAX && d.P >= P_MIN && d.P <= P_MAX);

const curves = g.append("g").attr("clip-path", "url(#plot-clip)");

// Imprint palette order: solid-liquid first (#009E73), then liquid-gas, then solid-gas
const boundaries = [
  { data: meltData,   color: t.palette[0], dash: null,  strokeW: 3.5 },  // #009E73 solid-liquid
  { data: vapData,    color: t.palette[1], dash: null,  strokeW: 3.5 },  // #C475FD liquid-gas
  { data: sublimData, color: t.palette[2], dash: "8,4", strokeW: 3   },  // #4467A3 solid-gas
];
boundaries.forEach(b => {
  const path = curves.append("path").datum(b.data)
    .attr("fill", "none")
    .attr("stroke", b.color)
    .attr("stroke-width", b.strokeW)
    .attr("d", mkLine);
  if (b.dash) path.attr("stroke-dasharray", b.dash);
});

// --- Triple point and critical point markers ---
const addMarker = (cx, cy, fill) =>
  g.append("circle").attr("cx", cx).attr("cy", cy).attr("r", 9)
    .attr("fill", fill).attr("stroke", t.pageBg).attr("stroke-width", 3);

addMarker(x(T_TRIPLE), y(P_TRIPLE), t.ink);
addMarker(x(T_CRIT),   y(P_CRIT),   t.palette[3]);  // ochre #BD8233

// --- Point annotations ---
const tpX = x(T_TRIPLE), tpY = y(P_TRIPLE);
g.append("text").attr("x", tpX + 14).attr("y", tpY - 12)
  .attr("fill", t.ink).style("font-size", "14px").style("font-weight", "600")
  .text("Triple point");
g.append("text").attr("x", tpX + 14).attr("y", tpY + 6)
  .attr("fill", t.inkSoft).style("font-size", "14px")
  .text("273.16 K · 612 Pa");

const cpX = x(T_CRIT), cpY = y(P_CRIT);
g.append("text").attr("x", cpX - 14).attr("y", cpY - 12)
  .attr("text-anchor", "end").attr("fill", t.ink)
  .style("font-size", "14px").style("font-weight", "600")
  .text("Critical point");
g.append("text").attr("x", cpX - 14).attr("y", cpY + 6)
  .attr("text-anchor", "end").attr("fill", t.inkSoft)
  .style("font-size", "14px")
  .text("647.1 K · 22.1 MPa");

// --- Phase region labels ---
// Positions verified to lie within each phase region
[
  { T: 225,  P: 5e5,  anchor: "middle", text: "SOLID"          },
  { T: 390,  P: 3e5,  anchor: "middle", text: "LIQUID"         },
  { T: 490,  P: 200,  anchor: "middle", text: "GAS"            },
].forEach(r => {
  g.append("text")
    .attr("x", x(r.T)).attr("y", y(r.P))
    .attr("text-anchor", r.anchor)
    .attr("fill", t.inkSoft)
    .style("font-size", "16px").style("font-weight", "700")
    .style("font-style", "italic").style("opacity", "0.85")
    .text(r.text);
});

// Supercritical fluid label as two tspan lines (combined to avoid disconnect)
const scfX = x(676), scfY = y(1.3e8);
const scfEl = g.append("text")
  .attr("text-anchor", "middle").attr("fill", t.inkSoft)
  .style("font-size", "16px").style("font-weight", "700")
  .style("font-style", "italic").style("opacity", "0.85");
scfEl.append("tspan").attr("x", scfX).attr("y", scfY).text("SUPERCRITICAL");
scfEl.append("tspan").attr("x", scfX).attr("dy", "1.3em").text("FLUID");

// --- Legend (placed in open gas region, lower right) ---
const lx = iw - 20;
const ly0 = ih - 5 * 28 - 20;

const legCurves = [
  { color: t.palette[0], label: "Solid–Liquid (Melting)",     dash: null  },
  { color: t.palette[1], label: "Liquid–Gas (Vaporization)",  dash: null  },
  { color: t.palette[2], label: "Solid–Gas (Sublimation)",    dash: "6,3" },
];
legCurves.forEach((d, i) => {
  const ly = ly0 + i * 28;
  const seg = g.append("line")
    .attr("x1", lx - 28).attr("x2", lx).attr("y1", ly).attr("y2", ly)
    .attr("stroke", d.color).attr("stroke-width", 3.5);
  if (d.dash) seg.attr("stroke-dasharray", d.dash);
  g.append("text").attr("x", lx - 34).attr("y", ly + 5)
    .attr("text-anchor", "end").attr("fill", t.inkSoft)
    .style("font-size", "14px").text(d.label);
});

const legPoints = [
  { fill: t.ink,        label: "Triple point"   },
  { fill: t.palette[3], label: "Critical point" },
];
legPoints.forEach((d, i) => {
  const ly = ly0 + (legCurves.length + i) * 28;
  g.append("circle").attr("cx", lx - 14).attr("cy", ly).attr("r", 6)
    .attr("fill", d.fill).attr("stroke", t.pageBg).attr("stroke-width", 2);
  g.append("text").attr("x", lx - 24).attr("y", ly + 5)
    .attr("text-anchor", "end").attr("fill", t.inkSoft)
    .style("font-size", "14px").text(d.label);
});

// --- Axis labels ---
svg.append("text")
  .attr("x", margin.left + iw / 2).attr("y", height - 22)
  .attr("text-anchor", "middle").attr("fill", t.ink).style("font-size", "16px")
  .text("Temperature (K)");

svg.append("text")
  .attr("transform", `translate(30,${margin.top + ih / 2})rotate(-90)`)
  .attr("text-anchor", "middle").attr("fill", t.ink).style("font-size", "16px")
  .text("Pressure (Pa)");

// --- Title ---
const TITLE = "Water Phase Diagram · phase-diagram-pt · javascript · d3 · anyplot.ai";
const titleFs = Math.max(14, Math.round(22 * Math.min(1.0, 67 / TITLE.length)));
svg.append("text")
  .attr("x", width / 2).attr("y", 50)
  .attr("text-anchor", "middle").attr("fill", t.ink)
  .style("font-size", `${titleFs}px`).style("font-weight", "600")
  .text(TITLE);
Runnable source as JSON, for any HTTP client: https://api.anyplot.ai/specs/phase-diagram-pt/d3/code. Any spec id and library id listed in llms-full.txt fit the same URL shape; every URL below is complete and callable.
{
  "spec_id": "phase-diagram-pt",
  "language": "javascript",
  "library": "d3",
  "page": "https://anyplot.ai/phase-diagram-pt/javascript/d3",
  "hub": "https://anyplot.ai/phase-diagram-pt",
  "code_json": "https://api.anyplot.ai/specs/phase-diagram-pt/d3/code",
  "spec_json": "https://api.anyplot.ai/specs/phase-diagram-pt",
  "render_light_png": "https://storage.googleapis.com/anyplot-images/plots/phase-diagram-pt/javascript/d3/plot-light.png",
  "render_dark_png": "https://storage.googleapis.com/anyplot-images/plots/phase-diagram-pt/javascript/d3/plot-dark.png",
  "interactive_light_html": "https://storage.googleapis.com/anyplot-images/plots/phase-diagram-pt/javascript/d3/plot-light.html",
  "interactive_dark_html": "https://storage.googleapis.com/anyplot-images/plots/phase-diagram-pt/javascript/d3/plot-dark.html",
  "quality_score": 90.0,
  "license": "MIT",
  "guide": "https://anyplot.ai/llms.txt"
}
Part of Thermodynamic Phase Diagram (Pressure-Temperature) on anyplot.ai.