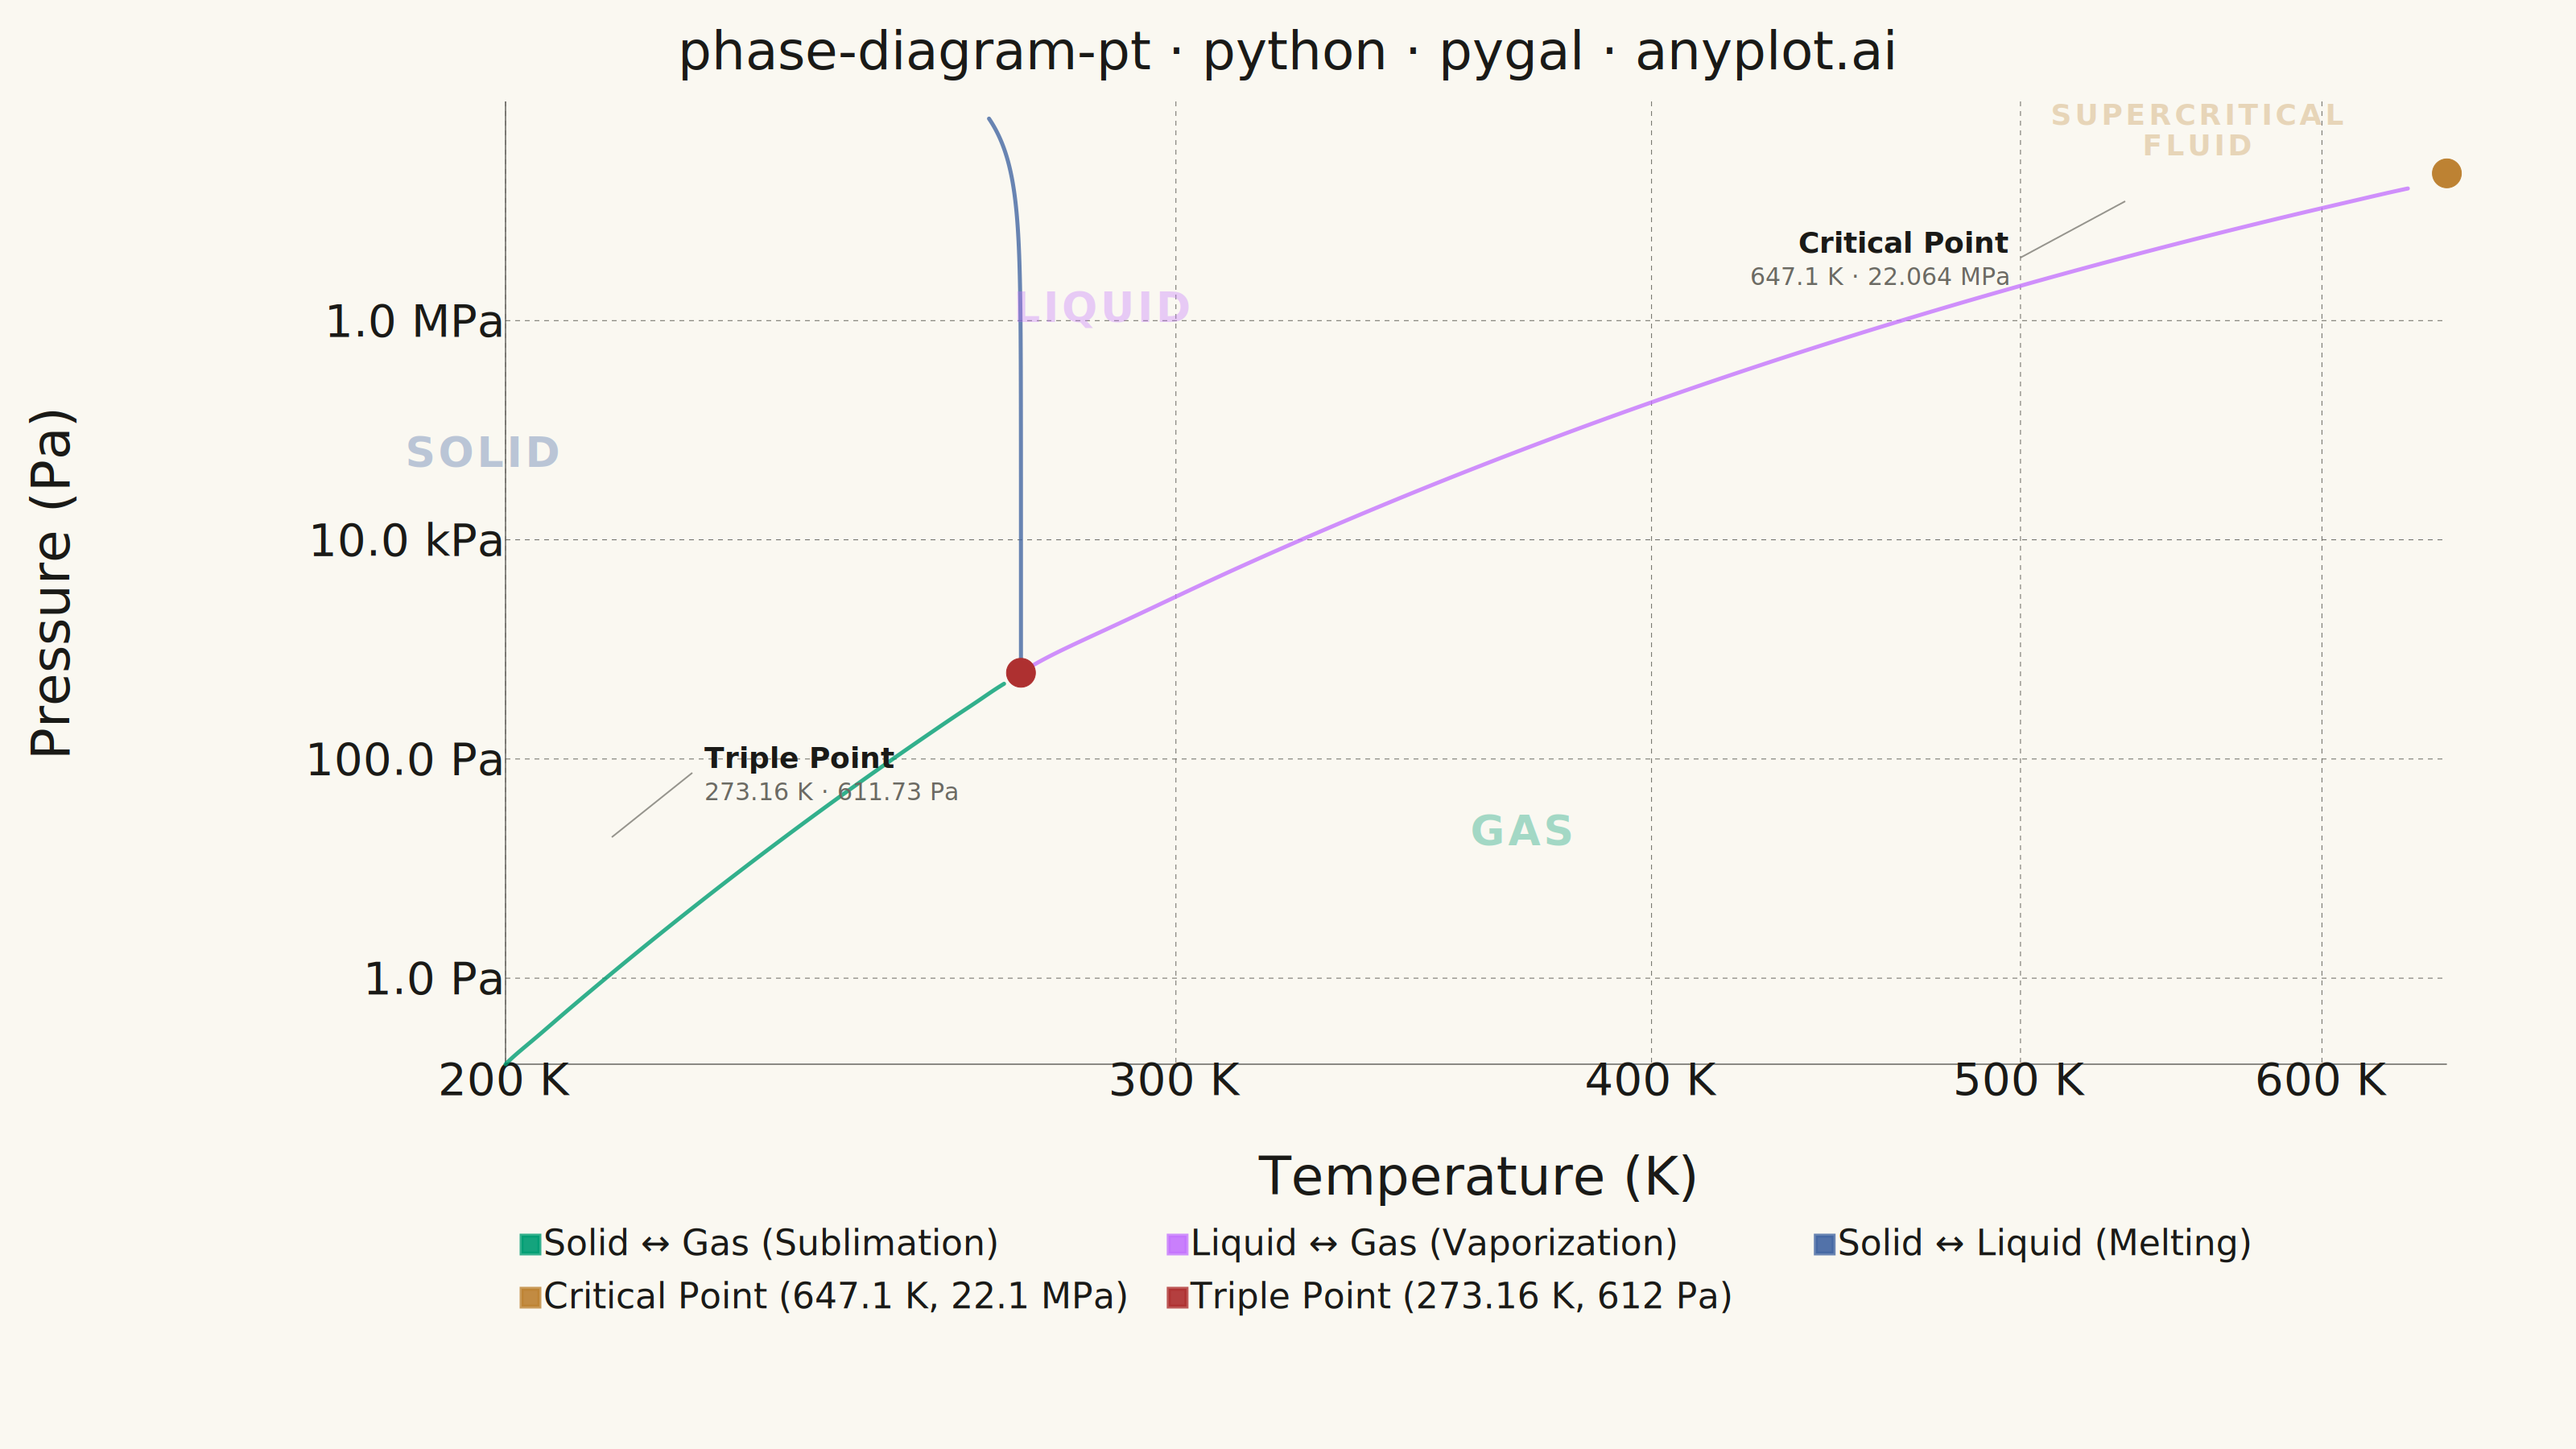
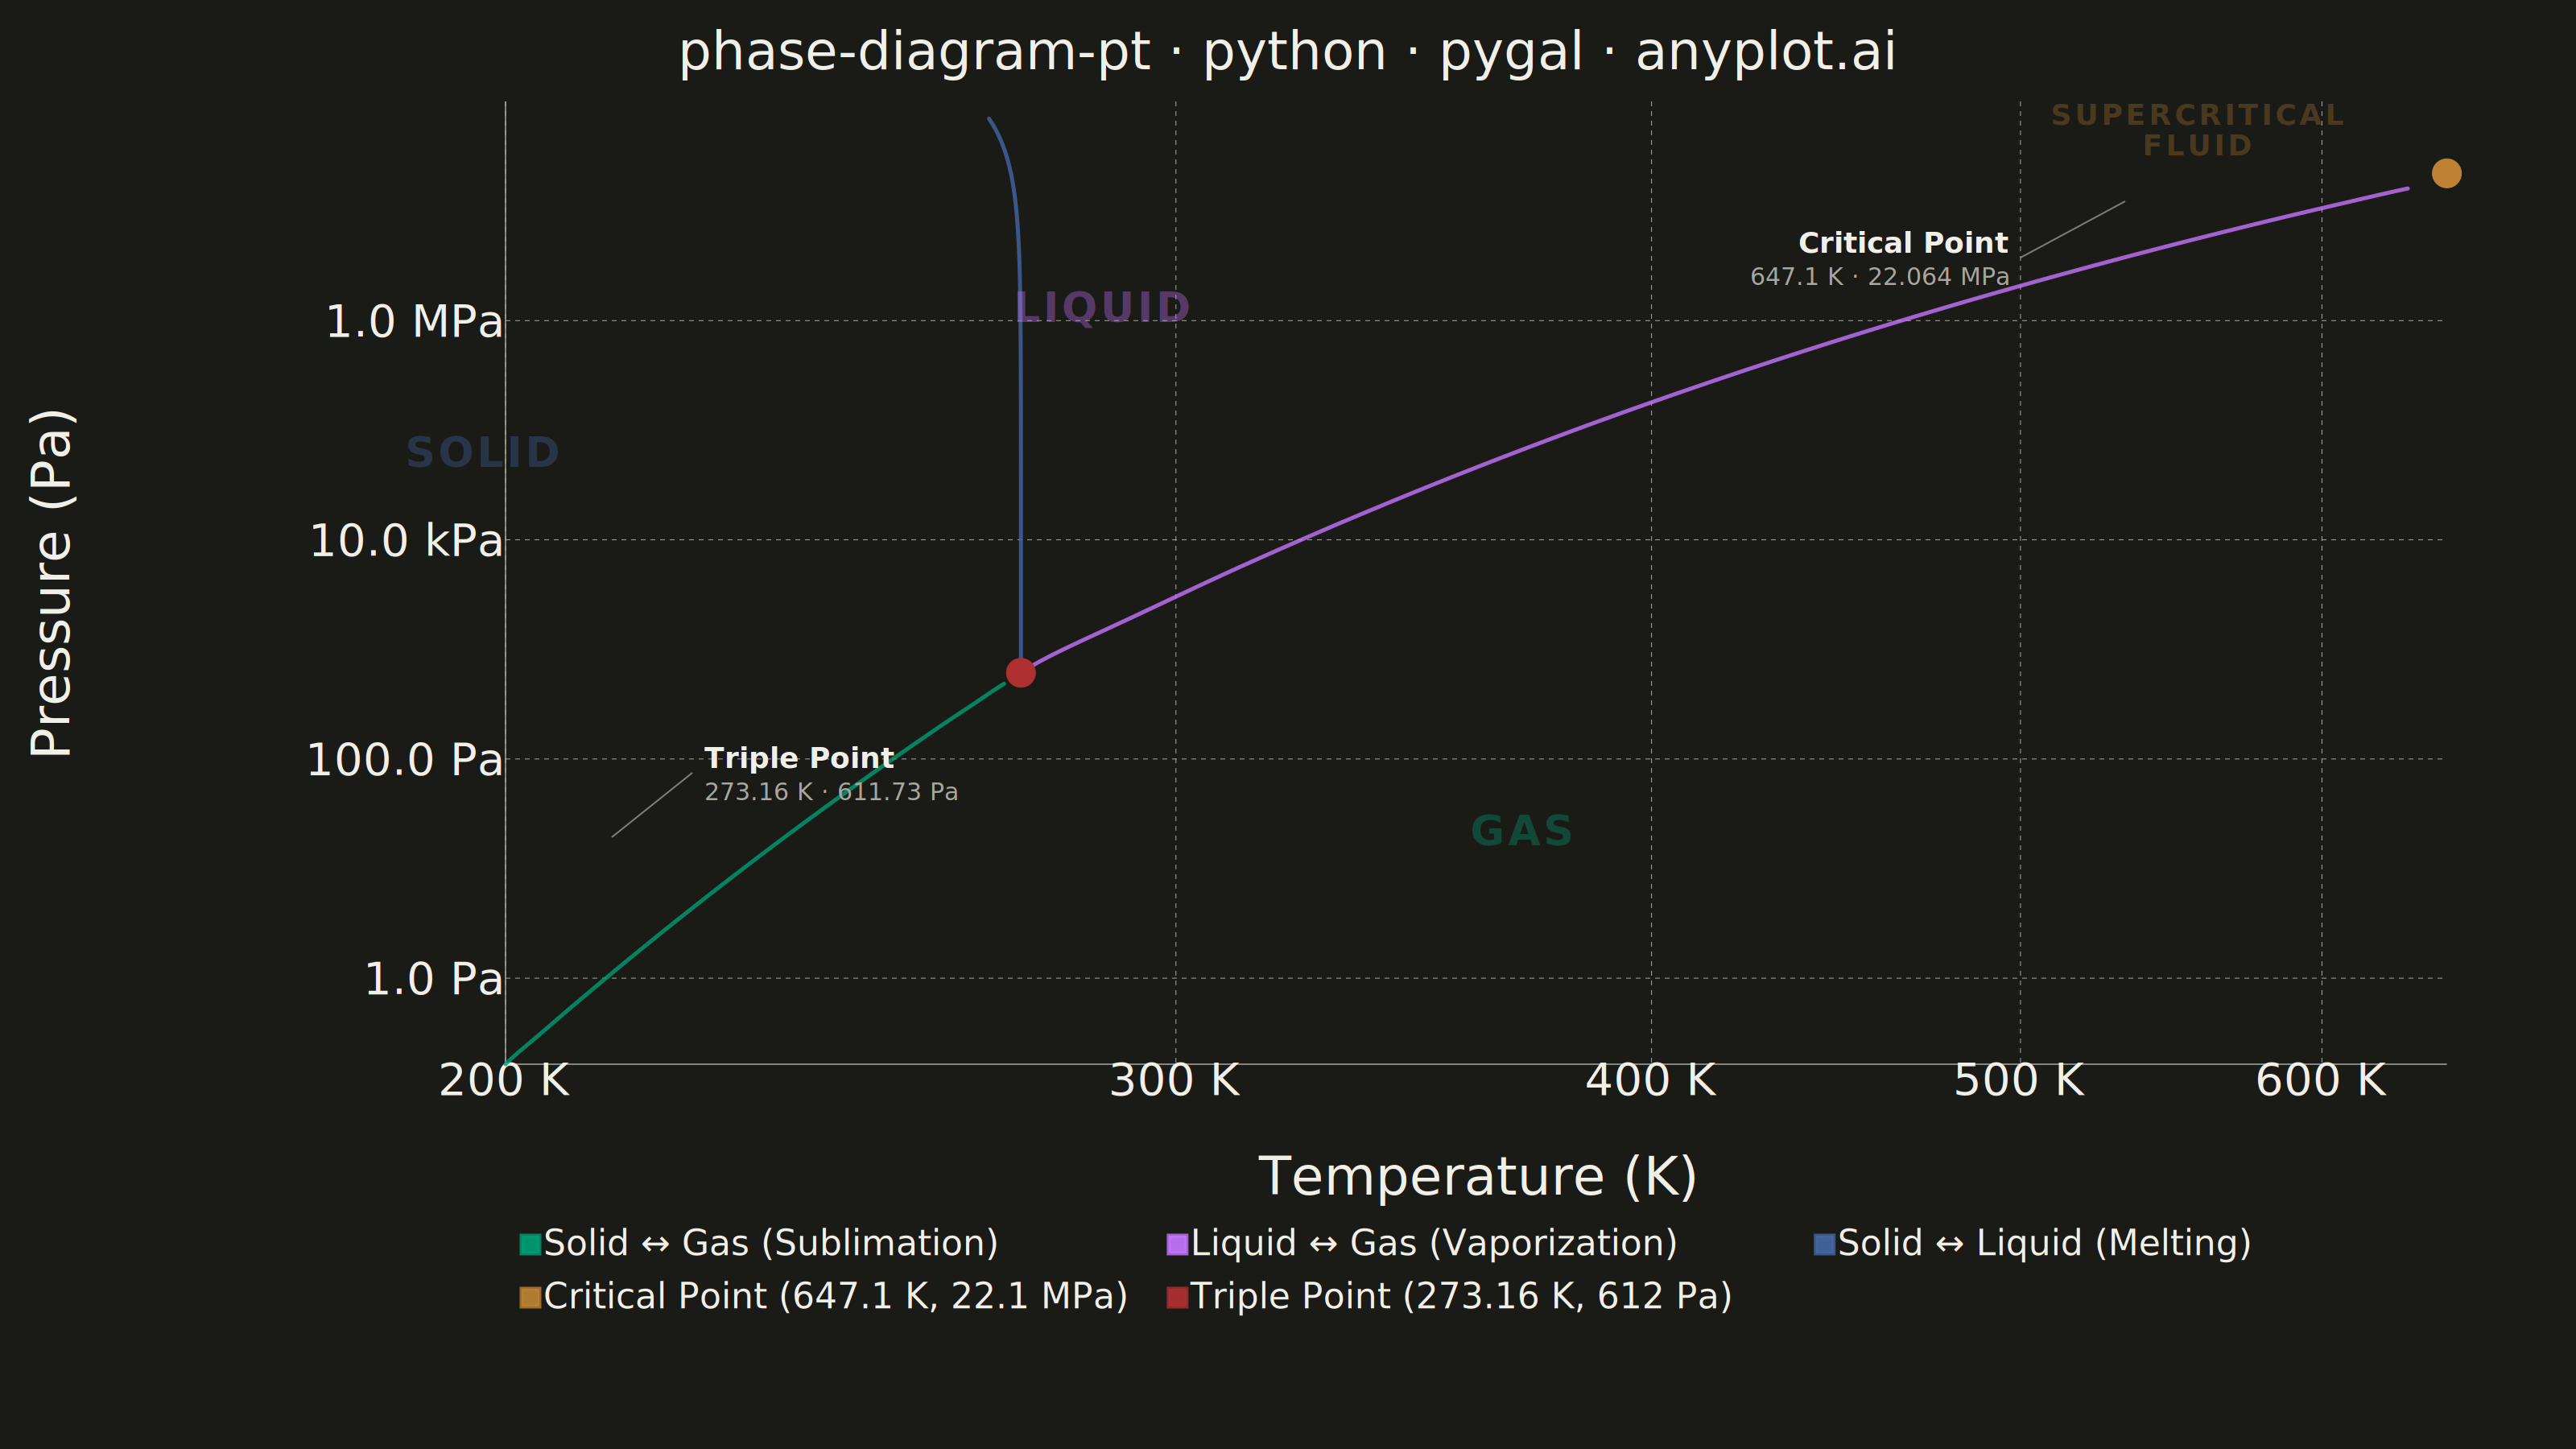
A pressure-temperature (P-T) phase diagram showing the boundaries between solid, liquid, and gas phases of a substance. The diagram includes the triple point where all three phases coexist and the critical point beyond which the liquid-gas distinction vanishes. This is one of the most fundamental diagrams in chemistry and physics, essential for understanding phase transitions and states of matter.
""" anyplot.ai
phase-diagram-pt: Thermodynamic Phase Diagram (Pressure-Temperature)
Library: pygal 3.1.0 | Python 3.13.13
Quality: 90/100 | Updated: 2026-06-08
"""

# Ensure we import the installed pygal package, not this file
import importlib.util
import os
import sys
import xml.etree.ElementTree as ET

import cairosvg
import numpy as np


pygal_spec = importlib.util.find_spec("pygal")
if pygal_spec and pygal_spec.origin != __file__:
    import pygal
    from pygal.style import Style
else:
    _cwd = os.getcwd()
    sys.path = [p for p in sys.path if os.path.abspath(p) != _cwd]
    try:
        import pygal
        from pygal.style import Style
    finally:
        sys.path.insert(0, _cwd)

THEME = os.getenv("ANYPLOT_THEME", "light")
PAGE_BG = "#FAF8F1" if THEME == "light" else "#1A1A17"
INK = "#1A1A17" if THEME == "light" else "#F0EFE8"
INK_MUTED = "#6B6A63" if THEME == "light" else "#A8A79F"

# Imprint palette — theme-independent categorical colors
IMPRINT_PALETTE = ("#009E73", "#C475FD", "#4467A3", "#BD8233", "#AE3030", "#2ABCCD", "#954477", "#99B314")

# Water phase diagram (physically accurate constants)
triple_t = 273.16  # K
triple_p = 611.73  # Pa
critical_t = 647.1  # K
critical_p = 22.064e6  # Pa
R = 8.314  # J/(mol·K)

# Sublimation curve (Solid-Gas): from 200 K to triple point
sublimation_temps = np.linspace(200, triple_t, 80)
L_sub = 51059  # J/mol — sublimation enthalpy of water
sublimation_pressures = triple_p * np.exp((L_sub / R) * (1 / triple_t - 1 / sublimation_temps))

# Vaporization curve (Liquid-Gas): from triple point to critical point
vaporization_temps = np.linspace(triple_t, critical_t, 100)
L_vap = 40700  # J/mol — vaporization enthalpy of water
vaporization_pressures = triple_p * np.exp((L_vap / R) * (1 / triple_t - 1 / vaporization_temps))

# Melting curve (Solid-Liquid): water has anomalous negative slope
melting_pressures = np.logspace(np.log10(triple_p), np.log10(critical_p * 5), 80)
melting_temps = triple_t - (melting_pressures - triple_p) * 7.5e-8


# Pressure formatter — handles scalar and (x, y) tuple passed by pygal's XY formatter
def fmt_p(v):
    p = v[1] if isinstance(v, (list, tuple)) else v
    return f"{p / 1e6:.1f} MPa" if p >= 1e6 else (f"{p / 1e3:.1f} kPa" if p >= 1e3 else f"{p:.1f} Pa")


# Title: 46 chars < 67 baseline → no scaling needed, use default 66
title = "phase-diagram-pt · python · pygal · anyplot.ai"

custom_style = Style(
    background=PAGE_BG,
    plot_background=PAGE_BG,
    foreground=INK,
    foreground_strong=INK,
    foreground_subtle=INK_MUTED,
    colors=IMPRINT_PALETTE,
    font_family="DejaVu Sans, Helvetica, Arial, sans-serif",
    title_font_family="DejaVu Sans, Helvetica, Arial, sans-serif",
    title_font_size=66,
    label_font_size=56,
    major_label_font_size=44,
    value_font_size=36,
    legend_font_size=44,
    legend_font_family="DejaVu Sans, Helvetica, Arial, sans-serif",
    label_font_family="DejaVu Sans, Helvetica, Arial, sans-serif",
    major_label_font_family="DejaVu Sans, Helvetica, Arial, sans-serif",
    value_font_family="DejaVu Sans, Helvetica, Arial, sans-serif",
    stroke_width=5,
    opacity=0.92,
    opacity_hover=1.0,
    guide_stroke_color=INK_MUTED,
    guide_stroke_dasharray="6,6",
    tooltip_font_size=36,
    tooltip_font_family="DejaVu Sans, Helvetica, Arial, sans-serif",
    tooltip_border_radius=8,
)

chart = pygal.XY(
    width=3200,
    height=1800,
    style=custom_style,
    title=title,
    x_title="Temperature (K)",
    y_title="Pressure (Pa)",
    show_legend=True,
    legend_at_bottom=True,
    legend_box_size=22,
    dots_size=2,
    stroke=True,
    show_x_guides=True,
    show_y_guides=True,
    logarithmic=True,
    explicit_size=True,
    truncate_legend=-1,
    spacing=20,
    margin=40,
    margin_bottom=120,
    margin_left=220,
    margin_right=160,
    tooltip_fancy_mode=True,
    tooltip_border_radius=8,
    interpolate="cubic",
    interpolation_precision=200,
    xrange=(180, 720),
    print_values=False,
    human_readable=True,
    x_value_formatter=lambda x: f"{x:.0f} K",
    value_formatter=fmt_p,
    y_labels=[1, 100, 1e4, 1e6, 1e8],
    y_label_rotation=0,
)

# Series 1–3: phase boundary curves — Imprint positions 1 (green), 2 (lavender), 3 (blue)
sublimation_points = [
    {"value": (float(t), float(p)), "label": f"Sublimation: {t:.0f} K, {fmt_p(p)}"}
    for t, p in zip(sublimation_temps[::4], sublimation_pressures[::4], strict=True)
]
chart.add(
    "Solid ↔ Gas (Sublimation)",
    sublimation_points,
    show_dots=False,
    stroke_style={"width": 8, "linecap": "round", "linejoin": "round"},
    formatter=fmt_p,
)

vaporization_points = [
    {"value": (float(t), float(p)), "label": f"Vaporization: {t:.0f} K, {fmt_p(p)}"}
    for t, p in zip(vaporization_temps[::5], vaporization_pressures[::5], strict=True)
]
chart.add(
    "Liquid ↔ Gas (Vaporization)",
    vaporization_points,
    show_dots=False,
    stroke_style={"width": 8, "linecap": "round", "linejoin": "round"},
    formatter=fmt_p,
)

melting_points = [
    {"value": (float(t), float(p)), "label": f"Melting: {t:.2f} K, {fmt_p(p)}"}
    for t, p in zip(melting_temps[::4], melting_pressures[::4], strict=True)
]
chart.add(
    "Solid ↔ Liquid (Melting)",
    melting_points,
    show_dots=False,
    stroke_style={"width": 8, "linecap": "round", "linejoin": "round"},
    formatter=fmt_p,
)

# Landmark points — series order controls legend swatch via palette cycling.
# Series 4 → palette[3] = ochre #BD8233 → Critical Point (no per-point override needed)
# Series 5 → palette[4] = matte red #AE3030 → Triple Point (no per-point override needed)
chart.add(
    f"Critical Point ({critical_t} K, {fmt_p(critical_p)})",
    [
        {
            "value": (float(critical_t), float(critical_p)),
            "label": f"Critical Point — liquid-gas distinction vanishes\n{critical_t} K, {fmt_p(critical_p)}",
        }
    ],
    dots_size=18,
    stroke=False,
    formatter=fmt_p,
)

chart.add(
    f"Triple Point ({triple_t} K, {triple_p:.0f} Pa)",
    [
        {
            "value": (float(triple_t), float(triple_p)),
            "label": f"Triple Point — all three phases coexist\n{triple_t} K, {triple_p:.0f} Pa",
        }
    ],
    dots_size=18,
    stroke=False,
    formatter=fmt_p,
)

# SVG post-processing: frame removal, phase region labels, callout annotations
svg_string = chart.render(is_unicode=True)
root = ET.fromstring(svg_string)
ns = "http://www.w3.org/2000/svg"

# Remove default chart frame border via CSS override
style_elems = root.findall(f".//{{{ns}}}style")
frame_css = "\nrect.background { stroke: none !important; stroke-width: 0 !important; }"
if style_elems:
    style_elems[0].text = (style_elems[0].text or "") + frame_css

# Phase region labels — semi-transparent, color-coded by boundary membership
phase_labels = [
    {"text": "SOLID", "x": "600", "y": "580", "size": "52", "color": IMPRINT_PALETTE[2], "opacity": "0.35"},
    {"text": "LIQUID", "x": "1370", "y": "400", "size": "52", "color": IMPRINT_PALETTE[1], "opacity": "0.35"},
    {"text": "GAS", "x": "1890", "y": "1050", "size": "52", "color": IMPRINT_PALETTE[0], "opacity": "0.35"},
    {"text": "SUPERCRITICAL", "x": "2730", "y": "155", "size": "36", "color": IMPRINT_PALETTE[3], "opacity": "0.30"},
    {"text": "FLUID", "x": "2730", "y": "193", "size": "36", "color": IMPRINT_PALETTE[3], "opacity": "0.30"},
]

for lbl in phase_labels:
    el = ET.SubElement(root, f"{{{ns}}}text")
    el.set("x", lbl["x"])
    el.set("y", lbl["y"])
    el.set(
        "style",
        f"font-family:DejaVu Sans,Helvetica,Arial,sans-serif;"
        f"font-size:{lbl['size']}px;fill:{lbl['color']};font-weight:700;"
        f"letter-spacing:4px;opacity:{lbl['opacity']};text-anchor:middle;",
    )
    el.text = lbl["text"]

# Callout annotations for thermodynamic landmarks
# Triple point: approx SVG (760, 1040) — callout to upper-right
# Critical point: approx SVG (2640, 250) — callout to lower-left
callouts = [
    # (x_dot, y_dot, x_end, y_end, x_txt, y_txt1, y_txt2, label, sublabel, anchor)
    (760, 1040, 860, 960, 875, 954, 994, "Triple Point", "273.16 K  ·  611.73 Pa", "start"),
    (2640, 250, 2510, 320, 2495, 314, 354, "Critical Point", "647.1 K  ·  22.064 MPa", "end"),
]
for x_d, y_d, x2, y2, x_t, y_t1, y_t2, label, sublabel, anchor in callouts:
    g = ET.SubElement(root, f"{{{ns}}}g")
    ln = ET.SubElement(g, f"{{{ns}}}line")
    ln.set("x1", str(x_d))
    ln.set("y1", str(y_d))
    ln.set("x2", str(x2))
    ln.set("y2", str(y2))
    ln.set("style", f"stroke:{INK_MUTED};stroke-width:2;opacity:0.7;")
    t1 = ET.SubElement(g, f"{{{ns}}}text")
    t1.set("x", str(x_t))
    t1.set("y", str(y_t1))
    t1.set(
        "style",
        f"font-family:DejaVu Sans,Helvetica,Arial,sans-serif;"
        f"font-size:36px;fill:{INK};font-weight:600;text-anchor:{anchor};",
    )
    t1.text = label
    t2 = ET.SubElement(g, f"{{{ns}}}text")
    t2.set("x", str(x_t))
    t2.set("y", str(y_t2))
    t2.set(
        "style",
        f"font-family:DejaVu Sans,Helvetica,Arial,sans-serif;"
        f"font-size:30px;fill:{INK_MUTED};font-weight:400;text-anchor:{anchor};",
    )
    t2.text = sublabel

modified_svg = ET.tostring(root, encoding="unicode")

cairosvg.svg2png(
    bytestring=modified_svg.encode("utf-8"), write_to=f"plot-{THEME}.png", output_width=3200, output_height=1800
)

chart.render_to_file(f"plot-{THEME}.html")
Runnable source as JSON, for any HTTP client: https://api.anyplot.ai/specs/phase-diagram-pt/pygal/code. Any spec id and library id listed in llms-full.txt fit the same URL shape; every URL below is complete and callable.
{
  "spec_id": "phase-diagram-pt",
  "language": "python",
  "library": "pygal",
  "page": "https://anyplot.ai/phase-diagram-pt/python/pygal",
  "hub": "https://anyplot.ai/phase-diagram-pt",
  "code_json": "https://api.anyplot.ai/specs/phase-diagram-pt/pygal/code",
  "spec_json": "https://api.anyplot.ai/specs/phase-diagram-pt",
  "render_light_png": "https://storage.googleapis.com/anyplot-images/plots/phase-diagram-pt/python/pygal/plot-light.png",
  "render_dark_png": "https://storage.googleapis.com/anyplot-images/plots/phase-diagram-pt/python/pygal/plot-dark.png",
  "interactive_light_html": "https://storage.googleapis.com/anyplot-images/plots/phase-diagram-pt/python/pygal/plot-light.html",
  "interactive_dark_html": "https://storage.googleapis.com/anyplot-images/plots/phase-diagram-pt/python/pygal/plot-dark.html",
  "quality_score": 90.0,
  "license": "MIT",
  "guide": "https://anyplot.ai/llms.txt"
}
Part of Thermodynamic Phase Diagram (Pressure-Temperature) on anyplot.ai.