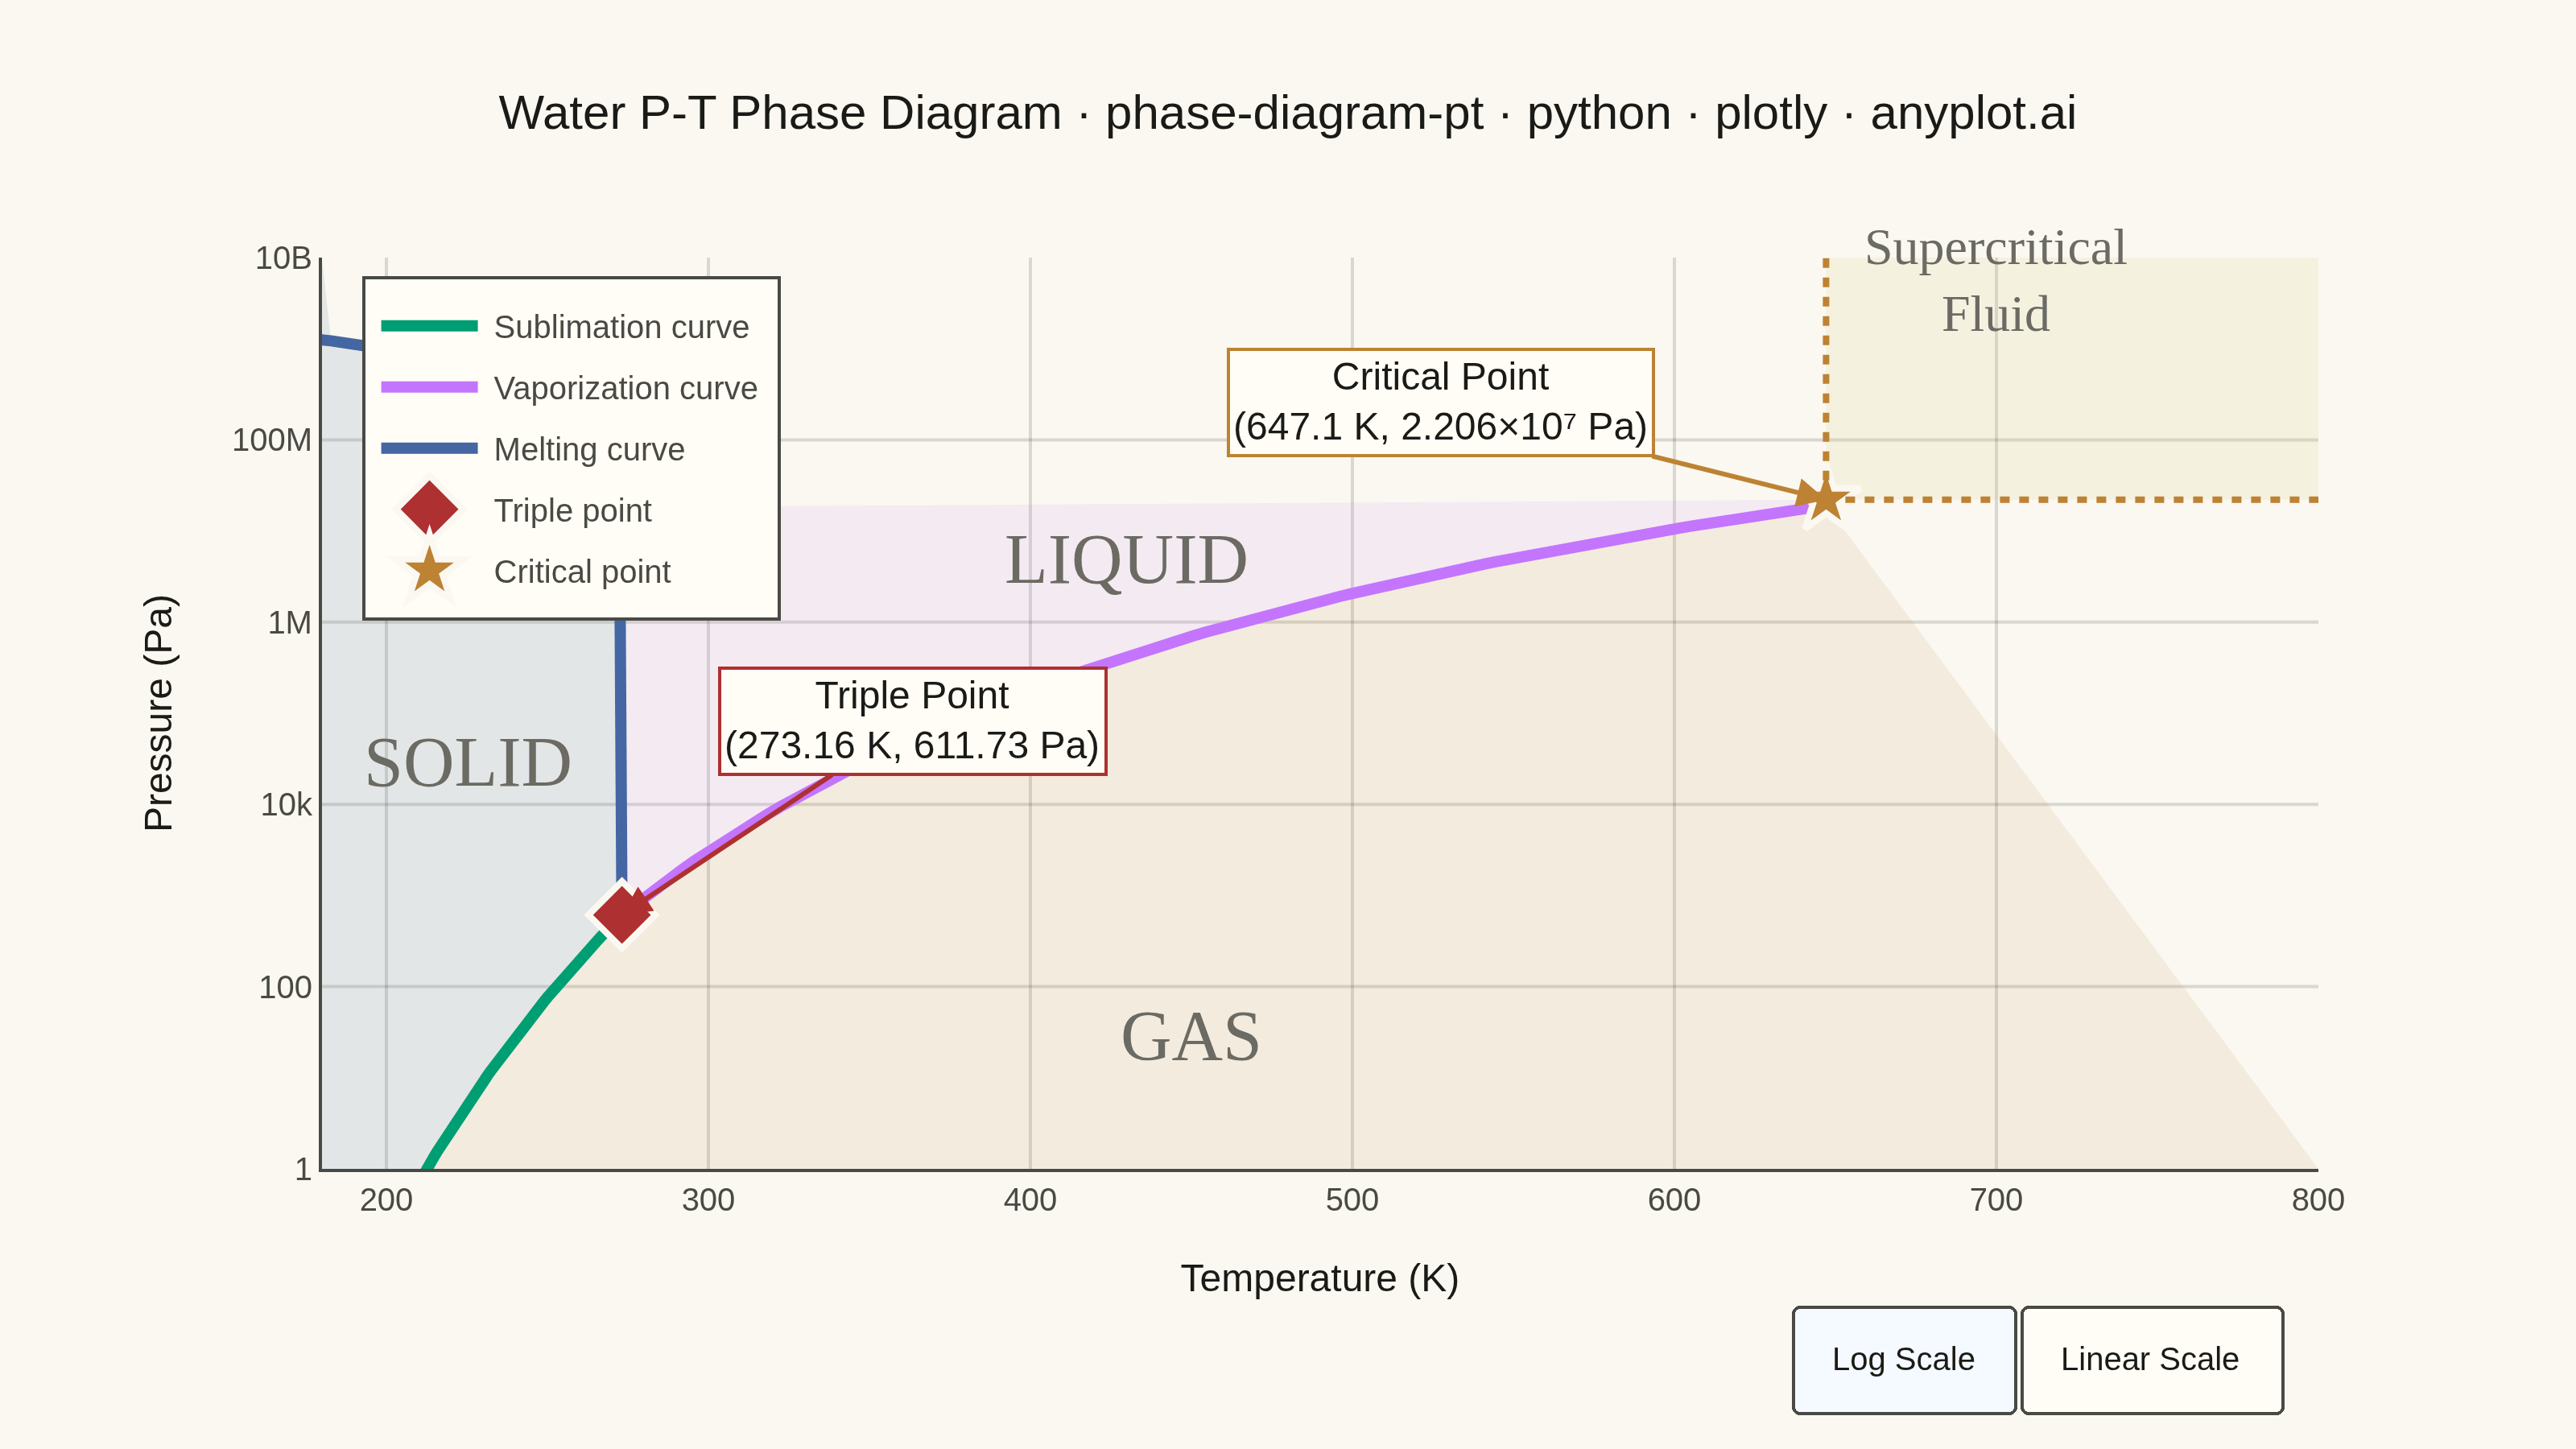
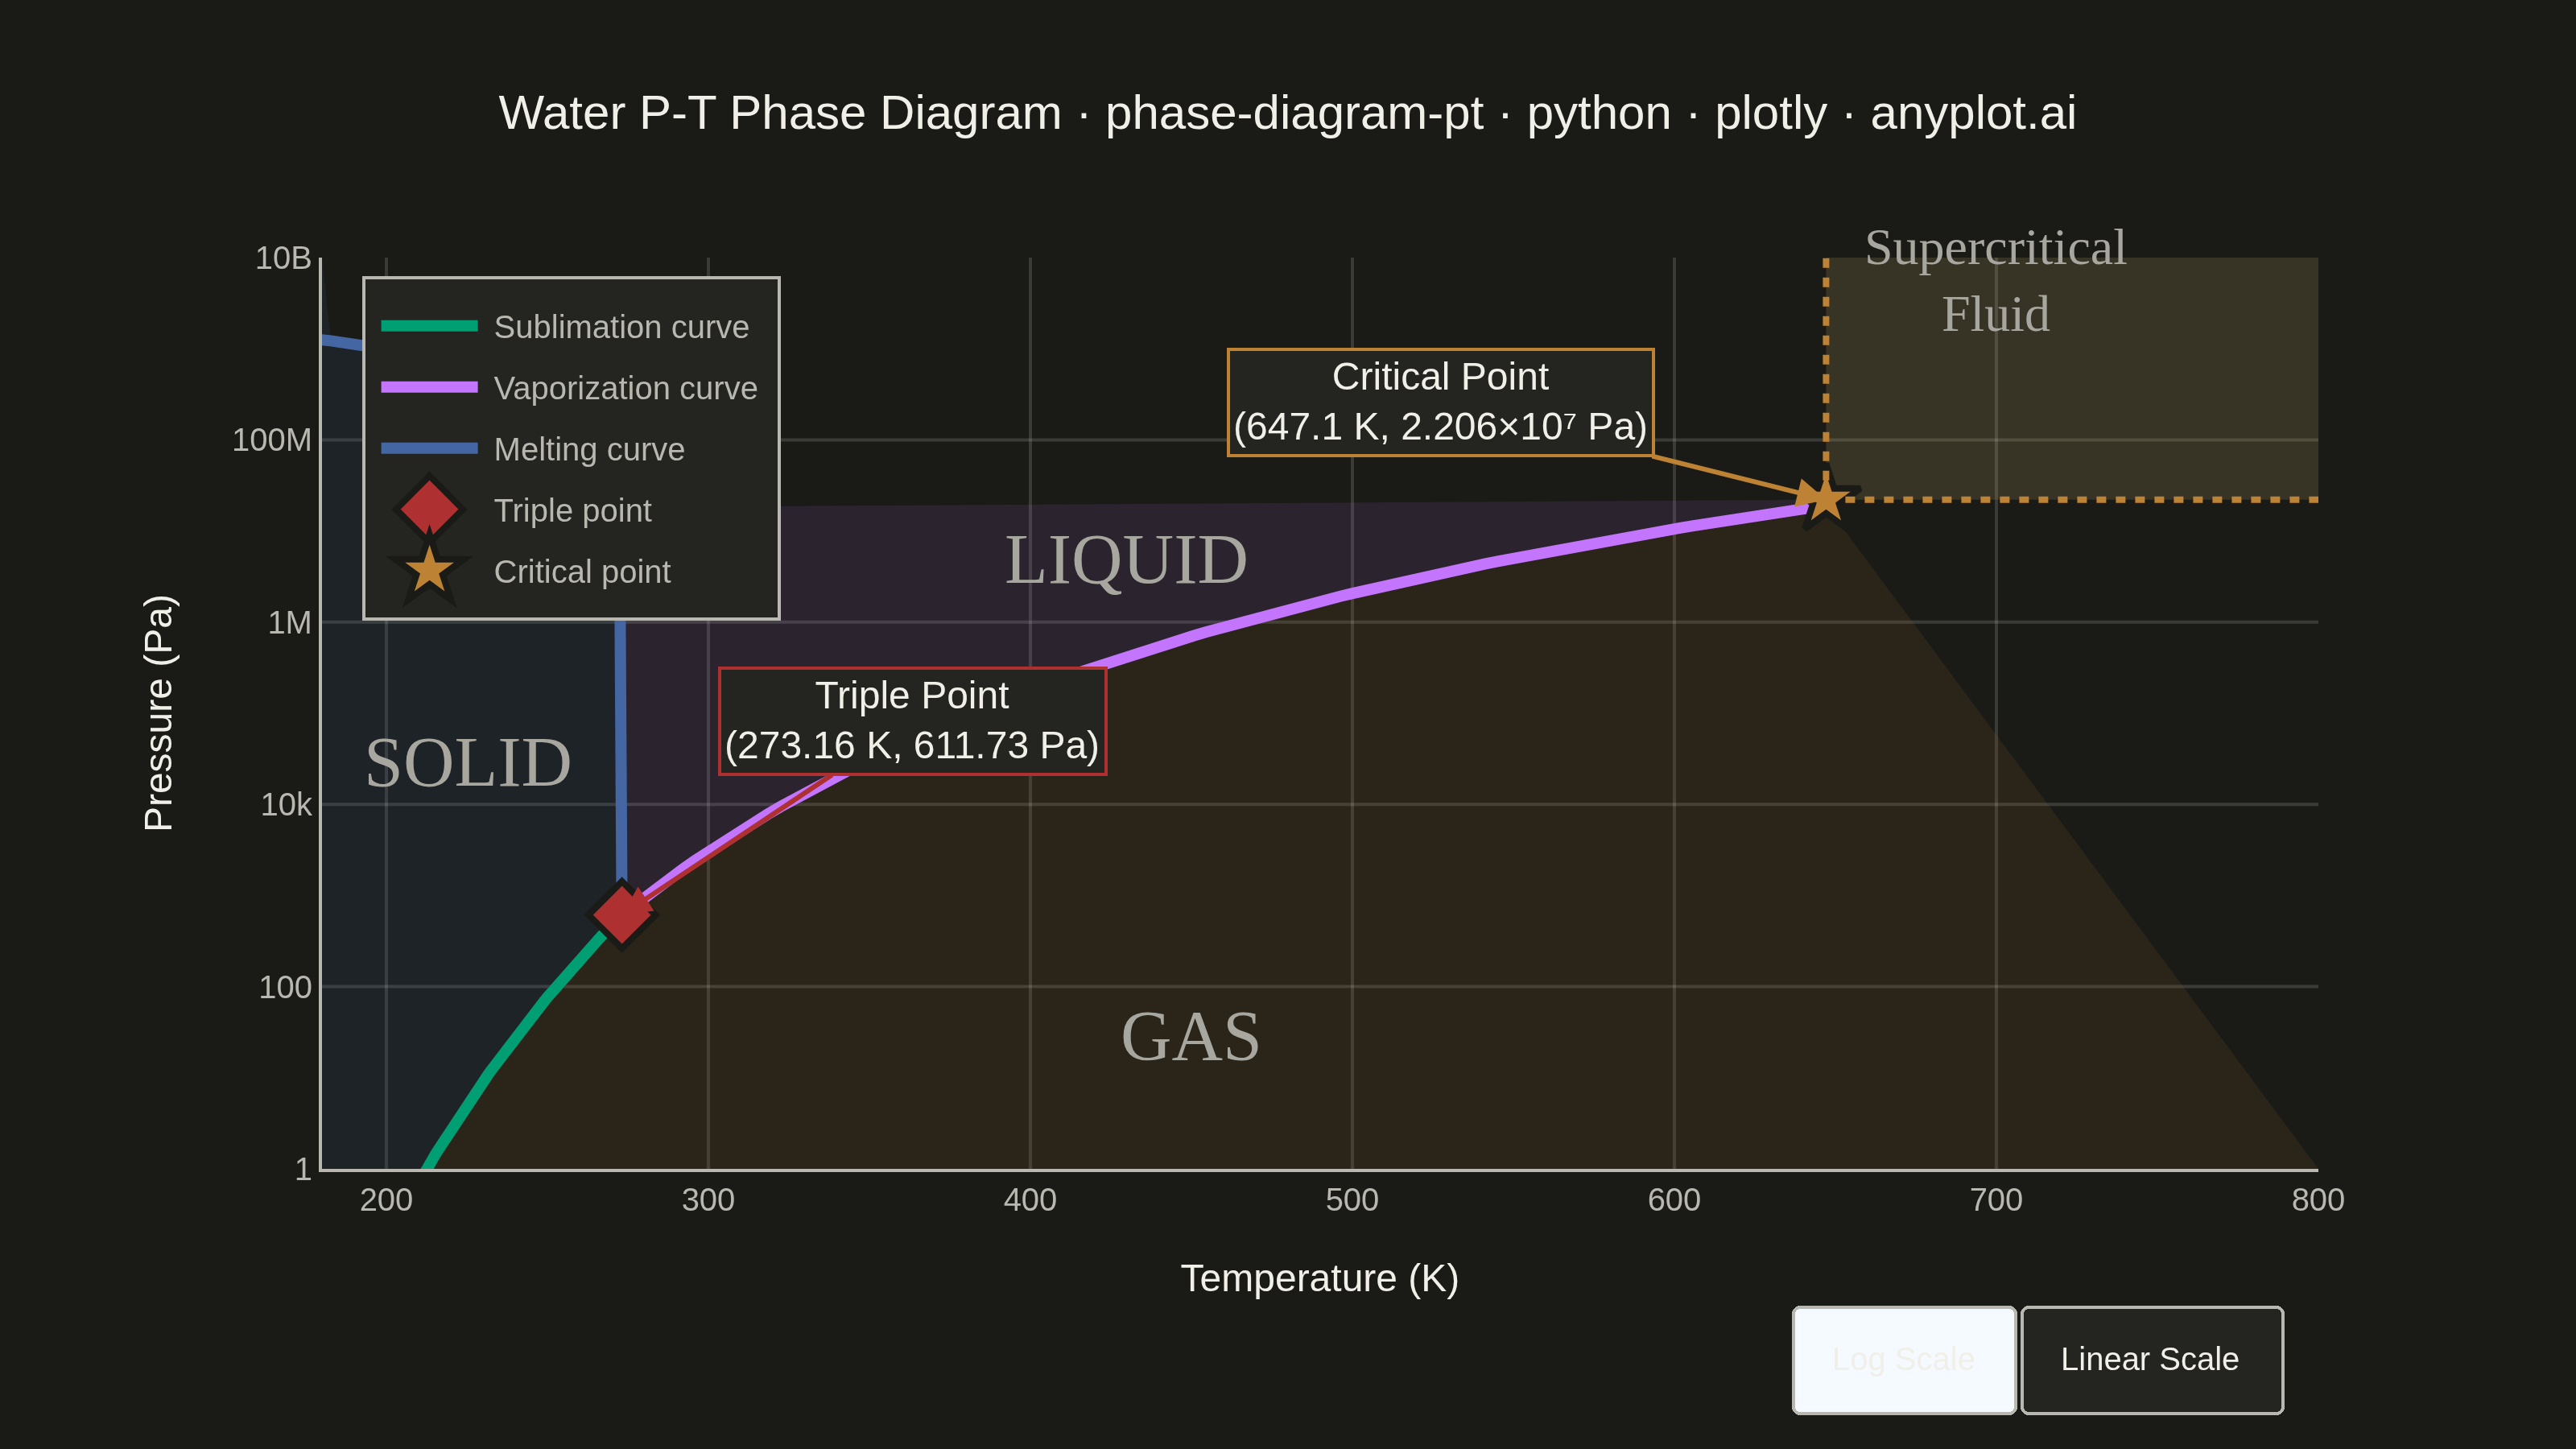
A pressure-temperature (P-T) phase diagram showing the boundaries between solid, liquid, and gas phases of a substance. The diagram includes the triple point where all three phases coexist and the critical point beyond which the liquid-gas distinction vanishes. This is one of the most fundamental diagrams in chemistry and physics, essential for understanding phase transitions and states of matter.
""" anyplot.ai
phase-diagram-pt: Thermodynamic Phase Diagram (Pressure-Temperature)
Library: plotly 6.8.0 | Python 3.13.13
Quality: 91/100 | Updated: 2026-06-08
"""

import os

import numpy as np
import plotly.graph_objects as go


# Theme tokens (see prompts/default-style-guide.md)
THEME = os.getenv("ANYPLOT_THEME", "light")
PAGE_BG = "#FAF8F1" if THEME == "light" else "#1A1A17"
ELEVATED_BG = "#FFFDF6" if THEME == "light" else "#242420"
INK = "#1A1A17" if THEME == "light" else "#F0EFE8"
INK_SOFT = "#4A4A44" if THEME == "light" else "#B8B7B0"
INK_MUTED = "#6B6A63" if THEME == "light" else "#A8A79F"
GRID = "rgba(26,26,23,0.15)" if THEME == "light" else "rgba(240,239,232,0.15)"

# Imprint palette — hybrid-v3 canonical order
IMPRINT = ["#009E73", "#C475FD", "#4467A3", "#BD8233", "#AE3030", "#2ABCCD", "#954477", "#99B314"]

# Data — Water phase diagram with real Clausius-Clapeyron constants
# Triple point: 273.16 K, 611.73 Pa | Critical point: 647.096 K, 22.064 MPa
triple_T = 273.16
triple_P = 611.73
critical_T = 647.096
critical_P = 22.064e6
R = 8.314  # J/(mol·K)

# Solid-gas boundary (sublimation curve) — triple point down to 200 K
T_solid_gas = np.linspace(200, triple_T, 80)
L_sub = 51059  # J/mol (sublimation enthalpy of water)
P_solid_gas = triple_P * np.exp((L_sub / R) * (1 / triple_T - 1 / T_solid_gas))

# Liquid-gas boundary (vaporization curve) — triple point to critical point
T_liquid_gas = np.linspace(triple_T, critical_T, 100)
L_vap = 40670  # J/mol (vaporization enthalpy of water)
P_liquid_gas = triple_P * np.exp((L_vap / R) * (1 / triple_T - 1 / T_liquid_gas))

# Solid-liquid boundary (melting curve) — negative slope unique to water
P_solid_liquid = np.logspace(np.log10(triple_P), np.log10(1e10), 80)
dT_dP = -7.4e-8  # K/Pa (anomalous negative slope for water)
T_solid_liquid = triple_T + dT_dP * (P_solid_liquid - triple_P)

# Axis bounds
x_min, x_max = 180, 800
y_log_min, y_log_max = 0, 10  # log10(Pa)

# Title font size — scale down for long title
title_str = "Water P-T Phase Diagram · phase-diagram-pt · python · plotly · anyplot.ai"
n = len(title_str)
title_fs = max(11, round(16 * (67 / n if n > 67 else 1.0)))

# Plot
fig = go.Figure()

# Phase region fills using Imprint palette at low opacity
# GAS region — below sublimation and vaporization curves
gas_T = np.concatenate([[x_min], T_solid_gas, T_liquid_gas, [x_max, x_max, x_min]])
gas_P = np.concatenate([[10**y_log_min], P_solid_gas, P_liquid_gas, [10**y_log_min, 10**y_log_min, 10**y_log_min]])
fig.add_trace(
    go.Scatter(
        x=gas_T,
        y=gas_P,
        fill="toself",
        mode="lines",
        line={"width": 0},
        fillcolor="rgba(189,130,51,0.10)",  # Imprint ochre #BD8233 — warm/gas
        showlegend=False,
        hoverinfo="skip",
    )
)

# SOLID region — left of melting curve, above sublimation curve
solid_T = np.concatenate([T_solid_gas[::-1], [x_min, x_min], T_solid_liquid[T_solid_liquid >= x_min][::-1]])
solid_P = np.concatenate(
    [P_solid_gas[::-1], [P_solid_gas[0], 10**y_log_max], P_solid_liquid[T_solid_liquid >= x_min][::-1]]
)
fig.add_trace(
    go.Scatter(
        x=solid_T,
        y=solid_P,
        fill="toself",
        mode="lines",
        line={"width": 0},
        fillcolor="rgba(68,103,163,0.12)",  # Imprint blue #4467A3 — cold/solid
        showlegend=False,
        hoverinfo="skip",
    )
)

# LIQUID region — between melting and vaporization curves
liquid_mask = (T_solid_liquid >= x_min) & (P_solid_liquid <= critical_P)
liquid_T = np.concatenate([T_liquid_gas, [critical_T], T_solid_liquid[liquid_mask][::-1]])
liquid_P = np.concatenate([P_liquid_gas, [critical_P], P_solid_liquid[liquid_mask][::-1]])
fig.add_trace(
    go.Scatter(
        x=liquid_T,
        y=liquid_P,
        fill="toself",
        mode="lines",
        line={"width": 0},
        fillcolor="rgba(196,117,253,0.10)",  # Imprint lavender #C475FD — liquid
        showlegend=False,
        hoverinfo="skip",
    )
)

# Supercritical region — above and right of critical point
fig.add_trace(
    go.Scatter(
        x=[critical_T, x_max, x_max, critical_T, critical_T],
        y=[critical_P, critical_P, 10**y_log_max, 10**y_log_max, critical_P],
        fill="toself",
        mode="lines",
        line={"width": 0},
        fillcolor="rgba(221,204,119,0.15)",  # Imprint amber #DDCC77 — supercritical
        showlegend=False,
        hoverinfo="skip",
    )
)

# Phase boundary curves — Imprint palette positions 1→3
fig.add_trace(
    go.Scatter(
        x=T_solid_gas,
        y=P_solid_gas,
        mode="lines",
        line={"color": IMPRINT[0], "width": 3.5},  # #009E73 green — sublimation
        name="Sublimation curve",
        hovertemplate="<b>Sublimation</b><br>T: %{x:.1f} K<br>P: %{y:.2e} Pa<extra></extra>",
    )
)

fig.add_trace(
    go.Scatter(
        x=T_liquid_gas,
        y=P_liquid_gas,
        mode="lines",
        line={"color": IMPRINT[1], "width": 3.5},  # #C475FD lavender — vaporization
        name="Vaporization curve",
        hovertemplate="<b>Vaporization</b><br>T: %{x:.1f} K<br>P: %{y:.2e} Pa<extra></extra>",
    )
)

fig.add_trace(
    go.Scatter(
        x=T_solid_liquid,
        y=P_solid_liquid,
        mode="lines",
        line={"color": IMPRINT[2], "width": 3.5},  # #4467A3 blue — melting
        name="Melting curve",
        hovertemplate="<b>Melting</b><br>T: %{x:.1f} K<br>P: %{y:.2e} Pa<extra></extra>",
    )
)

# Triple point marker — Imprint matte red (semantic: special critical state)
fig.add_trace(
    go.Scatter(
        x=[triple_T],
        y=[triple_P],
        mode="markers",
        marker={
            "size": 16,
            "color": IMPRINT[4],  # #AE3030 matte red
            "symbol": "diamond",
            "line": {"color": PAGE_BG, "width": 2},
        },
        name="Triple point",
        hovertemplate="Triple Point<br>T: 273.16 K<br>P: 611.73 Pa<extra></extra>",
    )
)

# Critical point marker — Imprint ochre (warm, distinct from red)
fig.add_trace(
    go.Scatter(
        x=[critical_T],
        y=[critical_P],
        mode="markers",
        marker={
            "size": 16,
            "color": IMPRINT[3],  # #BD8233 ochre
            "symbol": "star",
            "line": {"color": PAGE_BG, "width": 2},
        },
        name="Critical point",
        hovertemplate="Critical Point<br>T: 647.1 K<br>P: 2.206×10⁷ Pa<extra></extra>",
    )
)

# Phase region labels — INK_MUTED so they sit behind the data visually
label_font = {"size": 22, "color": INK_MUTED, "family": "Arial Black"}
# annotation y uses log10 values because yaxis.type='log' uses log10 coordinate space
fig.add_annotation(x=225, y=np.log10(3e4), text="SOLID", font=label_font, showarrow=False, yref="y")
fig.add_annotation(x=430, y=np.log10(5e6), text="LIQUID", font=label_font, showarrow=False, yref="y")
fig.add_annotation(x=450, y=np.log10(30), text="GAS", font=label_font, showarrow=False, yref="y")
fig.add_annotation(
    x=700,
    y=9.75,
    text="Supercritical<br>Fluid",
    font={"size": 16, "color": INK_MUTED, "family": "Arial Black"},
    showarrow=False,
    yref="y",
    xanchor="center",
)

# Triple point annotation — placed right and above to avoid crowding with converging curves
fig.add_annotation(
    x=triple_T,
    y=np.log10(triple_P),
    yref="y",
    text="Triple Point<br>(273.16 K, 611.73 Pa)",
    font={"size": 12, "color": INK},
    bgcolor=ELEVATED_BG,
    bordercolor=IMPRINT[4],
    borderwidth=1,
    ax=90,
    ay=-60,
    arrowhead=2,
    arrowsize=1.2,
    arrowwidth=1.5,
    arrowcolor=IMPRINT[4],
)

# Critical point annotation — points left into liquid region for space
fig.add_annotation(
    x=critical_T,
    y=np.log10(critical_P),
    yref="y",
    text="Critical Point<br>(647.1 K, 2.206×10⁷ Pa)",
    font={"size": 12, "color": INK},
    bgcolor=ELEVATED_BG,
    bordercolor=IMPRINT[3],
    borderwidth=1,
    ax=-120,
    ay=-30,
    arrowhead=2,
    arrowsize=1.2,
    arrowwidth=1.5,
    arrowcolor=IMPRINT[3],
)

# Dashed supercritical boundary lines — vertical and horizontal from critical point
fig.add_trace(
    go.Scatter(
        x=[critical_T, critical_T],
        y=[critical_P, 1e10],
        mode="lines",
        line={"color": IMPRINT[3], "width": 2, "dash": "dot"},
        showlegend=False,
        hoverinfo="skip",
    )
)
fig.add_trace(
    go.Scatter(
        x=[critical_T, 800],
        y=[critical_P, critical_P],
        mode="lines",
        line={"color": IMPRINT[3], "width": 2, "dash": "dot"},
        showlegend=False,
        hoverinfo="skip",
    )
)

# Layout — theme-adaptive chrome throughout
fig.update_layout(
    autosize=False,
    paper_bgcolor=PAGE_BG,
    plot_bgcolor=PAGE_BG,
    font={"color": INK},
    title={"text": title_str, "font": {"size": title_fs, "color": INK}, "x": 0.5, "xanchor": "center"},
    xaxis={
        "title": {"text": "Temperature (K)", "font": {"size": 12, "color": INK}},
        "tickfont": {"size": 10, "color": INK_SOFT},
        "range": [x_min, x_max],
        "showgrid": True,
        "gridwidth": 1,
        "gridcolor": GRID,
        "linecolor": INK_SOFT,
        "zerolinecolor": INK_SOFT,
    },
    yaxis={
        "title": {"text": "Pressure (Pa)", "font": {"size": 12, "color": INK}},
        "tickfont": {"size": 10, "color": INK_SOFT},
        "type": "log",
        "range": [y_log_min, y_log_max],
        "showgrid": True,
        "gridwidth": 1,
        "gridcolor": GRID,
        "linecolor": INK_SOFT,
        "zerolinecolor": INK_SOFT,
    },
    legend={
        "font": {"size": 10, "color": INK_SOFT},
        "x": 0.02,
        "y": 0.98,
        "bgcolor": ELEVATED_BG,
        "bordercolor": INK_SOFT,
        "borderwidth": 1,
    },
    margin={"l": 100, "r": 80, "t": 80, "b": 80},
    showlegend=True,
    updatemenus=[
        {
            "type": "buttons",
            "direction": "left",
            "x": 0.98,
            "y": -0.15,
            "xanchor": "right",
            "buttons": [
                {"label": "Log Scale", "method": "relayout", "args": [{"yaxis.type": "log"}]},
                {"label": "Linear Scale", "method": "relayout", "args": [{"yaxis.type": "linear"}]},
            ],
            "font": {"size": 10, "color": INK},
            "bgcolor": ELEVATED_BG,
            "borderwidth": 1,
            "bordercolor": INK_SOFT,
        }
    ],
)

# Save — landscape 3200×1800 (width=800 height=450 scale=4)
fig.write_image(f"plot-{THEME}.png", width=800, height=450, scale=4)
fig.write_html(f"plot-{THEME}.html", include_plotlyjs="cdn")
Runnable source as JSON, for any HTTP client: https://api.anyplot.ai/specs/phase-diagram-pt/plotly/code. Any spec id and library id listed in llms-full.txt fit the same URL shape; every URL below is complete and callable.
{
  "spec_id": "phase-diagram-pt",
  "language": "python",
  "library": "plotly",
  "page": "https://anyplot.ai/phase-diagram-pt/python/plotly",
  "hub": "https://anyplot.ai/phase-diagram-pt",
  "code_json": "https://api.anyplot.ai/specs/phase-diagram-pt/plotly/code",
  "spec_json": "https://api.anyplot.ai/specs/phase-diagram-pt",
  "render_light_png": "https://storage.googleapis.com/anyplot-images/plots/phase-diagram-pt/python/plotly/plot-light.png",
  "render_dark_png": "https://storage.googleapis.com/anyplot-images/plots/phase-diagram-pt/python/plotly/plot-dark.png",
  "interactive_light_html": "https://storage.googleapis.com/anyplot-images/plots/phase-diagram-pt/python/plotly/plot-light.html",
  "interactive_dark_html": "https://storage.googleapis.com/anyplot-images/plots/phase-diagram-pt/python/plotly/plot-dark.html",
  "quality_score": 91.0,
  "license": "MIT",
  "guide": "https://anyplot.ai/llms.txt"
}
Part of Thermodynamic Phase Diagram (Pressure-Temperature) on anyplot.ai.