The same plot in 14 other libraries — Python: Altair, Bokeh, lets-plot, Matplotlib, Plotly, plotnine, Pygal, Seaborn; R: ggplot2; JavaScript: Chart.js, D3.js, Apache ECharts, Highcharts, MUI X Charts. Compare all 15 side by side: Thermodynamic Phase Diagram (Pressure-Temperature) in Python, R, Julia and JavaScript.
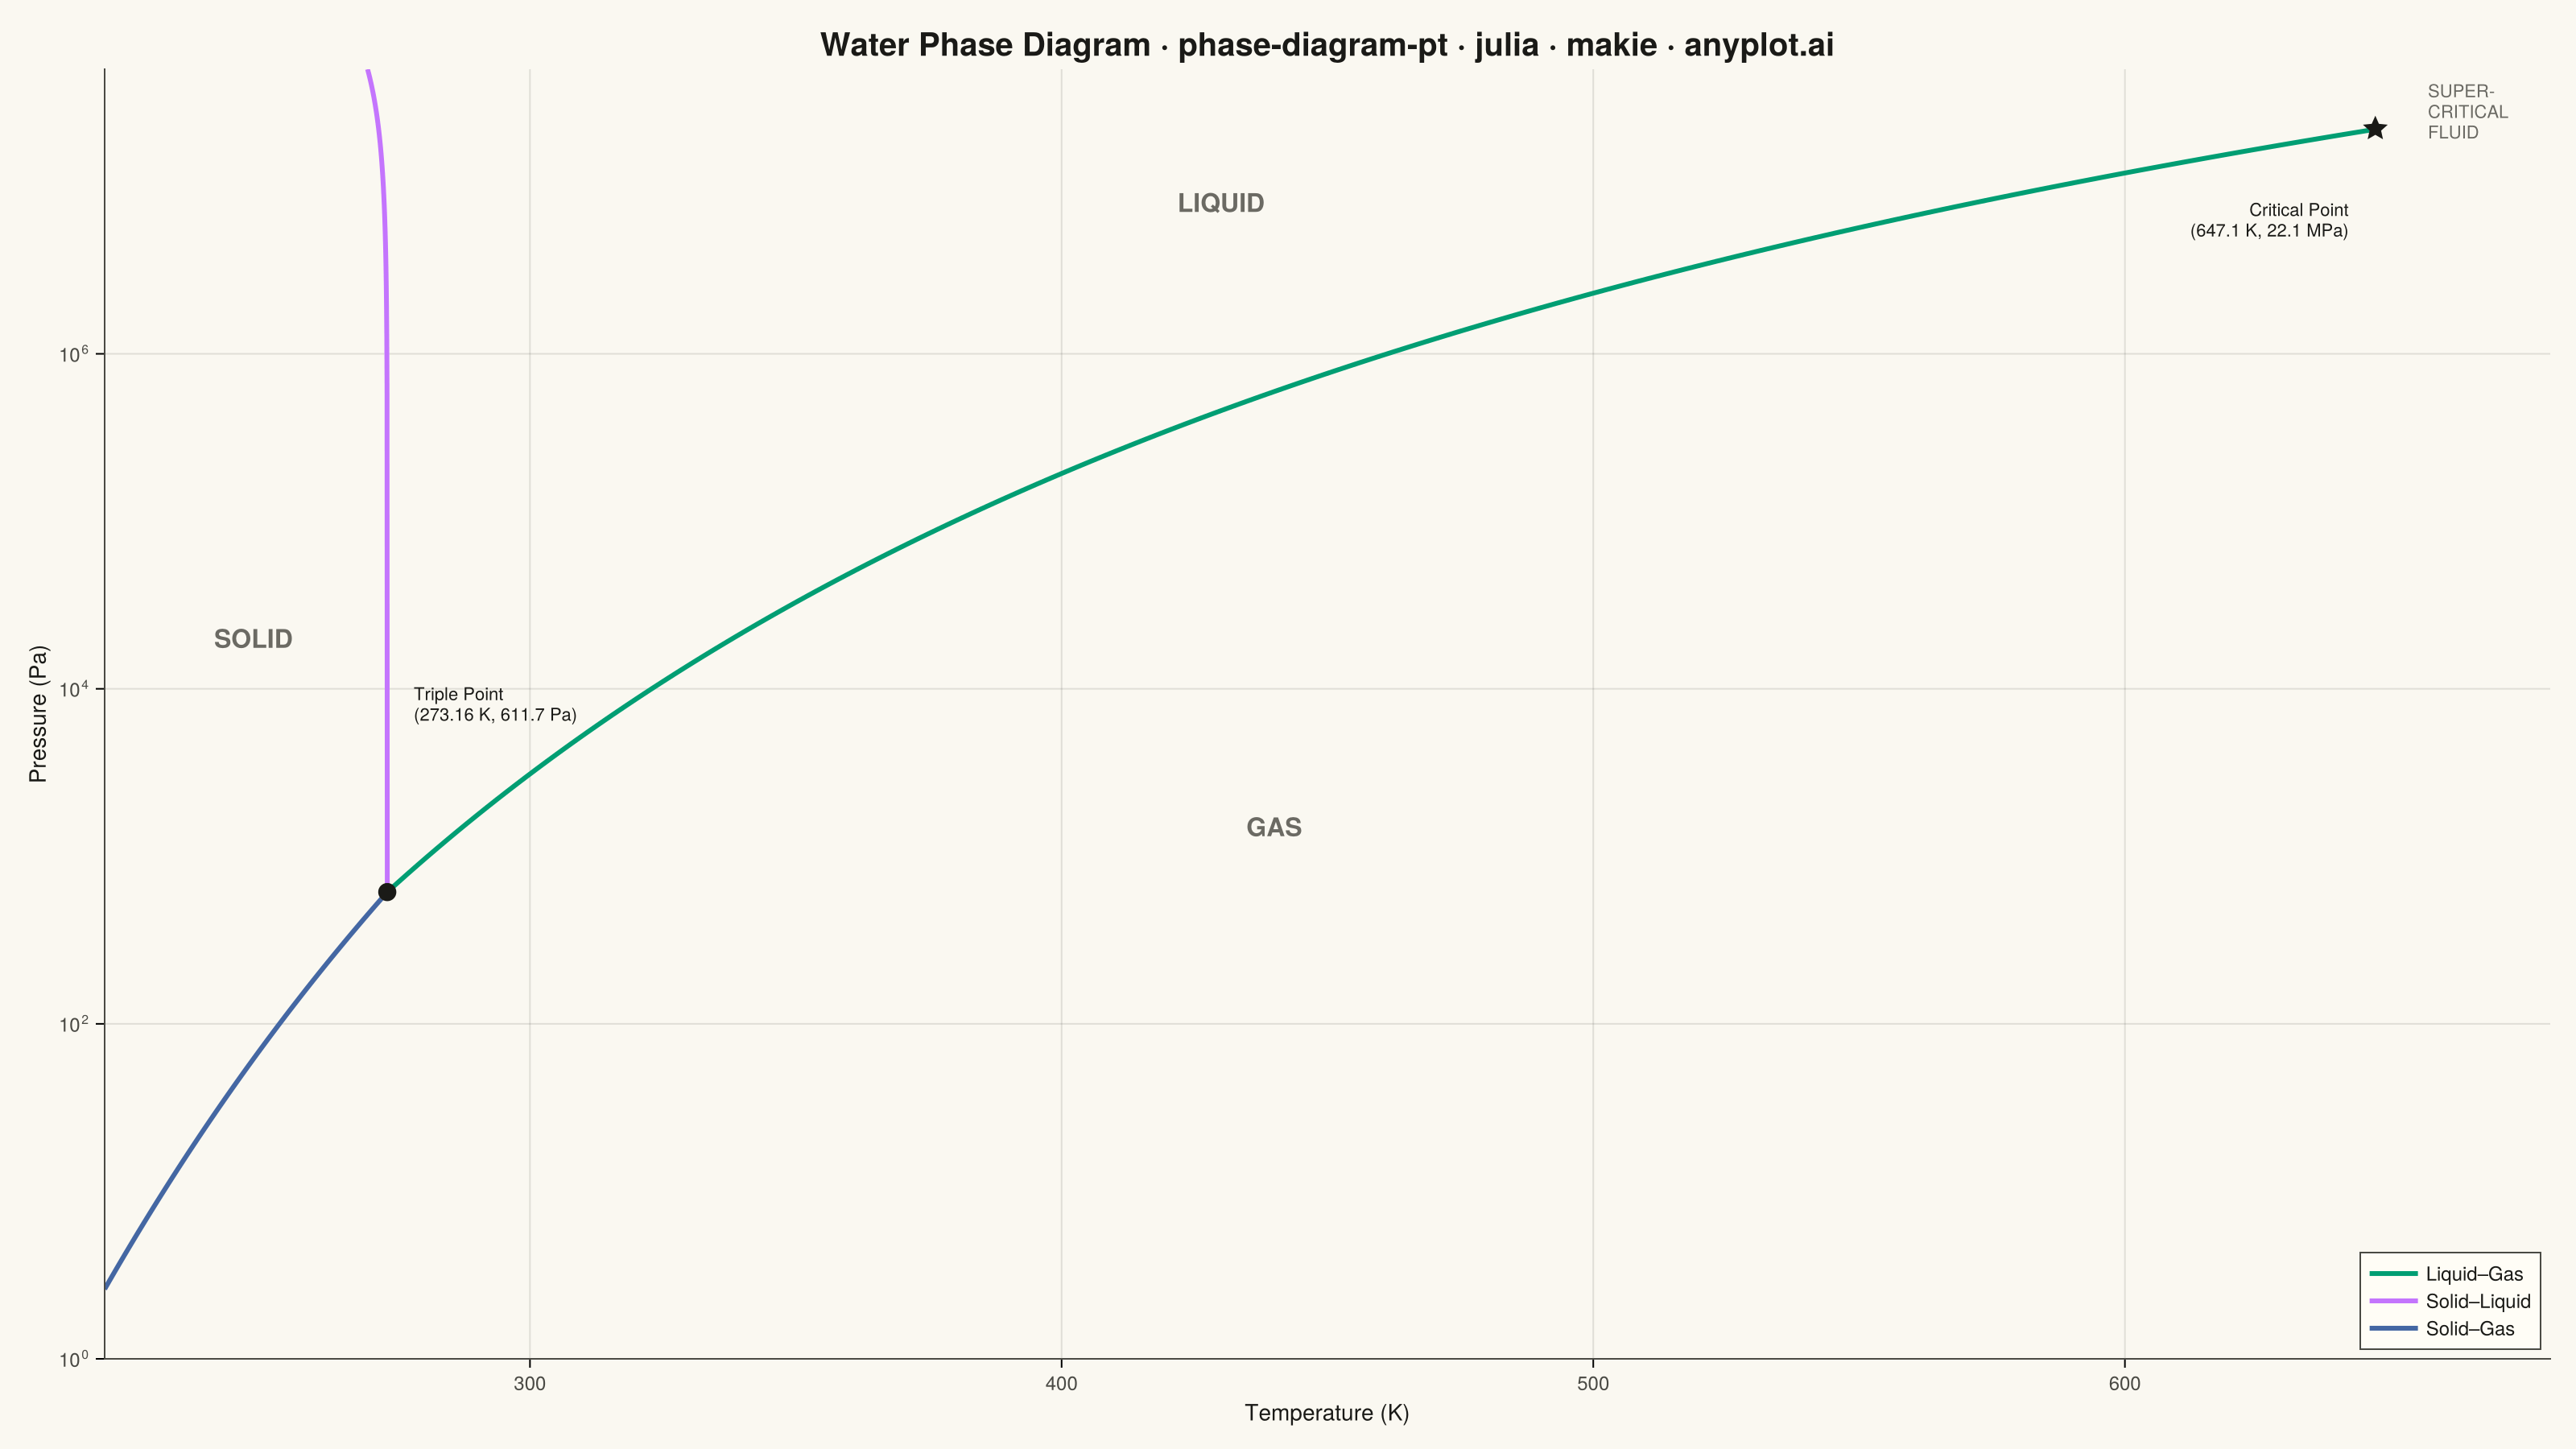
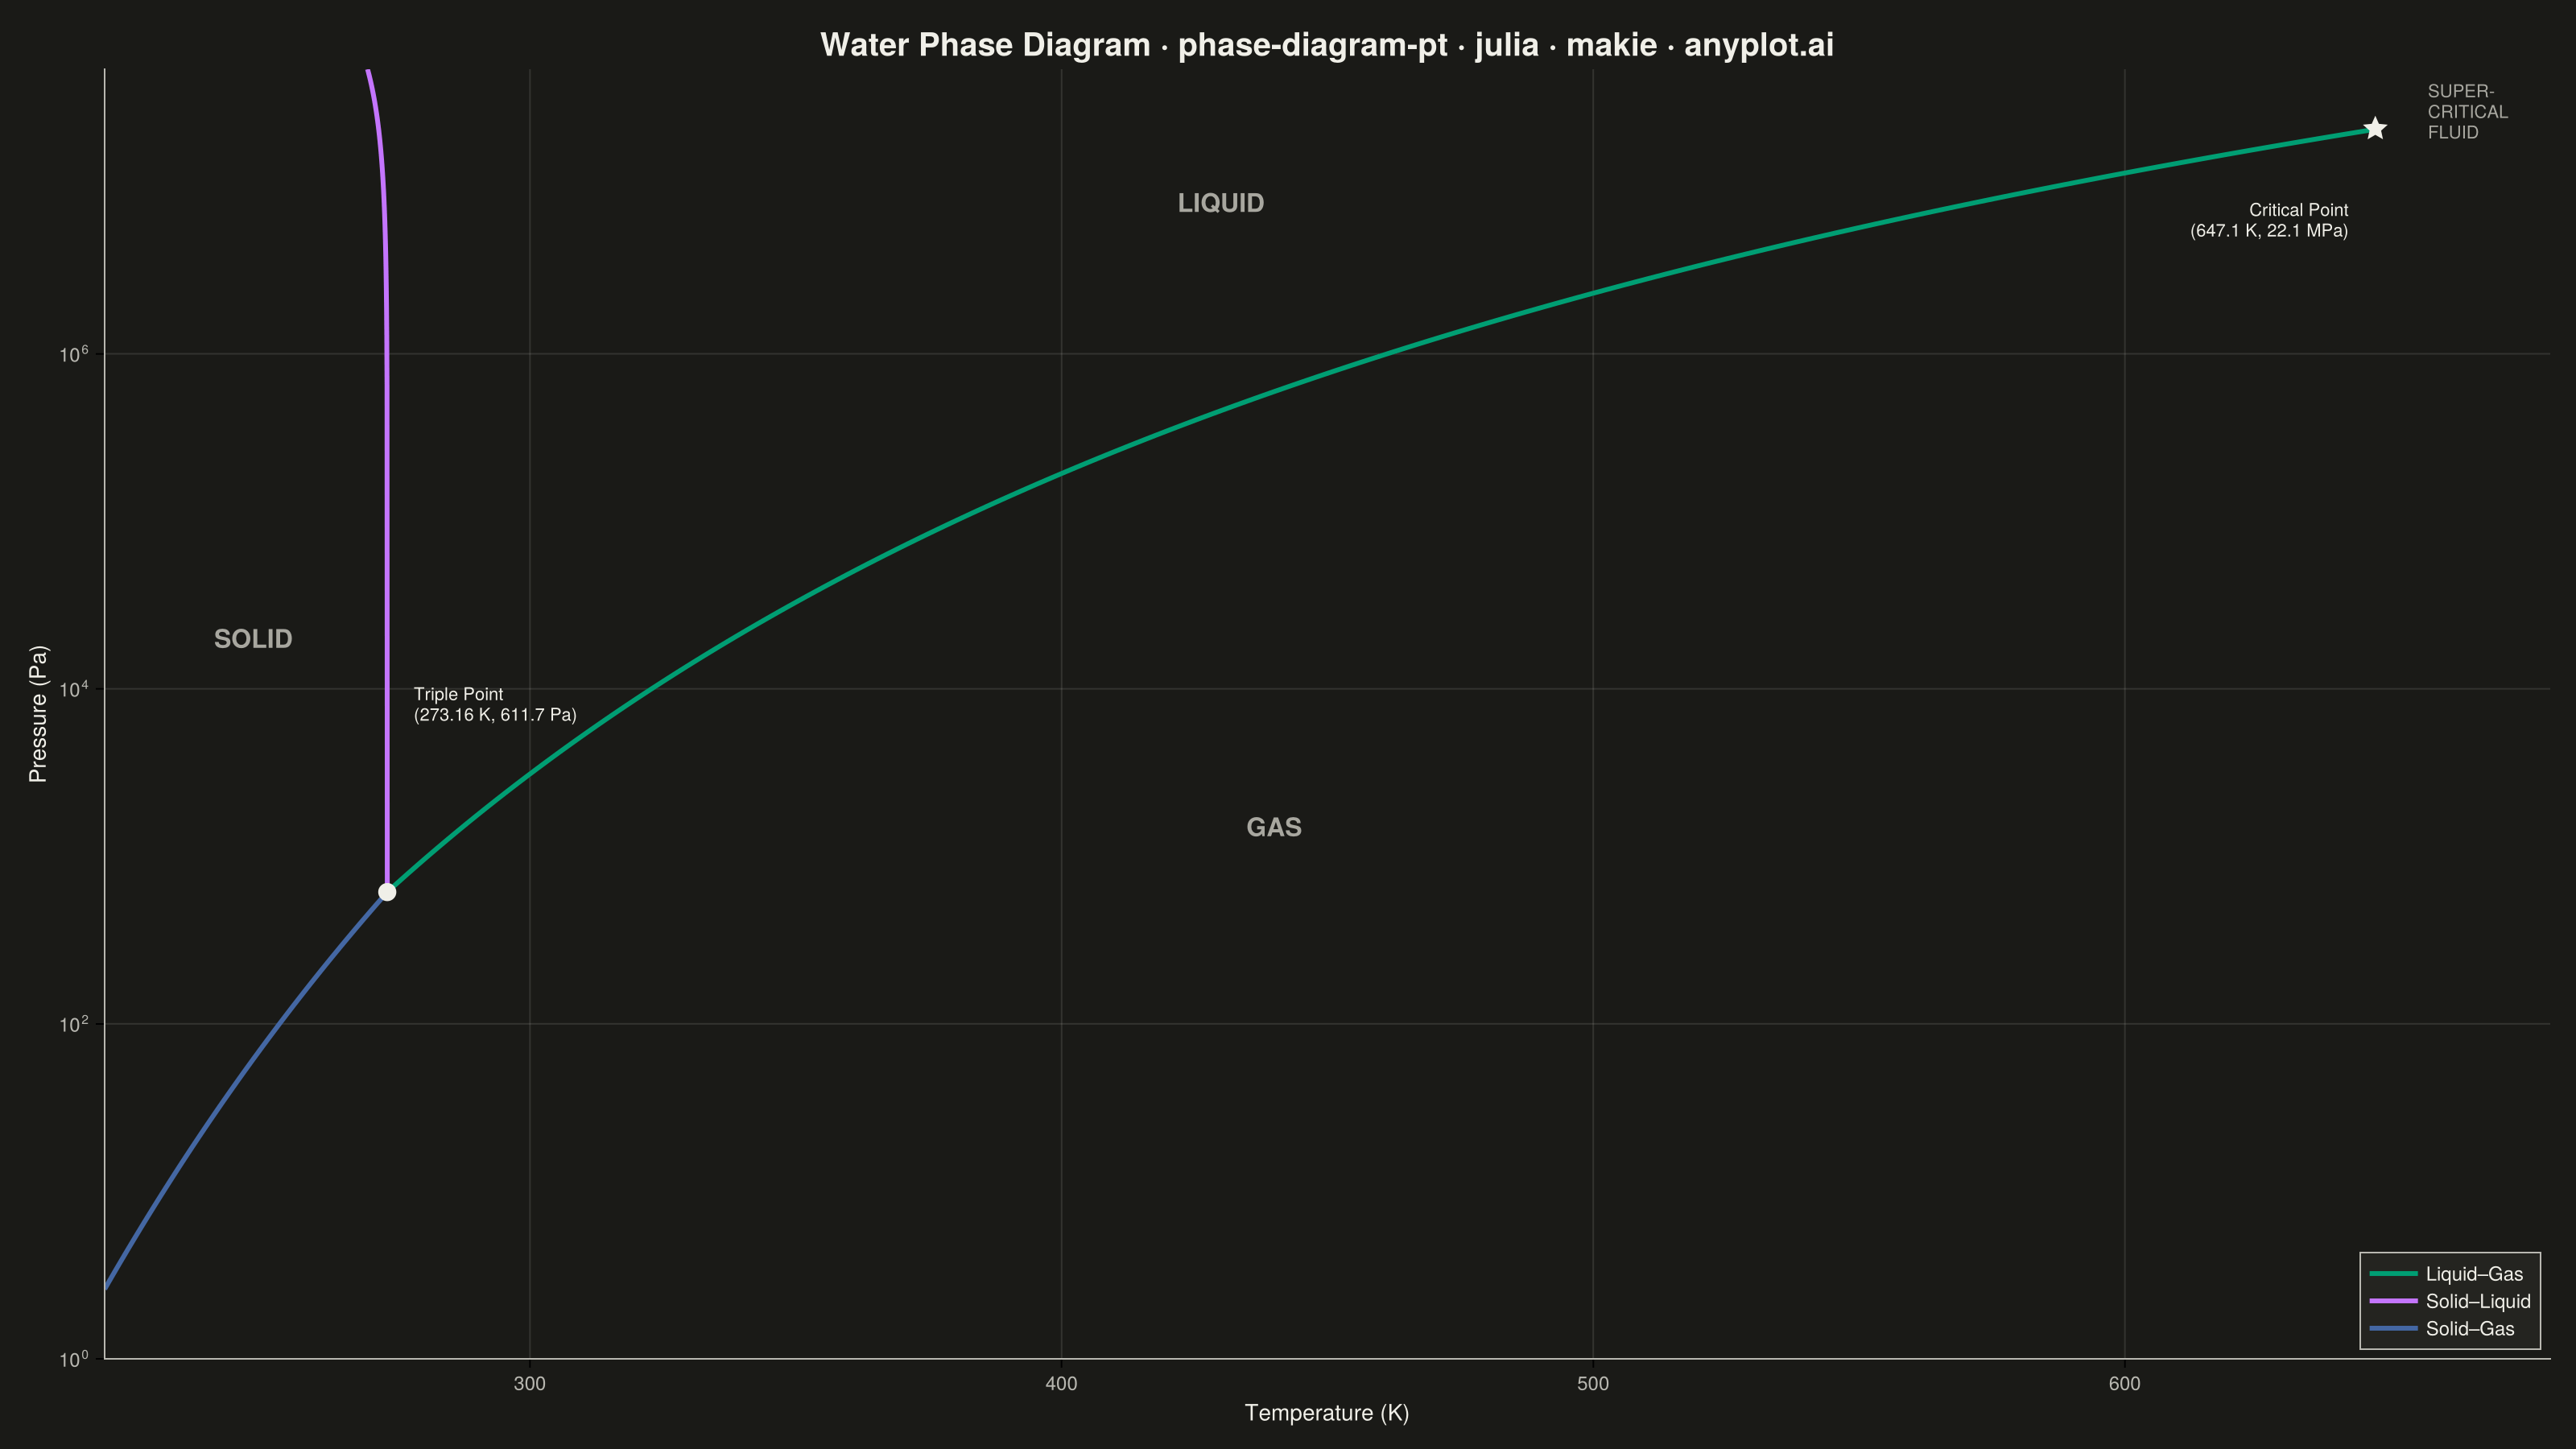
A pressure-temperature (P-T) phase diagram showing the boundaries between solid, liquid, and gas phases of a substance. The diagram includes the triple point where all three phases coexist and the critical point beyond which the liquid-gas distinction vanishes. This is one of the most fundamental diagrams in chemistry and physics, essential for understanding phase transitions and states of matter.
# anyplot.ai
# phase-diagram-pt: Thermodynamic Phase Diagram (Pressure-Temperature)
# Library: makie 0.22.10 | Julia 1.11.9
# Quality: 90/100 | Created: 2026-06-08

using CairoMakie
using Colors
using Random

Random.seed!(42)

# Theme tokens (Imprint palette — see prompts/default-style-guide.md)
const THEME       = get(ENV, "ANYPLOT_THEME", "light")
const PAGE_BG     = THEME == "light" ? colorant"#FAF8F1" : colorant"#1A1A17"
const ELEVATED_BG = THEME == "light" ? colorant"#FFFDF6" : colorant"#242420"
const INK         = THEME == "light" ? colorant"#1A1A17" : colorant"#F0EFE8"
const INK_SOFT    = THEME == "light" ? colorant"#4A4A44" : colorant"#B8B7B0"
const INK_MUTED   = THEME == "light" ? colorant"#6B6A63" : colorant"#A8A79F"
const IMPRINT_PALETTE = [
    colorant"#009E73",  # 1 — brand green (vaporization / liquid-gas boundary)
    colorant"#C475FD",  # 2 — lavender    (melting / solid-liquid boundary)
    colorant"#4467A3",  # 3 — blue        (sublimation / solid-gas boundary)
]

# Water physical constants
const T_tp = 273.16    # triple point temperature (K)
const P_tp = 611.73    # triple point pressure (Pa)
const T_c  = 647.1     # critical point temperature (K)
const P_c  = 22.064e6  # critical point pressure (Pa)
const R    = 8.314     # universal gas constant (J·mol⁻¹·K⁻¹)

# Clausius-Clapeyron effective latent heats
# L_lg fitted so the curve passes through both (T_tp, P_tp) and (T_c, P_c)
const L_lg = 41210.0  # J/mol — vaporization
const L_sg = 51300.0  # J/mol — sublimation

# Vaporization curve: triple point → critical point
T_lg = range(T_tp, T_c; length = 200)
P_lg = P_tp .* exp.(-L_lg / R .* (1.0 ./ T_lg .- 1.0 / T_tp))

# Sublimation curve: low temperature → triple point
T_sg = range(220.0, T_tp; length = 100)
P_sg = P_tp .* exp.(-L_sg / R .* (1.0 ./ T_sg .- 1.0 / T_tp))

# Melting curve: triple point → high pressure (water's anomalous negative slope)
# dP/dT ≈ -13.5 MPa/K because liquid water is denser than ice (ΔV < 0)
const melt_slope = -13.5e6    # Pa/K
const P_melt_top = 5.0e7      # Pa — top of displayed y range
T_sl_min = T_tp + (P_melt_top - P_tp) / melt_slope
T_sl = range(T_sl_min, T_tp; length = 80)
P_sl = P_tp .+ melt_slope .* (T_sl .- T_tp)

# Grid colour: theme-adaptive ink at 12 % opacity
const GRID_COLOR = RGBAf(Float32(INK.r), Float32(INK.g), Float32(INK.b), 0.12f0)

# Figure
fig = Figure(
    size            = (1600, 900),
    fontsize        = 14,
    backgroundcolor = PAGE_BG,
)

ax = Axis(
    fig[1, 1];
    title              = "Water Phase Diagram · phase-diagram-pt · julia · makie · anyplot.ai",
    titlesize          = 20,
    titlecolor         = INK,
    xlabel             = "Temperature (K)",
    ylabel             = "Pressure (Pa)",
    xlabelcolor        = INK,
    ylabelcolor        = INK,
    xlabelsize         = 14,
    ylabelsize         = 14,
    xticklabelcolor    = INK_SOFT,
    yticklabelcolor    = INK_SOFT,
    xtickcolor         = INK_SOFT,
    ytickcolor         = INK_SOFT,
    xticklabelsize     = 12,
    yticklabelsize     = 12,
    backgroundcolor    = PAGE_BG,
    topspinevisible    = false,
    rightspinevisible  = false,
    leftspinecolor     = INK_SOFT,
    bottomspinecolor   = INK_SOFT,
    yscale             = log10,
    limits             = (220.0, 680.0, 1.0, 5.0e7),
    xgridcolor         = GRID_COLOR,
    ygridcolor         = GRID_COLOR,
    xminorgridvisible  = false,
    yminorgridvisible  = false,
)

# Supercritical fluid region: subtle shaded polygon (behind curves)
const SC_FILL = RGBAf(Float32(INK_MUTED.r), Float32(INK_MUTED.g), Float32(INK_MUTED.b), 0.08f0)
poly!(ax, Point2f[(T_c, P_c), (680.0, P_c), (680.0, 5.0e7), (T_c, 5.0e7)];
    color = SC_FILL, strokewidth = 0)

# Phase boundary lines
lines!(ax, T_lg, P_lg; color = IMPRINT_PALETTE[1], linewidth = 3.0, label = "Liquid–Gas")
lines!(ax, T_sl, P_sl; color = IMPRINT_PALETTE[2], linewidth = 3.0, label = "Solid–Liquid")
lines!(ax, T_sg, P_sg; color = IMPRINT_PALETTE[3], linewidth = 3.0, label = "Solid–Gas")

# Triple point and critical point markers
scatter!(ax, [T_tp], [P_tp]; color = INK, markersize = 16, marker = :circle, strokewidth = 0)
scatter!(ax, [T_c],  [P_c];  color = INK, markersize = 18, marker = :star5,  strokewidth = 0)

# Annotations: special points
text!(ax, T_tp + 5.0, P_tp * 10.0;
    text     = "Triple Point\n(273.16 K, 611.7 Pa)",
    color    = INK,
    fontsize = 13,
    align    = (:left, :bottom),
)
text!(ax, T_c - 5.0, P_c * 0.38;
    text     = "Critical Point\n(647.1 K, 22.1 MPa)",
    color    = INK,
    fontsize = 13,
    align    = (:right, :top),
)

# Phase region labels
text!(ax, 248.0, 2.0e4;
    text     = "SOLID",
    color    = INK_MUTED,
    fontsize = 16,
    font     = :bold,
    align    = (:center, :center),
)
text!(ax, 430.0, 8.0e6;
    text     = "LIQUID",
    color    = INK_MUTED,
    fontsize = 16,
    font     = :bold,
    align    = (:center, :center),
)
text!(ax, 440.0, 1.5e3;
    text     = "GAS",
    color    = INK_MUTED,
    fontsize = 16,
    font     = :bold,
    align    = (:center, :center),
)
text!(ax, 662.0, 3.2e7;
    text     = "SUPER-\nCRITICAL\nFLUID",
    color    = INK_MUTED,
    fontsize = 13,
    align    = (:center, :center),
)

# Legend
axislegend(ax;
    position        = :rb,
    framevisible    = true,
    framecolor      = INK_SOFT,
    backgroundcolor = ELEVATED_BG,
    labelcolor      = INK,
    labelsize       = 12,
    patchsize       = (30, 12),
)

save("plot-$(THEME).png", fig; px_per_unit = 2)
Runnable source as JSON, for any HTTP client: https://api.anyplot.ai/specs/phase-diagram-pt/makie/code. Any spec id and library id listed in llms-full.txt fit the same URL shape; every URL below is complete and callable.
{
  "spec_id": "phase-diagram-pt",
  "language": "julia",
  "library": "makie",
  "page": "https://anyplot.ai/phase-diagram-pt/julia/makie",
  "hub": "https://anyplot.ai/phase-diagram-pt",
  "code_json": "https://api.anyplot.ai/specs/phase-diagram-pt/makie/code",
  "spec_json": "https://api.anyplot.ai/specs/phase-diagram-pt",
  "render_light_png": "https://storage.googleapis.com/anyplot-images/plots/phase-diagram-pt/julia/makie/plot-light.png",
  "render_dark_png": "https://storage.googleapis.com/anyplot-images/plots/phase-diagram-pt/julia/makie/plot-dark.png",
  "quality_score": 90.0,
  "license": "MIT",
  "guide": "https://anyplot.ai/llms.txt"
}
Part of Thermodynamic Phase Diagram (Pressure-Temperature) on anyplot.ai.