The same plot in 14 other libraries — JavaScript: Chart.js, D3.js, Highcharts, MUI X Charts; Python: Altair, Bokeh, lets-plot, Matplotlib, Plotly, plotnine, Pygal, Seaborn; R: ggplot2; Julia: Makie.jl. Compare all 15 side by side: Thermodynamic Phase Diagram (Pressure-Temperature) in Python, R, Julia and JavaScript.
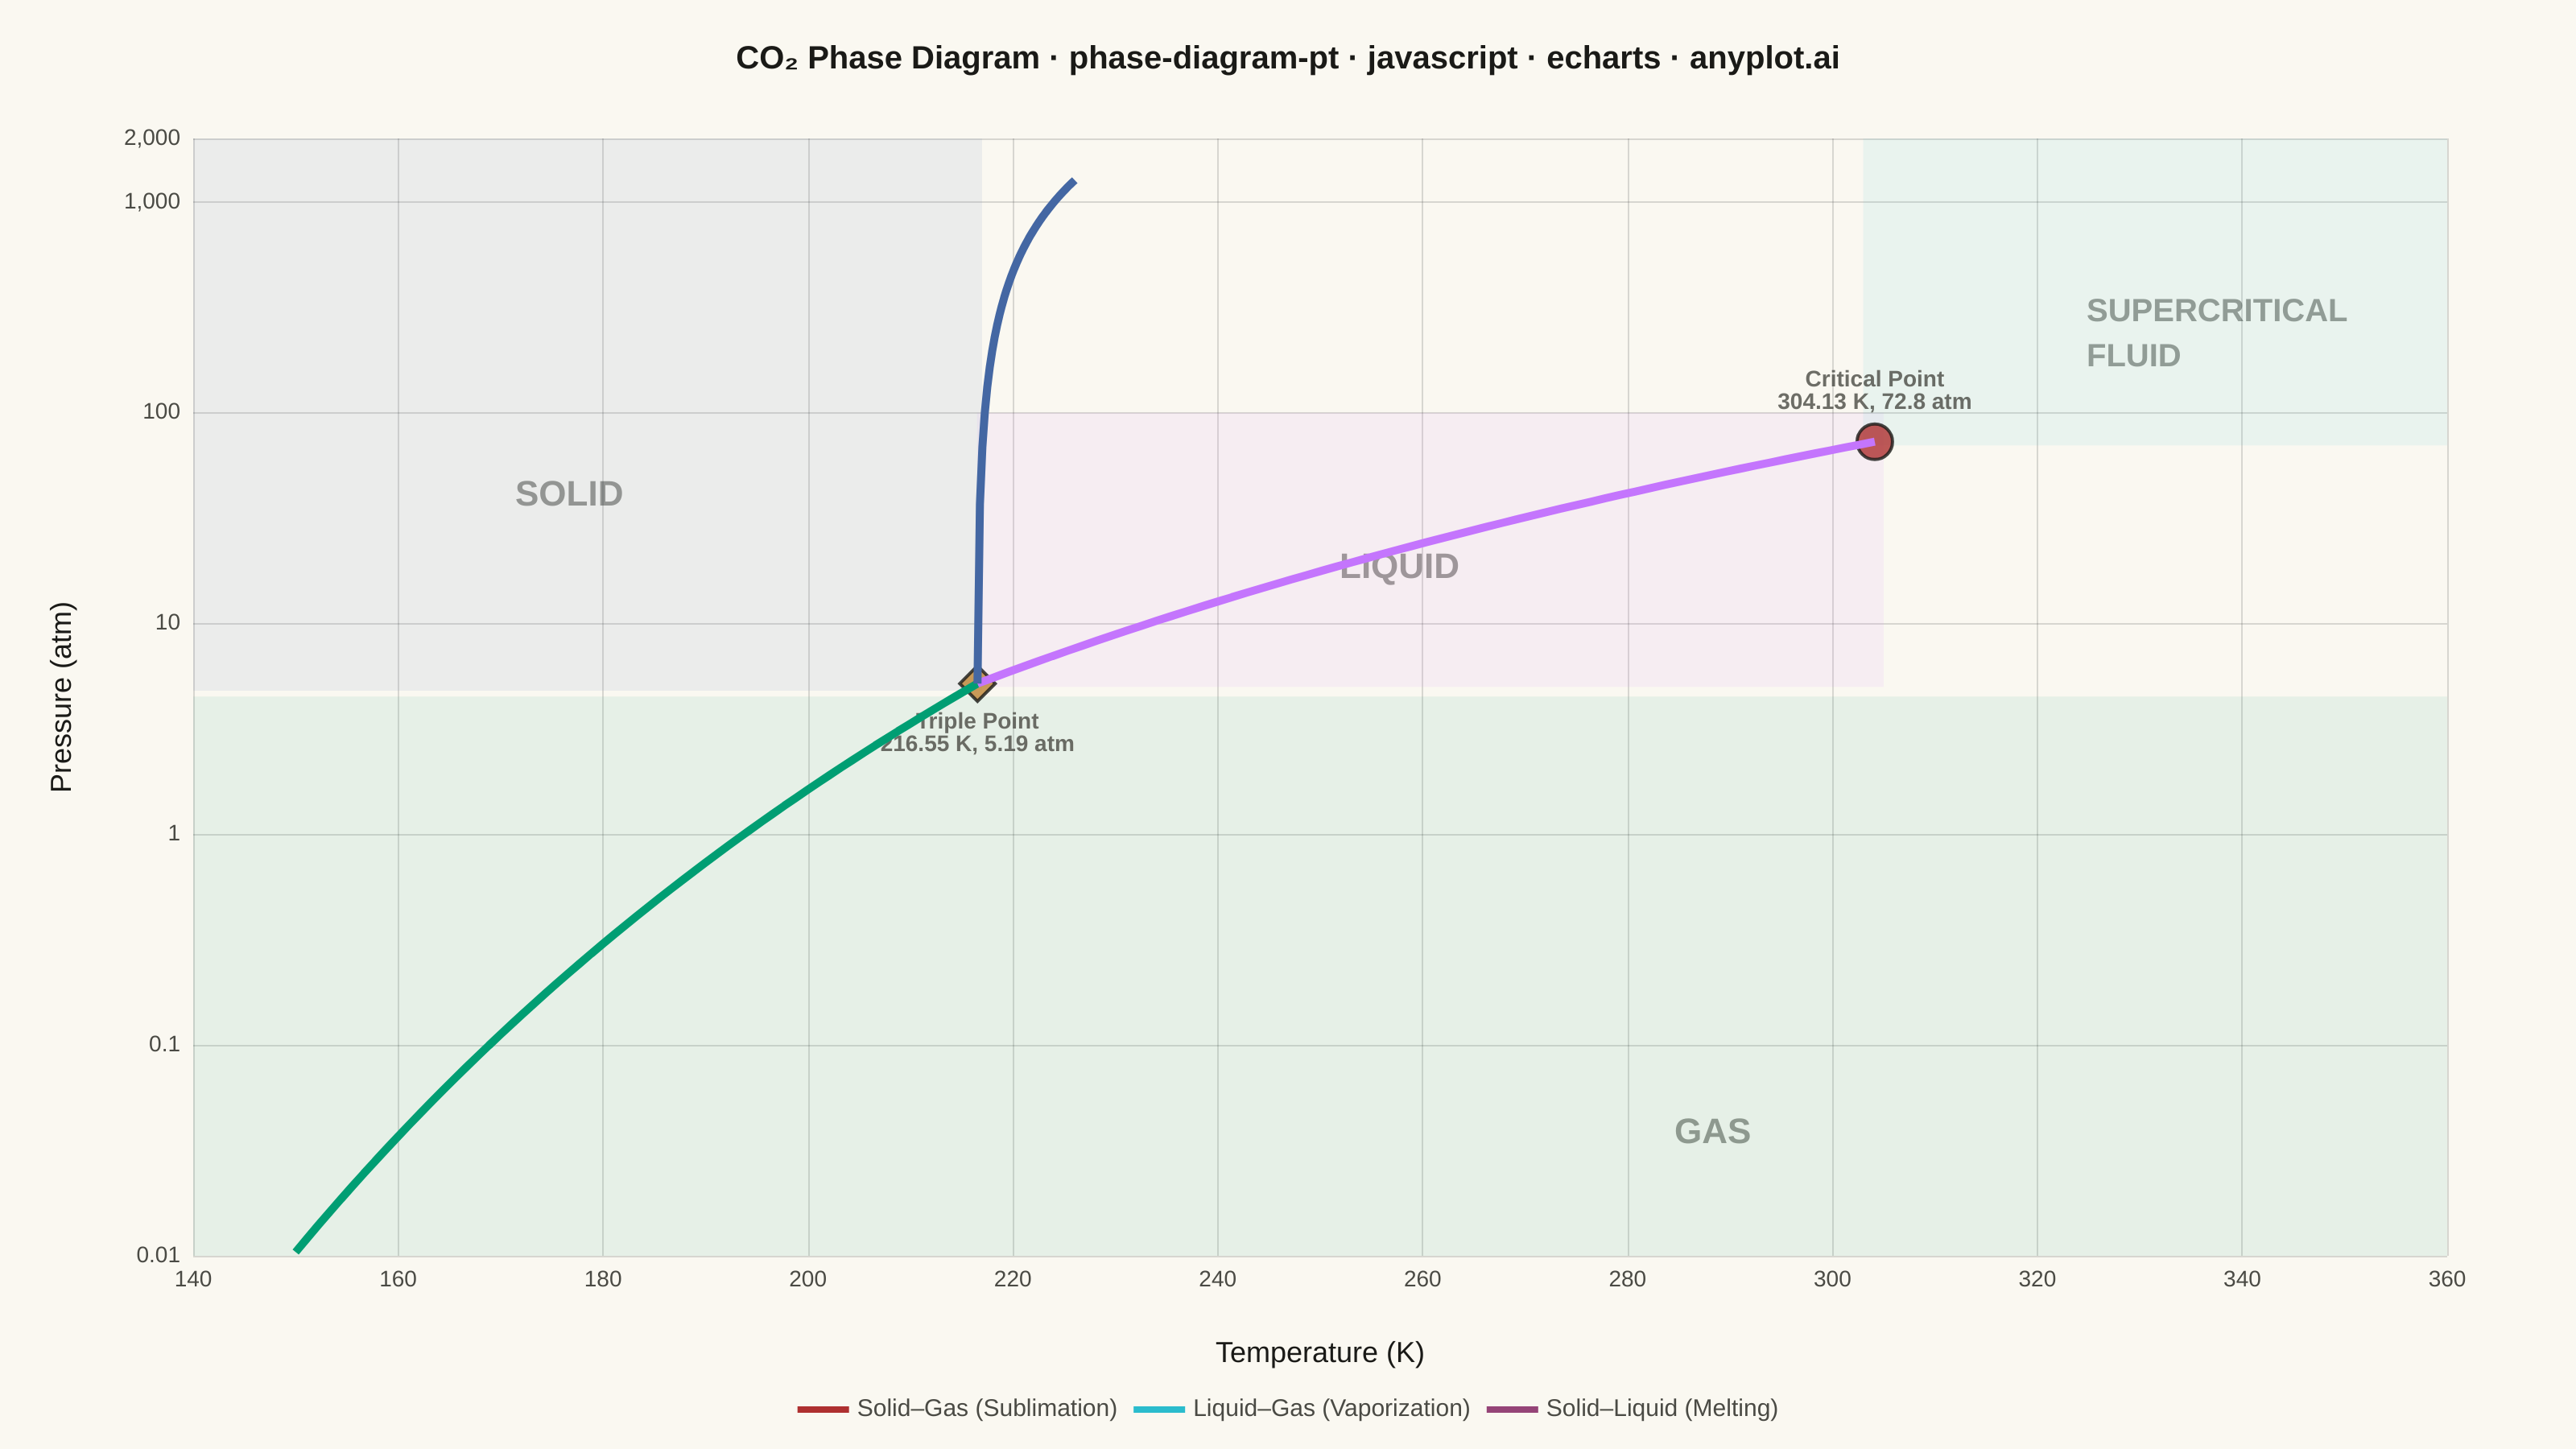
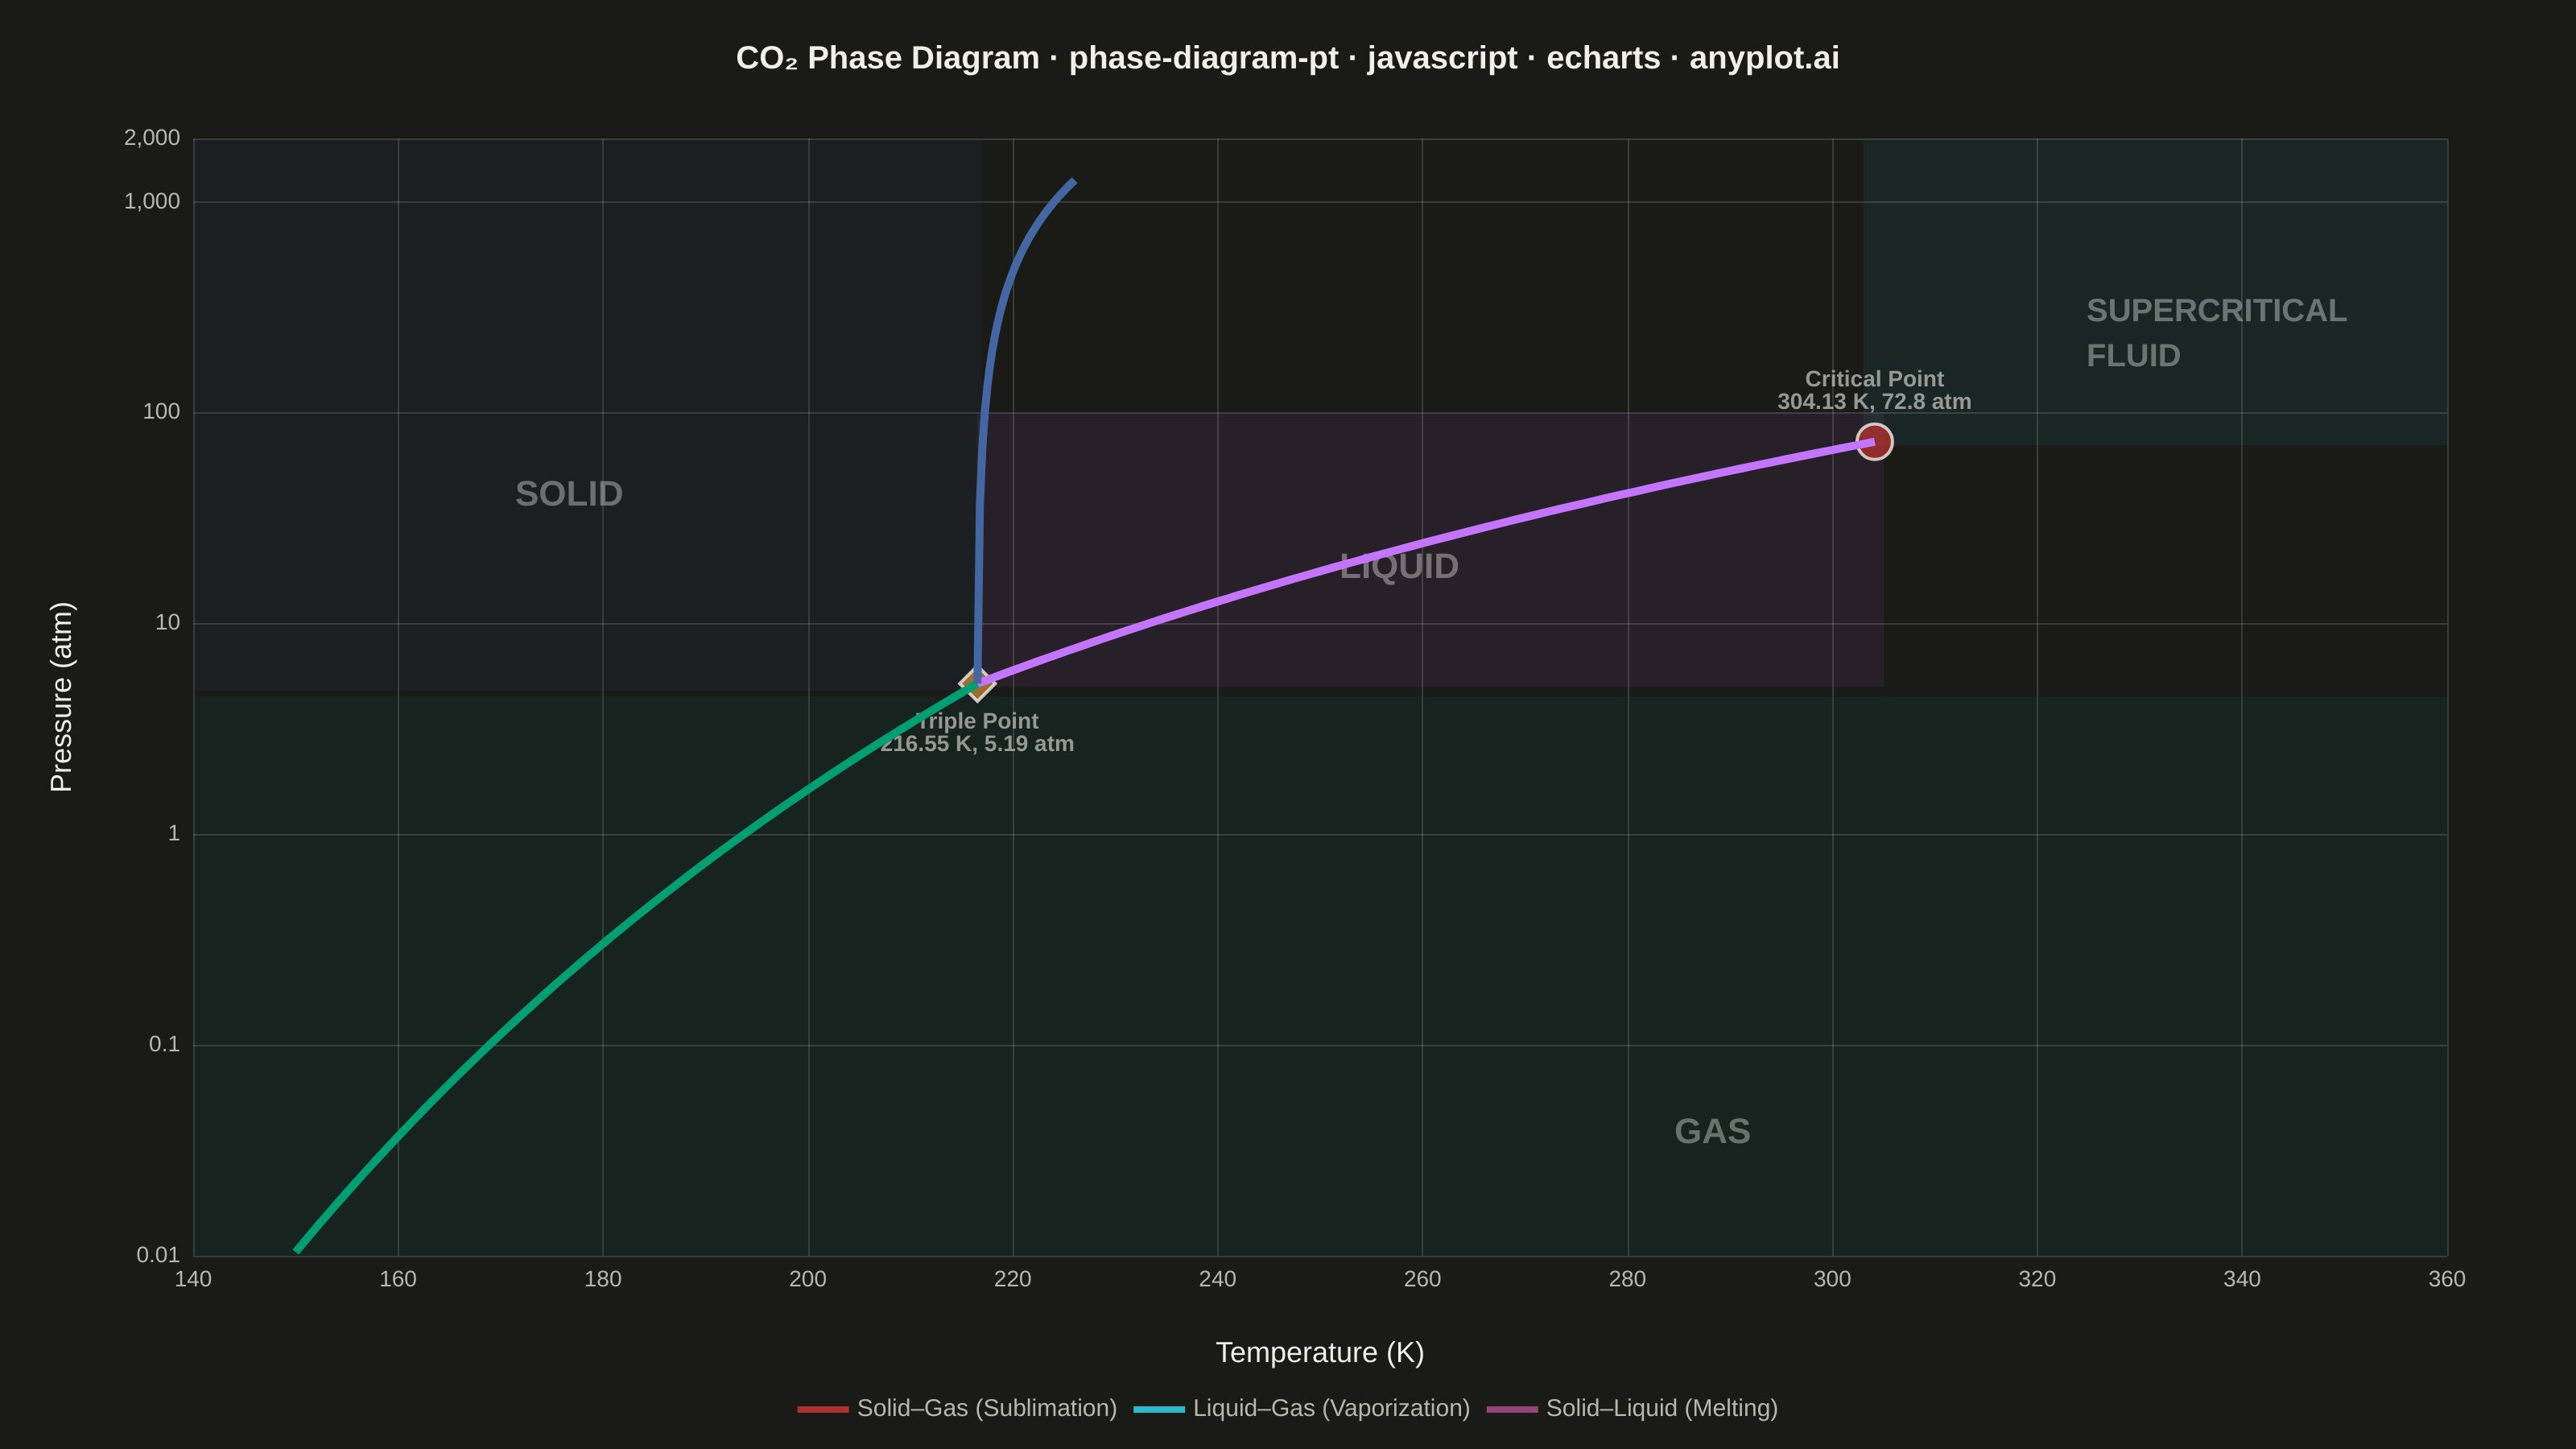
A pressure-temperature (P-T) phase diagram showing the boundaries between solid, liquid, and gas phases of a substance. The diagram includes the triple point where all three phases coexist and the critical point beyond which the liquid-gas distinction vanishes. This is one of the most fundamental diagrams in chemistry and physics, essential for understanding phase transitions and states of matter.
// anyplot.ai
// phase-diagram-pt: Thermodynamic Phase Diagram (Pressure-Temperature)
// Library: echarts 5.5.1 | JavaScript 22.22.3
// Quality: 88/100 | Created: 2026-06-08

//# anyplot-orientation: landscape

const t = window.ANYPLOT_TOKENS;

// CO2 phase diagram constants (Clausius-Clapeyron model)
const R   = 8.314;    // J/(mol·K)
const Ttp = 216.55;   // triple point temperature (K)
const Ptp = 5.185;    // triple point pressure (atm)
const Tcp = 304.13;   // critical point temperature (K)
const Pcp = 72.8;     // critical point pressure (atm)
const dHsub = 25200;  // CO2 sublimation enthalpy (J/mol)
const dHvap = 16520;  // CO2 vaporization enthalpy (J/mol), tuned to pass through critical point
const dPdT  = 133;    // melting curve slope (atm/K), steep positive for CO2

// Solid-gas sublimation curve: 150 K to triple point
const sublimData = [];
for (let i = 0; i <= 60; i++) {
  const T = 150 + (Ttp - 150) * i / 60;
  const P = Ptp * Math.exp((-dHsub / R) * (1 / T - 1 / Ttp));
  sublimData.push([T, P]);
}

// Liquid-gas vaporization curve: triple point to critical point
const vapData = [];
for (let i = 0; i <= 60; i++) {
  const T = Ttp + (Tcp - Ttp) * i / 60;
  const P = Ptp * Math.exp((-dHvap / R) * (1 / T - 1 / Ttp));
  vapData.push([T, P]);
}

// Solid-liquid melting curve: triple point upward (nearly vertical, positive slope for CO2)
const meltData = [];
for (let i = 0; i <= 40; i++) {
  const T = Ttp + 9.5 * i / 40;
  const P = Ptp + dPdT * (T - Ttp);
  meltData.push([T, P]);
}

const chart = echarts.init(document.getElementById("container"));

// Title length: "CO₂ Phase Diagram · phase-diagram-pt · javascript · echarts · anyplot.ai" ~ 72 chars
// titleFontSize = round(22 * 67 / 72) = 20
chart.setOption({
  animation: false,
  color: t.palette,
  backgroundColor: "transparent",

  title: {
    text: "CO₂ Phase Diagram · phase-diagram-pt · javascript · echarts · anyplot.ai",
    left: "center",
    top: 22,
    textStyle: { color: t.ink, fontSize: 20, fontWeight: "bold" },
  },

  legend: {
    data: [
      "Solid–Gas (Sublimation)",
      "Liquid–Gas (Vaporization)",
      "Solid–Liquid (Melting)",
    ],
    bottom: 12,
    textStyle: { color: t.inkSoft, fontSize: 15 },
    itemWidth: 32,
    itemHeight: 4,
    icon: "rect",
  },

  grid: { left: 120, right: 80, top: 86, bottom: 120 },

  xAxis: {
    type: "value",
    name: "Temperature (K)",
    nameLocation: "middle",
    nameGap: 52,
    nameTextStyle: { color: t.ink, fontSize: 18 },
    min: 140,
    max: 360,
    interval: 20,
    axisLabel: { color: t.inkSoft, fontSize: 14 },
    axisLine: { show: false },
    axisTick: { show: false },
    splitLine: { show: true, lineStyle: { color: t.grid } },
  },

  yAxis: {
    type: "log",
    logBase: 10,
    name: "Pressure (atm)",
    nameLocation: "middle",
    nameGap: 72,
    nameTextStyle: { color: t.ink, fontSize: 18 },
    min: 0.01,
    max: 2000,
    axisLabel: { color: t.inkSoft, fontSize: 14 },
    axisLine: { show: false },
    axisTick: { show: false },
    splitLine: { show: true, lineStyle: { color: t.grid } },
  },

  series: [
    // Phase-region shading (markArea only, no visible data points)
    {
      type: "line",
      name: "_gas",
      data: [],
      markArea: {
        silent: true,
        itemStyle: { color: t.palette[0], opacity: 0.08 },
        data: [[{ xAxis: 140, yAxis: 0.01 }, { xAxis: 360, yAxis: 4.5 }]],
      },
    },
    {
      type: "line",
      name: "_liquid",
      data: [],
      markArea: {
        silent: true,
        itemStyle: { color: t.palette[1], opacity: 0.08 },
        data: [[{ xAxis: 216.5, yAxis: 5.0 }, { xAxis: 305, yAxis: 100 }]],
      },
    },
    {
      type: "line",
      name: "_solid",
      data: [],
      markArea: {
        silent: true,
        itemStyle: { color: t.palette[2], opacity: 0.08 },
        data: [[{ xAxis: 140, yAxis: 4.8 }, { xAxis: 217, yAxis: 2000 }]],
      },
    },
    {
      type: "line",
      name: "_supercritical",
      data: [],
      markArea: {
        silent: true,
        itemStyle: { color: t.palette[5], opacity: 0.08 },
        data: [[{ xAxis: 303, yAxis: 70 }, { xAxis: 360, yAxis: 2000 }]],
      },
    },
    // Phase boundary curves
    {
      name: "Solid–Gas (Sublimation)",
      type: "line",
      data: sublimData,
      symbol: "none",
      lineStyle: { color: t.palette[0], width: 5 },
    },
    {
      name: "Liquid–Gas (Vaporization)",
      type: "line",
      data: vapData,
      symbol: "none",
      lineStyle: { color: t.palette[1], width: 5 },
    },
    {
      name: "Solid–Liquid (Melting)",
      type: "line",
      data: meltData,
      symbol: "none",
      lineStyle: { color: t.palette[2], width: 5 },
    },
    // Special points
    {
      name: "Triple Point",
      type: "scatter",
      data: [[Ttp, Ptp]],
      symbol: "diamond",
      symbolSize: 22,
      itemStyle: { color: t.palette[3], borderColor: t.ink, borderWidth: 2 },
      label: {
        show: true,
        formatter: "Triple Point\n216.55 K, 5.19 atm",
        position: "bottom",
        color: t.inkSoft,
        fontSize: 14,
        fontWeight: "bold",
      },
      emphasis: { disabled: true },
    },
    {
      name: "Critical Point",
      type: "scatter",
      data: [[Tcp, Pcp]],
      symbol: "circle",
      symbolSize: 22,
      itemStyle: { color: t.palette[4], borderColor: t.ink, borderWidth: 2 },
      label: {
        show: true,
        formatter: "Critical Point\n304.13 K, 72.8 atm",
        position: "top",
        color: t.inkSoft,
        fontSize: 14,
        fontWeight: "bold",
      },
      emphasis: { disabled: true },
    },
  ],

  graphic: [
    {
      type: "text",
      left: "20%",
      top: "33%",
      style: { text: "SOLID", fill: t.inkSoft, fontSize: 22, fontWeight: "bold", opacity: 0.55 },
    },
    {
      type: "text",
      left: "52%",
      top: "38%",
      style: { text: "LIQUID", fill: t.inkSoft, fontSize: 22, fontWeight: "bold", opacity: 0.55 },
    },
    {
      type: "text",
      left: "65%",
      top: "77%",
      style: { text: "GAS", fill: t.inkSoft, fontSize: 22, fontWeight: "bold", opacity: 0.55 },
    },
    {
      type: "text",
      left: "81%",
      top: "20%",
      style: {
        text: "SUPERCRITICAL\nFLUID",
        fill: t.inkSoft,
        fontSize: 20,
        fontWeight: "bold",
        opacity: 0.55,
        lineHeight: 28,
      },
    },
  ],
});
Runnable source as JSON, for any HTTP client: https://api.anyplot.ai/specs/phase-diagram-pt/echarts/code. Any spec id and library id listed in llms-full.txt fit the same URL shape; every URL below is complete and callable.
{
  "spec_id": "phase-diagram-pt",
  "language": "javascript",
  "library": "echarts",
  "page": "https://anyplot.ai/phase-diagram-pt/javascript/echarts",
  "hub": "https://anyplot.ai/phase-diagram-pt",
  "code_json": "https://api.anyplot.ai/specs/phase-diagram-pt/echarts/code",
  "spec_json": "https://api.anyplot.ai/specs/phase-diagram-pt",
  "render_light_png": "https://storage.googleapis.com/anyplot-images/plots/phase-diagram-pt/javascript/echarts/plot-light.png",
  "render_dark_png": "https://storage.googleapis.com/anyplot-images/plots/phase-diagram-pt/javascript/echarts/plot-dark.png",
  "interactive_light_html": "https://storage.googleapis.com/anyplot-images/plots/phase-diagram-pt/javascript/echarts/plot-light.html",
  "interactive_dark_html": "https://storage.googleapis.com/anyplot-images/plots/phase-diagram-pt/javascript/echarts/plot-dark.html",
  "quality_score": 88.0,
  "license": "MIT",
  "guide": "https://anyplot.ai/llms.txt"
}
Part of Thermodynamic Phase Diagram (Pressure-Temperature) on anyplot.ai.