The same plot in 14 other libraries — JavaScript: Chart.js, D3.js, Apache ECharts, Highcharts; Python: Altair, Bokeh, lets-plot, Matplotlib, Plotly, plotnine, Pygal, Seaborn; R: ggplot2; Julia: Makie.jl. Compare all 15 side by side: Thermodynamic Phase Diagram (Pressure-Temperature) in Python, R, Julia and JavaScript.
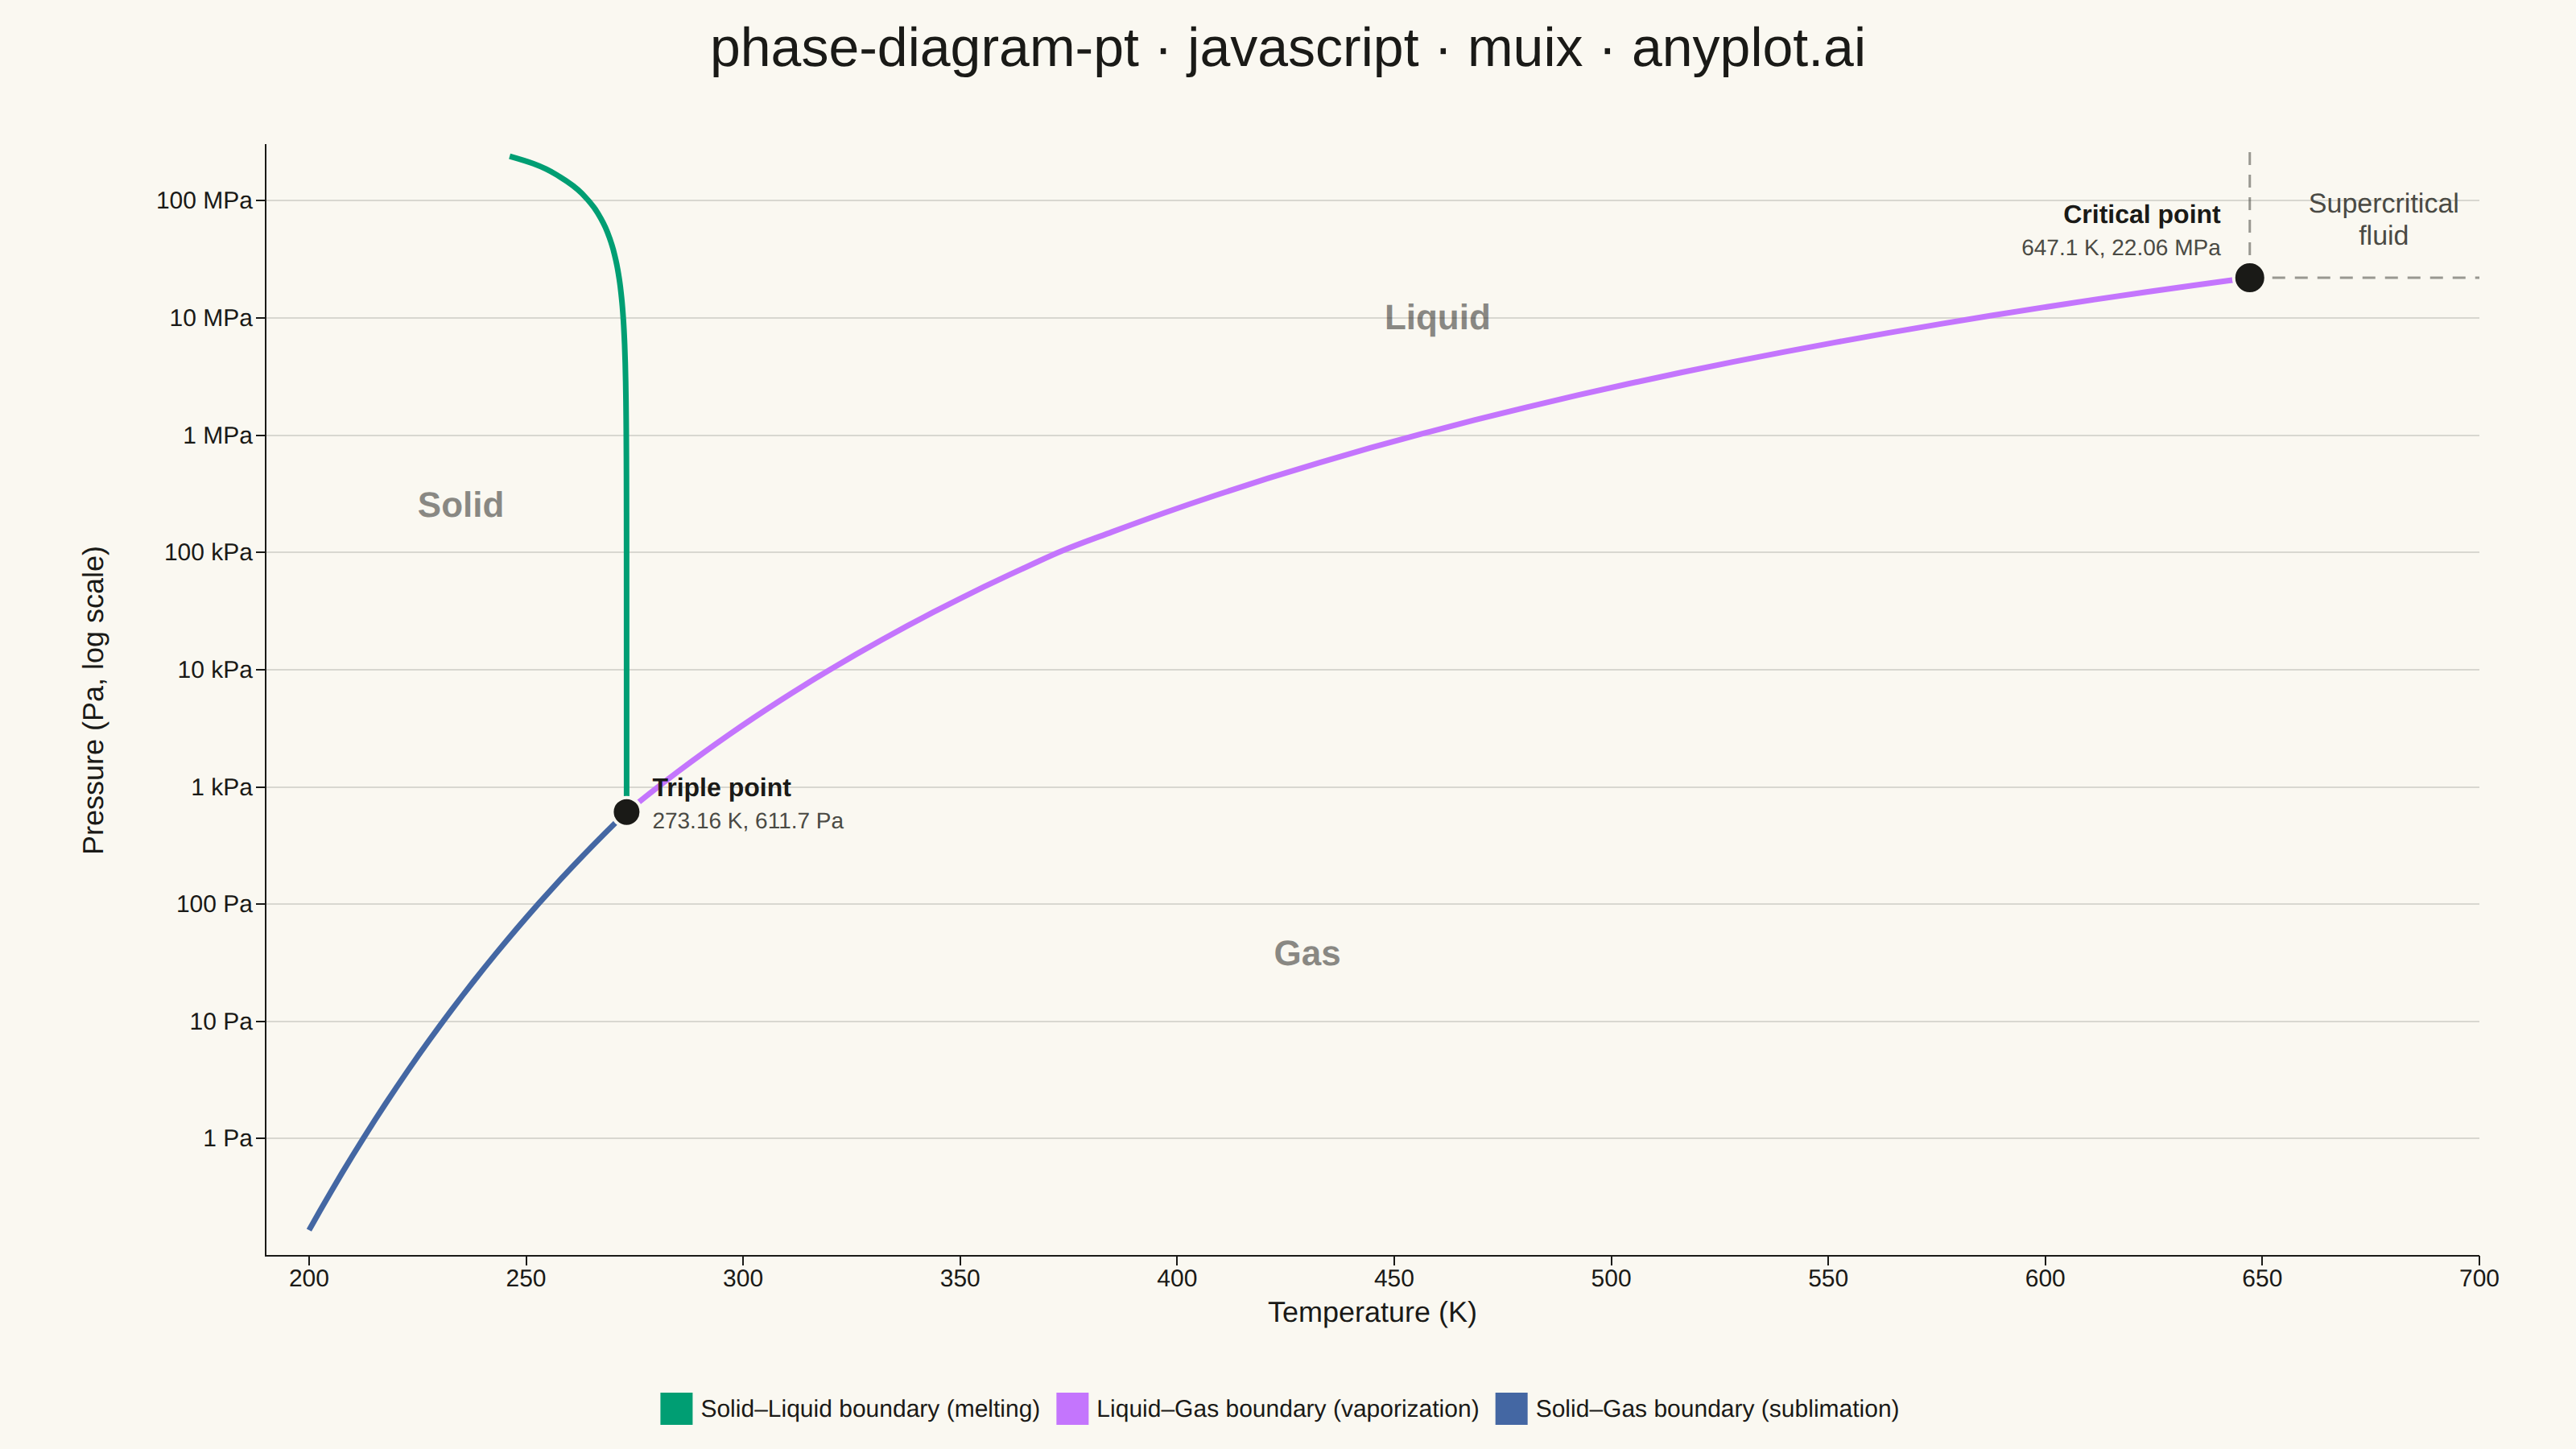
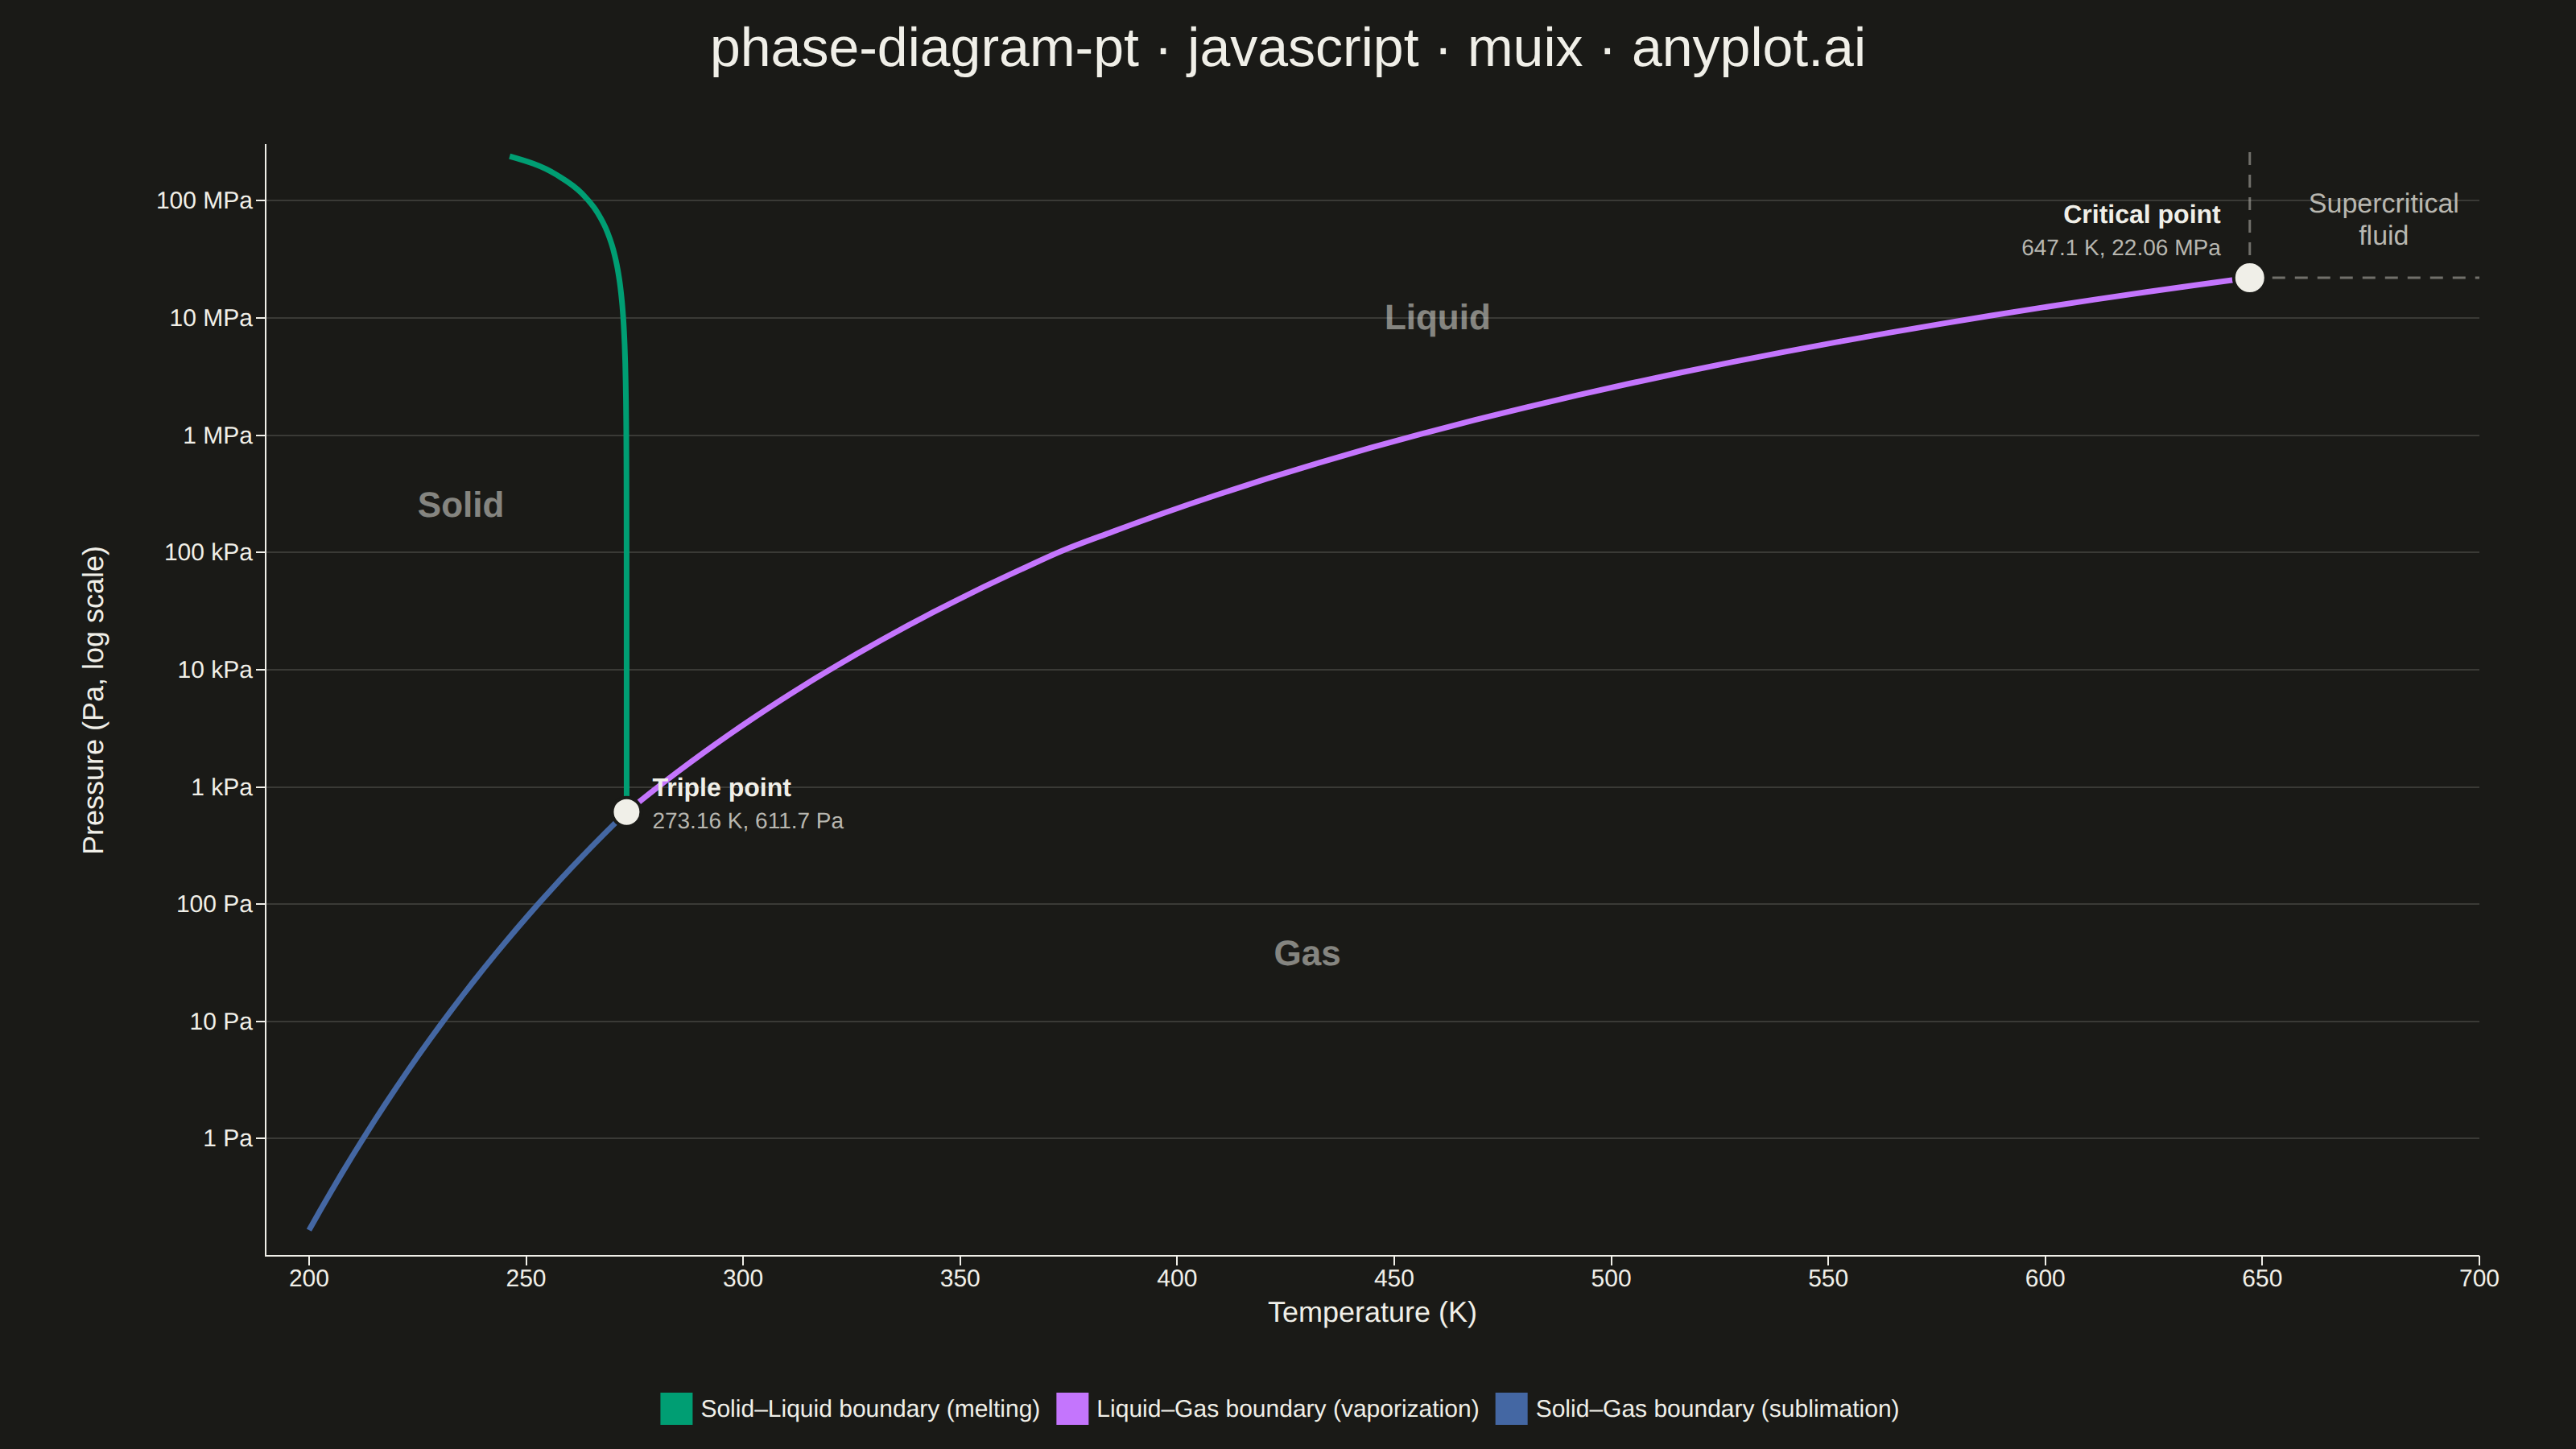
A pressure-temperature (P-T) phase diagram showing the boundaries between solid, liquid, and gas phases of a substance. The diagram includes the triple point where all three phases coexist and the critical point beyond which the liquid-gas distinction vanishes. This is one of the most fundamental diagrams in chemistry and physics, essential for understanding phase transitions and states of matter.
// anyplot.ai
// phase-diagram-pt: Thermodynamic Phase Diagram (Pressure-Temperature)
// Library: muix 7.29.1 | JavaScript 22.23.2
// Quality: 92/100 | Created: 2026-08-20

import { LineChart } from "@mui/x-charts/LineChart";
import { useXScale, useYScale } from "@mui/x-charts/hooks";
import Box from "@mui/material/Box";
import Typography from "@mui/material/Typography";

const t = window.ANYPLOT_TOKENS;
const W = window.ANYPLOT_SIZE.width;
const H = window.ANYPLOT_SIZE.height;
const TITLE_H = 60;

// ChartsYAxis places the rotated axis label at `tickFontSize + tickSize + 10`
// px from the axis line (its only lever for that offset, independent of the
// actual rendered tick fontSize, which tickLabelStyle controls below) — sized
// to clear the widest pressure tick label ("100 kPa").
const Y_AXIS_LABEL_OFFSET_PX = 85;

// --- Data (representative water phase diagram, deterministic) --------------
// Boundary curves follow the Clausius-Clapeyron relation (sublimation,
// vaporization) and the Simon-Glatzel equation (melting, which captures
// water's anomalous negative solid-liquid slope), each anchored to the
// real IAPWS triple point and critical point of water.

const R = 8.314; // J / (mol K)
const TRIPLE_T = 273.16; // K
const TRIPLE_P = 611.657; // Pa
const CRITICAL_T = 647.1; // K
const CRITICAL_P = 22.064e6; // Pa

function makeSublimation() {
  // Solid-gas boundary: L_sub ≈ 51 kJ/mol
  const LR = 51000 / R;
  const n = 30;
  const T = [];
  const P = [];
  for (let i = 0; i < n; i += 1) {
    const temp = 200 + (i * (TRIPLE_T - 200)) / (n - 1);
    T.push(temp);
    P.push(TRIPLE_P * Math.exp(-LR * (1 / temp - 1 / TRIPLE_T)));
  }
  return { T, P };
}

function makeVaporization() {
  // Liquid-gas boundary, two Clausius-Clapeyron segments (triple->boiling,
  // boiling->critical) so the curve passes through the normal boiling point.
  const BOIL_T = 373.15;
  const BOIL_P = 101325;
  const LR1 = 43364 / R;
  const LR2 = 39448 / R;
  const n1 = 18;
  const n2 = 24;
  const T = [];
  const P = [];
  for (let i = 0; i < n1; i += 1) {
    const temp = TRIPLE_T + (i * (BOIL_T - TRIPLE_T)) / (n1 - 1);
    T.push(temp);
    P.push(TRIPLE_P * Math.exp(-LR1 * (1 / temp - 1 / TRIPLE_T)));
  }
  for (let i = 1; i < n2; i += 1) {
    const temp = BOIL_T + (i * (CRITICAL_T - BOIL_T)) / (n2 - 1);
    T.push(temp);
    P.push(BOIL_P * Math.exp(-LR2 * (1 / temp - 1 / BOIL_T)));
  }
  T[T.length - 1] = CRITICAL_T;
  P[P.length - 1] = CRITICAL_P;
  return { T, P };
}

function makeMelting() {
  // Solid-liquid boundary via the Simon-Glatzel equation for ice Ih, whose
  // negative "a" reproduces water's anomalous negative melting slope.
  const a = -395.2e6;
  const c = 9;
  const n = 36;
  const pMax = 2.4e8;
  const logLo = Math.log10(TRIPLE_P);
  const logHi = Math.log10(pMax);
  const T = [];
  const P = [];
  for (let i = 0; i < n; i += 1) {
    const p = Math.pow(10, logLo + (i * (logHi - logLo)) / (n - 1));
    const temp = TRIPLE_T * Math.pow(1 + (p - TRIPLE_P) / a, 1 / c);
    T.push(temp);
    P.push(p);
  }
  return { T: T.reverse(), P: P.reverse() };
}

const melting = makeMelting();
const vaporization = makeVaporization();
const sublimation = makeSublimation();

const X_MIN = 190;
const X_MAX = 700;
const Y_MIN = 0.1;
const Y_MAX = 3e8;

const formatPressure = (v) => {
  if (v >= 1e6) return `${v / 1e6} MPa`;
  if (v >= 1e3) return `${v / 1e3} kPa`;
  return `${v} Pa`;
};

// --- Phase-region labels, point markers and the supercritical guide --------
// (annotations are explicitly required by the spec: triple/critical points
// marked + annotated, phase regions clearly labeled)

function PhaseAnnotations() {
  const xScale = useXScale("x-melt");
  const yScale = useYScale("pressure");

  const tripleX = xScale(TRIPLE_T);
  const tripleY = yScale(TRIPLE_P);
  const criticalX = xScale(CRITICAL_T);
  const criticalY = yScale(CRITICAL_P);
  const topY = yScale(Y_MAX);
  const rightX = xScale(X_MAX);

  const guide = {
    stroke: t.inkSoft,
    strokeDasharray: "8 6",
    strokeWidth: 1.5,
    opacity: 0.55,
  };
  const regionLabel = {
    fill: t.ink,
    fontSize: 22,
    fontWeight: 600,
    opacity: 0.5,
    textAnchor: "middle",
  };

  return (
    <g>
      {/* Supercritical-fluid boundary, extending from the critical point */}
      <line x1={criticalX} x2={criticalX} y1={criticalY} y2={topY} {...guide} />
      <line x1={criticalX} x2={rightX} y1={criticalY} y2={criticalY} {...guide} />

      {/* Phase region labels */}
      <text x={xScale(235)} y={yScale(2e5)} {...regionLabel}>
        Solid
      </text>
      <text x={xScale(460)} y={yScale(8e6)} {...regionLabel}>
        Liquid
      </text>
      <text x={xScale(430)} y={yScale(30)} {...regionLabel}>
        Gas
      </text>
      <text
        x={xScale(678)}
        y={yScale(8e7)}
        fill={t.inkSoft}
        fontSize={17}
        fontWeight={500}
        textAnchor="middle"
      >
        <tspan x={xScale(678)} dy="0">
          Supercritical
        </tspan>
        <tspan x={xScale(678)} dy="1.2em">
          fluid
        </tspan>
      </text>

      {/* Triple point */}
      <circle cx={tripleX} cy={tripleY} r={9} fill={t.ink} stroke={t.pageBg} strokeWidth={2} />
      <text x={tripleX + 16} y={tripleY - 10} fill={t.ink} fontSize={16} fontWeight={600}>
        Triple point
      </text>
      <text x={tripleX + 16} y={tripleY + 10} fill={t.inkSoft} fontSize={14}>
        273.16 K, 611.7 Pa
      </text>

      {/* Critical point — both lines sit above the point, clear of the
          incoming vaporization curve and the vertical supercritical guide */}
      <circle cx={criticalX} cy={criticalY} r={10} fill={t.ink} stroke={t.pageBg} strokeWidth={2} />
      <text
        x={criticalX - 18}
        y={criticalY - 34}
        fill={t.ink}
        fontSize={16}
        fontWeight={600}
        textAnchor="end"
      >
        Critical point
      </text>
      <text
        x={criticalX - 18}
        y={criticalY - 14}
        fill={t.inkSoft}
        fontSize={14}
        textAnchor="end"
      >
        647.1 K, 22.06 MPa
      </text>
    </g>
  );
}

// --- Chart (default-exported component — the harness mounts it) -------------

export default function Chart() {
  return (
    <Box
      sx={{
        width: W,
        height: H,
        display: "flex",
        flexDirection: "column",
        bgcolor: t.pageBg,
      }}
    >
      <Typography
        sx={{
          height: TITLE_H,
          display: "flex",
          alignItems: "center",
          justifyContent: "center",
          color: t.ink,
          fontSize: 34,
          fontWeight: 500,
          flexShrink: 0,
        }}
      >
        phase-diagram-pt · javascript · muix · anyplot.ai
      </Typography>
      <LineChart
        width={W}
        height={H - TITLE_H}
        skipAnimation
        grid={{ horizontal: true }}
        xAxis={[
          {
            id: "x-melt",
            data: melting.T,
            scaleType: "linear",
            min: X_MIN,
            max: X_MAX,
            label: "Temperature (K)",
            labelStyle: { fontSize: 18 },
            tickLabelStyle: { fontSize: 15 },
            tickNumber: 9,
          },
          { id: "x-vap", data: vaporization.T, scaleType: "linear", min: X_MIN, max: X_MAX },
          { id: "x-sub", data: sublimation.T, scaleType: "linear", min: X_MIN, max: X_MAX },
        ]}
        yAxis={[
          {
            id: "pressure",
            scaleType: "log",
            min: Y_MIN,
            max: Y_MAX,
            label: "Pressure (Pa, log scale)",
            labelStyle: { fontSize: 18 },
            tickLabelStyle: { fontSize: 15 },
            tickFontSize: Y_AXIS_LABEL_OFFSET_PX,
            tickInterval: [1, 10, 100, 1e3, 1e4, 1e5, 1e6, 1e7, 1e8],
            valueFormatter: formatPressure,
          },
        ]}
        series={[
          {
            id: "melting",
            xAxisId: "x-melt",
            yAxisId: "pressure",
            data: melting.P,
            label: "Solid–Liquid boundary (melting)",
            color: t.palette[0],
            showMark: false,
            curve: "monotoneX",
          },
          {
            id: "vaporization",
            xAxisId: "x-vap",
            yAxisId: "pressure",
            data: vaporization.P,
            label: "Liquid–Gas boundary (vaporization)",
            color: t.palette[1],
            showMark: false,
            curve: "monotoneX",
          },
          {
            id: "sublimation",
            xAxisId: "x-sub",
            yAxisId: "pressure",
            data: sublimation.P,
            label: "Solid–Gas boundary (sublimation)",
            color: t.palette[2],
            showMark: false,
            curve: "monotoneX",
          },
        ]}
        slotProps={{
          legend: {
            position: { vertical: "bottom", horizontal: "middle" },
            direction: "row",
            labelStyle: { fontSize: 15 },
          },
        }}
        sx={{
          ".MuiLineElement-series-melting": { strokeWidth: 3.5 },
          ".MuiLineElement-series-vaporization": { strokeWidth: 3.5 },
          ".MuiLineElement-series-sublimation": { strokeWidth: 3.5 },
        }}
        margin={{ left: 165, right: 60, top: 30, bottom: 120 }}
      >
        <PhaseAnnotations />
      </LineChart>
    </Box>
  );
}
Runnable source as JSON, for any HTTP client: https://api.anyplot.ai/specs/phase-diagram-pt/muix/code. Any spec id and library id listed in llms-full.txt fit the same URL shape; every URL below is complete and callable.
{
  "spec_id": "phase-diagram-pt",
  "language": "javascript",
  "library": "muix",
  "page": "https://anyplot.ai/phase-diagram-pt/javascript/muix",
  "hub": "https://anyplot.ai/phase-diagram-pt",
  "code_json": "https://api.anyplot.ai/specs/phase-diagram-pt/muix/code",
  "spec_json": "https://api.anyplot.ai/specs/phase-diagram-pt",
  "render_light_png": "https://storage.googleapis.com/anyplot-images/plots/phase-diagram-pt/javascript/muix/plot-light.png",
  "render_dark_png": "https://storage.googleapis.com/anyplot-images/plots/phase-diagram-pt/javascript/muix/plot-dark.png",
  "interactive_light_html": "https://storage.googleapis.com/anyplot-images/plots/phase-diagram-pt/javascript/muix/plot-light.html",
  "interactive_dark_html": "https://storage.googleapis.com/anyplot-images/plots/phase-diagram-pt/javascript/muix/plot-dark.html",
  "quality_score": 92.0,
  "license": "MIT",
  "guide": "https://anyplot.ai/llms.txt"
}
Part of Thermodynamic Phase Diagram (Pressure-Temperature) on anyplot.ai.