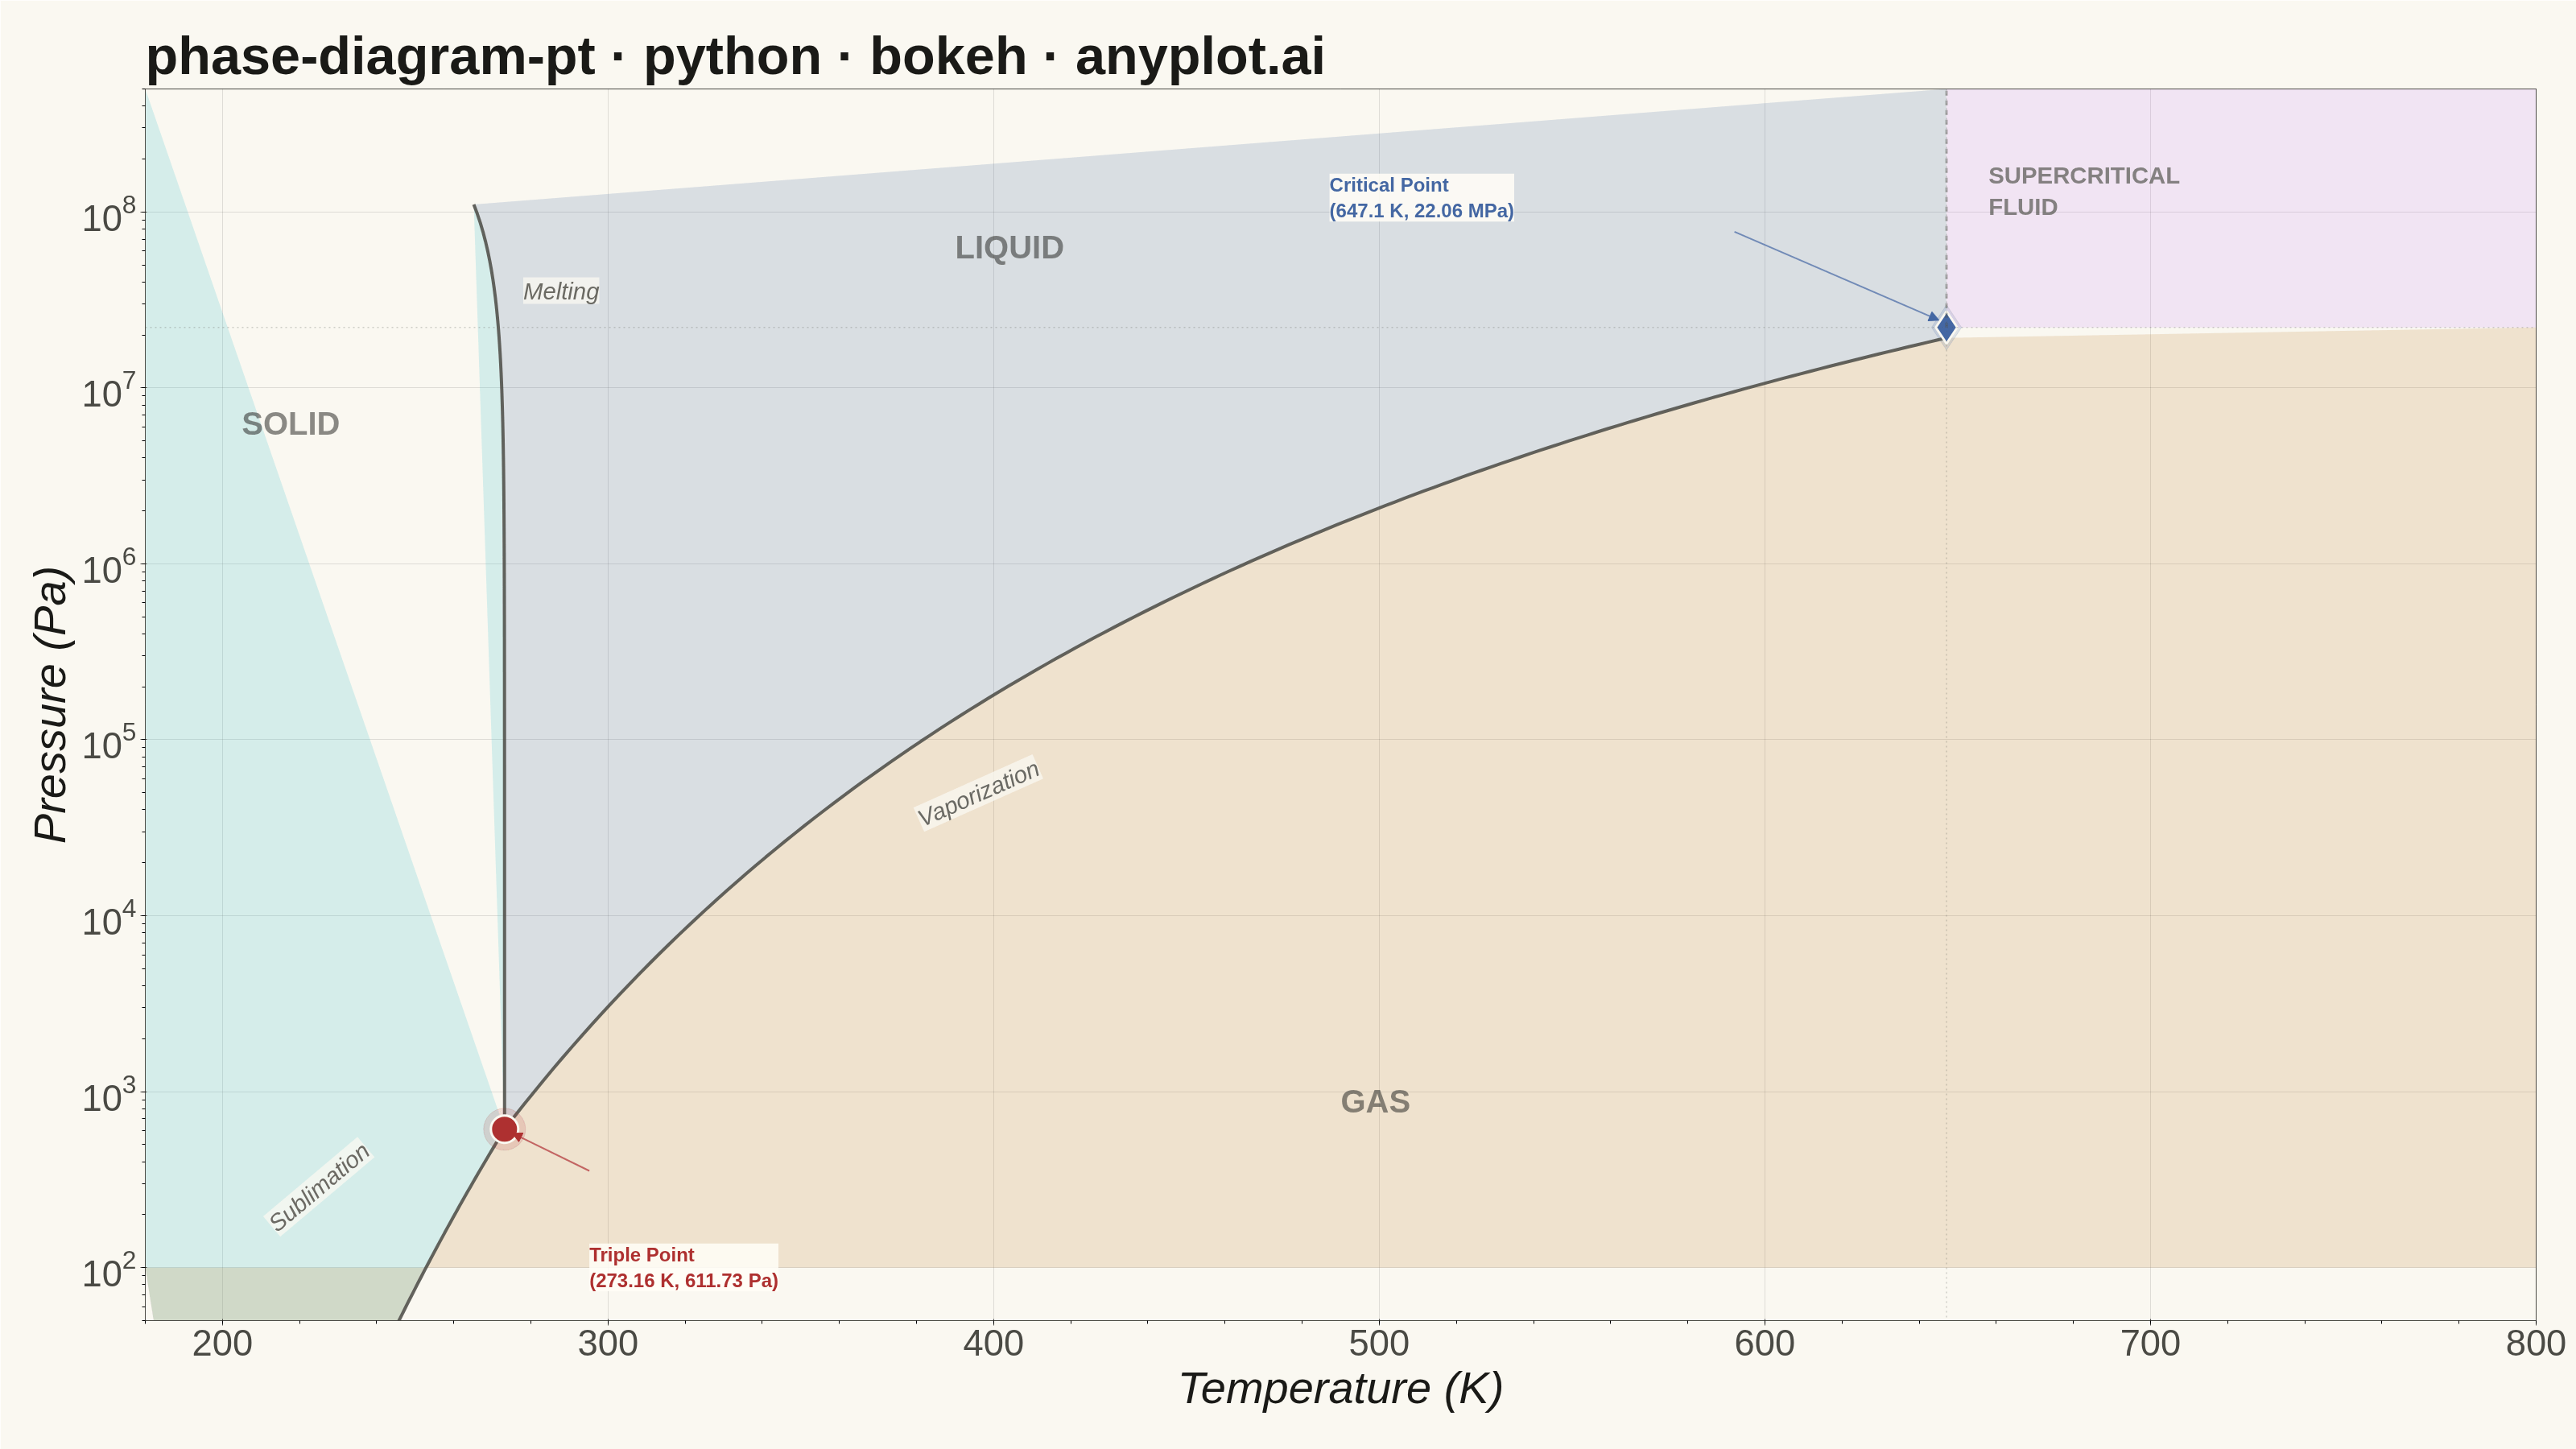
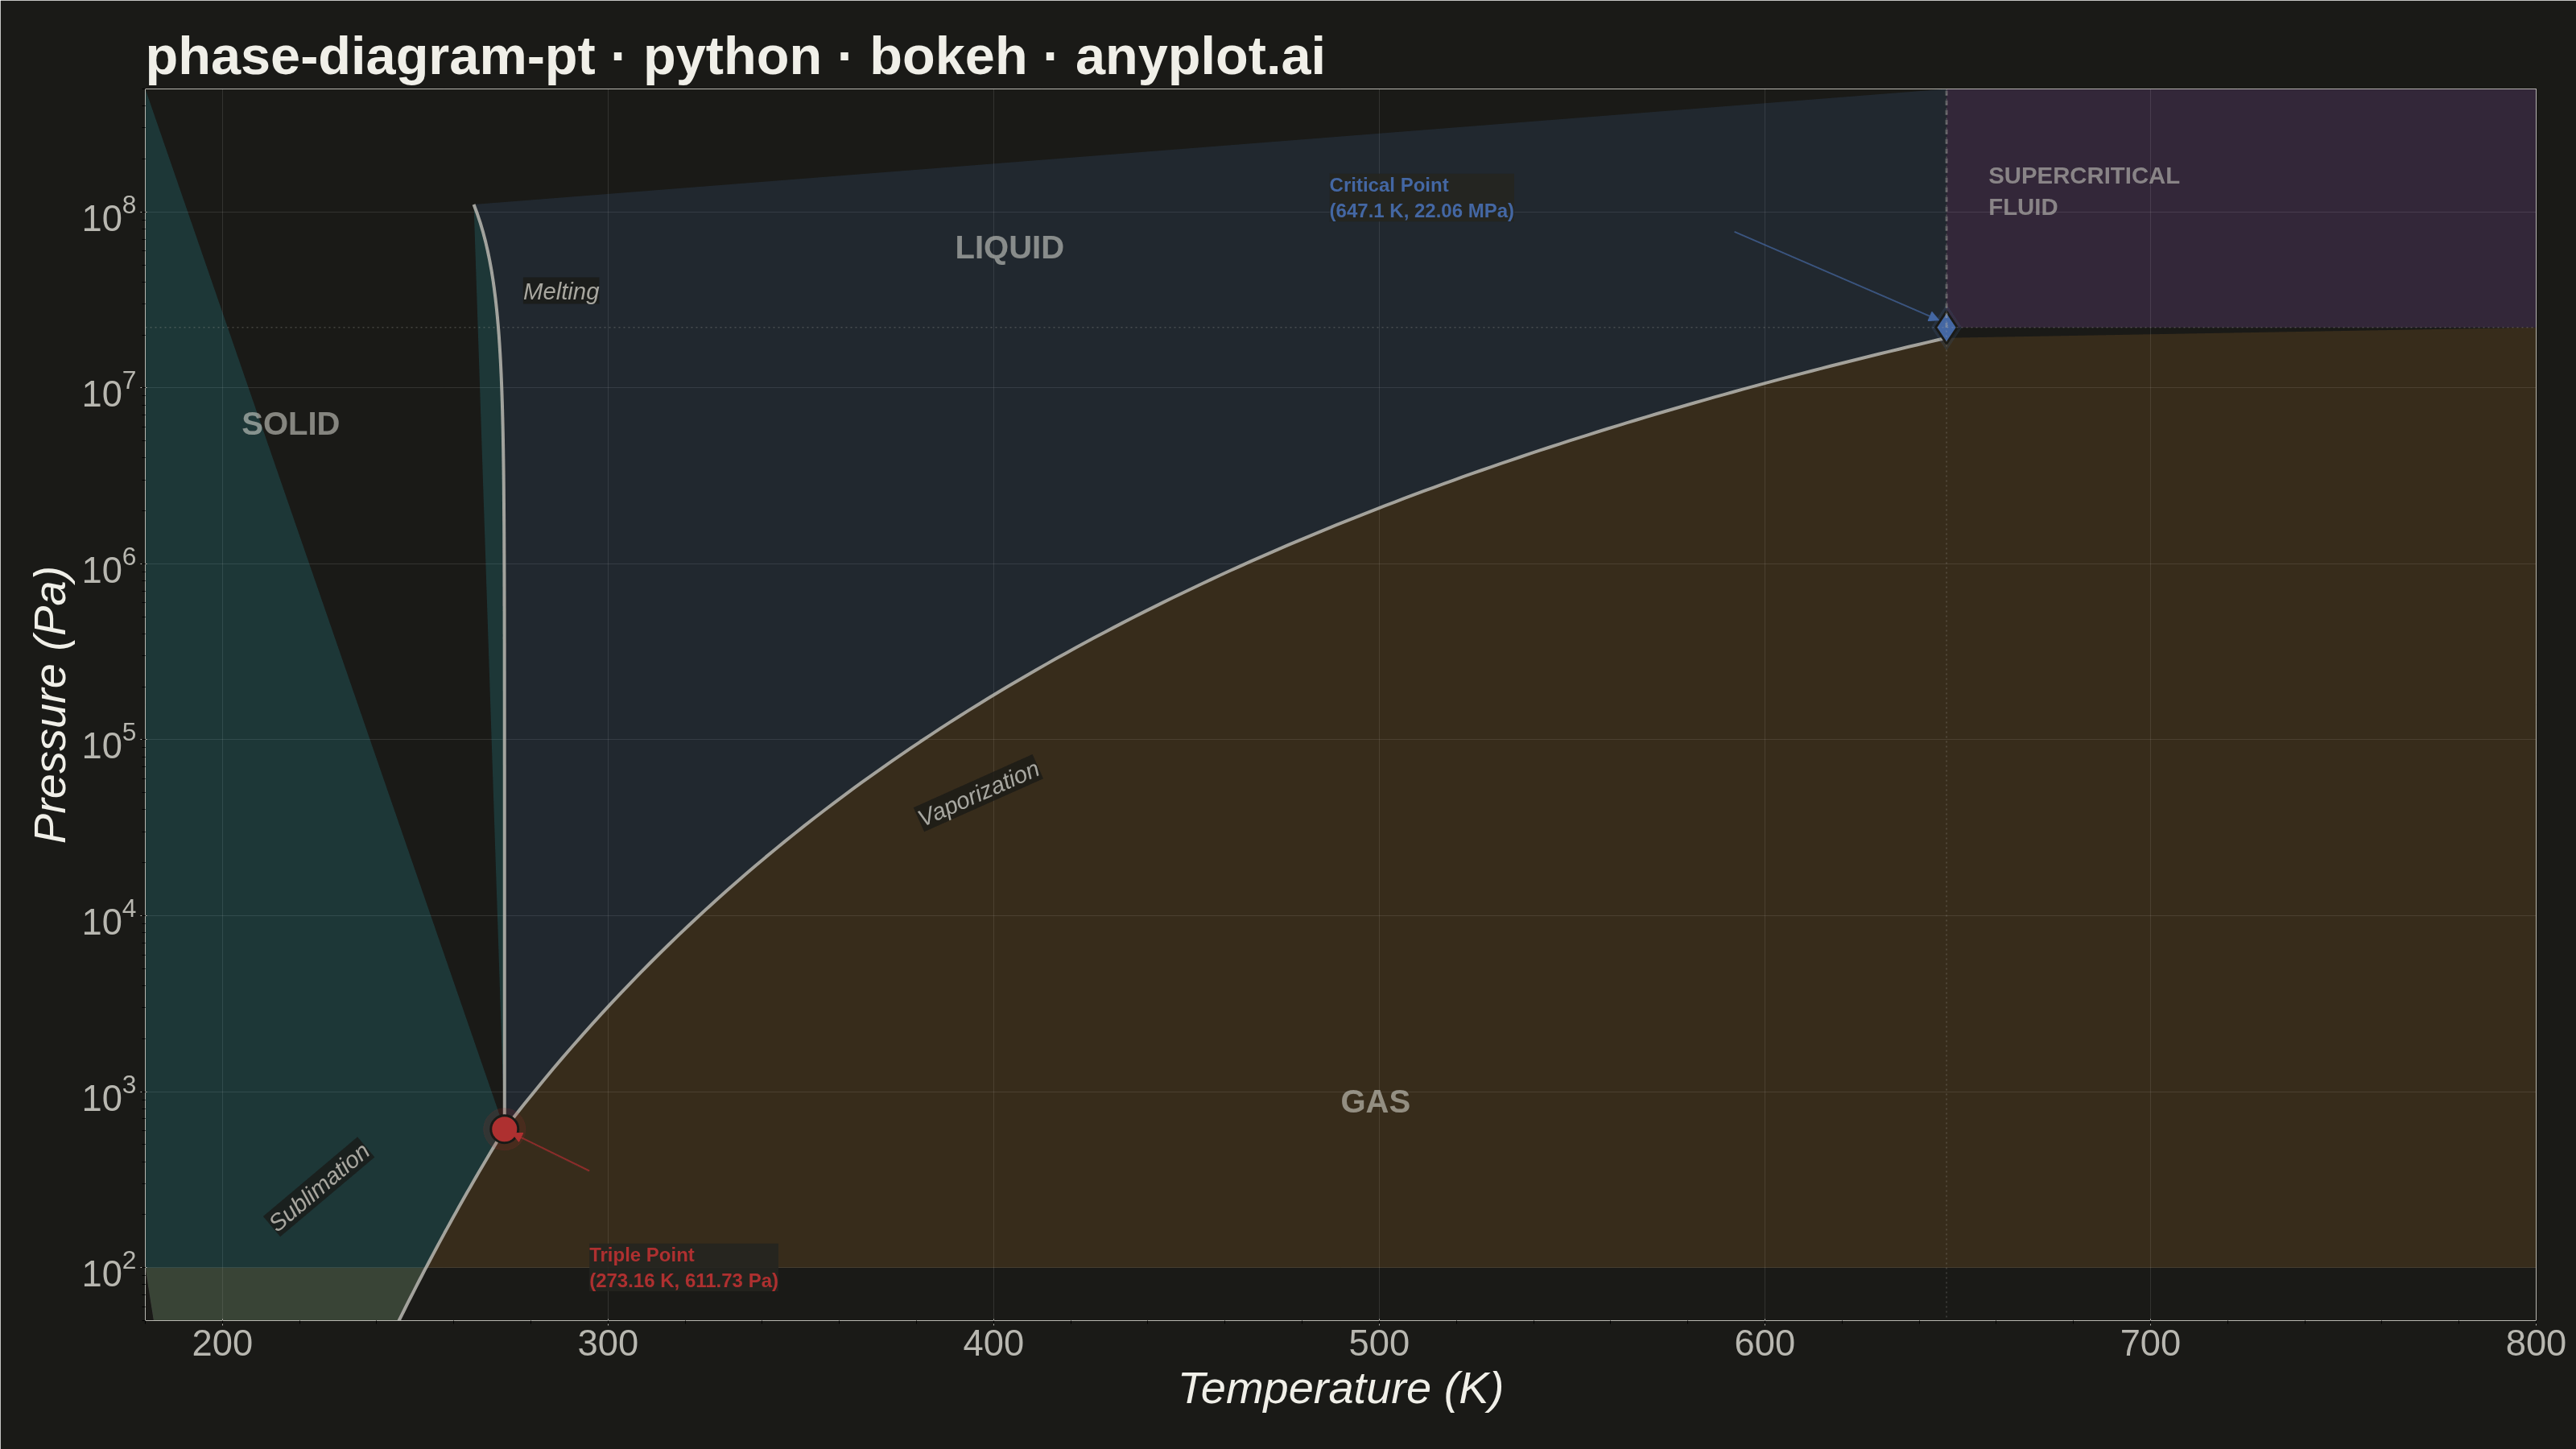
A pressure-temperature (P-T) phase diagram showing the boundaries between solid, liquid, and gas phases of a substance. The diagram includes the triple point where all three phases coexist and the critical point beyond which the liquid-gas distinction vanishes. This is one of the most fundamental diagrams in chemistry and physics, essential for understanding phase transitions and states of matter.
""" anyplot.ai
phase-diagram-pt: Thermodynamic Phase Diagram (Pressure-Temperature)
Library: bokeh 3.9.1 | Python 3.13.13
Quality: 90/100 | Updated: 2026-06-08
"""

import io
import os
import sys


# Prevent self-import: this file is named bokeh.py, so Python adds its directory
# to sys.path[0] and finds this script instead of the installed bokeh package.
_here = os.path.dirname(os.path.abspath(__file__))
sys.path = [p for p in sys.path if not (p and os.path.abspath(p) == _here)]
del _here

import time
from pathlib import Path

import numpy as np
from bokeh.io import output_file, save
from bokeh.models import Arrow, ColumnDataSource, HoverTool, Label, NormalHead, Span
from bokeh.plotting import figure
from PIL import Image
from selenium import webdriver
from selenium.webdriver.chrome.options import Options


# Theme tokens (Imprint palette — theme-adaptive chrome)
THEME = os.getenv("ANYPLOT_THEME", "light")
PAGE_BG = "#FAF8F1" if THEME == "light" else "#1A1A17"
ELEVATED_BG = "#FFFDF6" if THEME == "light" else "#242420"
INK = "#1A1A17" if THEME == "light" else "#F0EFE8"
INK_SOFT = "#4A4A44" if THEME == "light" else "#B8B7B0"
INK_MUTED = "#6B6A63" if THEME == "light" else "#A8A79F"

# Imprint categorical palette — 8 hues, theme-independent
IMPRINT_PALETTE = ["#009E73", "#C475FD", "#4467A3", "#BD8233", "#AE3030", "#2ABCCD", "#954477", "#99B314"]

# Data — Water phase diagram (realistic Clausius-Clapeyron curves)
# Triple point: 273.16 K, 611.73 Pa | Critical point: 647.1 K, 22.064 MPa
triple_T = 273.16
triple_P = 611.73
critical_T = 647.1
critical_P = 22.064e6
R = 8.314

# Sublimation curve (solid-gas boundary, 200 K → triple point)
T_solid_gas = np.linspace(200, triple_T, 100)
L_sub = 51059  # J/mol, sublimation enthalpy of water
P_solid_gas = triple_P * np.exp((L_sub / R) * (1 / triple_T - 1 / T_solid_gas))

# Vaporization curve (liquid-gas boundary, triple point → critical point)
T_liquid_gas = np.linspace(triple_T, critical_T, 150)
L_vap = 40700  # J/mol, vaporization enthalpy of water
P_liquid_gas = triple_P * np.exp((L_vap / R) * (1 / triple_T - 1 / T_liquid_gas))

# Melting curve (solid-liquid boundary, negative slope — water anomaly)
P_solid_liquid = np.logspace(np.log10(triple_P), np.log10(critical_P * 5), 100)
delta_P = np.maximum(P_solid_liquid - triple_P, 0)
T_solid_liquid = triple_T - delta_P * 7.4e-8 + np.power(delta_P / 1e9, 1.5) * 5

# Title — len=46 < 67 baseline, no shrinking needed
title = "phase-diagram-pt · python · bokeh · anyplot.ai"

# Plot
p = figure(
    width=3200,
    height=1800,
    title=title,
    x_axis_label="Temperature (K)",
    y_axis_label="Pressure (Pa)",
    y_axis_type="log",
    toolbar_location=None,
    tools="",
    x_range=(180, 800),
    y_range=(50, 5e8),
    min_border_bottom=160,
    min_border_left=180,
    min_border_top=110,
    min_border_right=50,
)

# Phase region fills — Imprint palette with semantic color cues
# Ice → cyan (#2ABCCD), water → blue (#4467A3), steam → ochre (#BD8233), supercritical → purple (#C475FD)
solid_T = [180, 180] + T_solid_gas.tolist() + T_solid_liquid.tolist()[::-1]
solid_P = [5e8, 100] + P_solid_gas.tolist() + P_solid_liquid.tolist()[::-1]
p.patch(solid_T, solid_P, fill_color="#2ABCCD", fill_alpha=0.18, line_color=None)

gas_T = T_solid_gas.tolist() + [triple_T] + T_liquid_gas.tolist() + [800, 800, 180]
gas_P = P_solid_gas.tolist() + [triple_P] + P_liquid_gas.tolist() + [critical_P, 100, 100]
p.patch(gas_T, gas_P, fill_color="#BD8233", fill_alpha=0.18, line_color=None)

liquid_T = [triple_T] + T_liquid_gas.tolist() + [critical_T] + T_solid_liquid.tolist()[::-1]
liquid_P = [triple_P] + P_liquid_gas.tolist() + [5e8] + P_solid_liquid.tolist()[::-1]
p.patch(liquid_T, liquid_P, fill_color="#4467A3", fill_alpha=0.18, line_color=None)

sc_T = [critical_T, 800, 800, critical_T]
sc_P = [critical_P, critical_P, 5e8, 5e8]
p.patch(sc_T, sc_P, fill_color="#C475FD", fill_alpha=0.15, line_color=None)

# Phase boundary lines — INK_SOFT (structural chrome, same weight for all boundaries)
p.line(T_solid_gas, P_solid_gas, line_width=4, line_color=INK_SOFT, line_alpha=0.85)
p.line(T_liquid_gas, P_liquid_gas, line_width=4, line_color=INK_SOFT, line_alpha=0.85)
p.line(T_solid_liquid, P_solid_liquid, line_width=4, line_color=INK_SOFT, line_alpha=0.85)

# Boundary curve labels — italic, secondary ink, theme-adaptive background fill
p.add_layout(
    Label(
        x=215,
        y=150,
        text="Sublimation",
        text_font_size="22pt",
        text_color=INK_MUTED,
        text_font_style="italic",
        angle=0.7,
        background_fill_color=PAGE_BG,
        background_fill_alpha=0.75,
        level="overlay",
    )
)
p.add_layout(
    Label(
        x=382,
        y=3e4,
        text="Vaporization",
        text_font_size="22pt",
        text_color=INK_MUTED,
        text_font_style="italic",
        angle=0.42,
        background_fill_color=PAGE_BG,
        background_fill_alpha=0.75,
        level="overlay",
    )
)
# Melting label repositioned horizontally to avoid cramping against the nearly-vertical curve
p.add_layout(
    Label(
        x=278,
        y=3e7,
        text="Melting",
        text_font_size="22pt",
        text_color=INK_MUTED,
        text_font_style="italic",
        angle=0,
        background_fill_color=PAGE_BG,
        background_fill_alpha=0.75,
        level="overlay",
    )
)

# Triple point — matte red (#AE3030, semantic special condition) with enlarged glow ring
tp_source = ColumnDataSource(
    data={
        "x": [triple_T],
        "y": [triple_P],
        "name": ["Triple Point"],
        "temp": ["273.16 K"],
        "pres": ["611.73 Pa"],
        "desc": ["All three phases coexist"],
    }
)
p.scatter(x="x", y="y", source=tp_source, size=52, color="#AE3030", alpha=0.15, marker="circle")
tp_glyph = p.scatter(
    x="x", y="y", source=tp_source, size=34, color="#AE3030", marker="circle", line_color=PAGE_BG, line_width=3
)

# Critical point — Imprint blue (#4467A3), diamond marker
cp_source = ColumnDataSource(
    data={
        "x": [critical_T],
        "y": [critical_P],
        "name": ["Critical Point"],
        "temp": ["647.1 K"],
        "pres": ["22.064 MPa"],
        "desc": ["Liquid-gas distinction vanishes"],
    }
)
p.scatter(x="x", y="y", source=cp_source, size=56, color="#4467A3", alpha=0.15, marker="diamond")
cp_glyph = p.scatter(
    x="x", y="y", source=cp_source, size=40, color="#4467A3", marker="diamond", line_color=PAGE_BG, line_width=3
)

# HoverTool — Bokeh-specific interactive feature for special points
hover = HoverTool(
    renderers=[tp_glyph, cp_glyph],
    tooltips=[("Point", "@name"), ("Temperature", "@temp"), ("Pressure", "@pres"), ("Significance", "@desc")],
    point_policy="snap_to_data",
)
p.add_tools(hover)

# Span reference lines at critical coordinates — Bokeh distinctive feature
p.add_layout(
    Span(
        location=critical_P, dimension="width", line_color=INK_MUTED, line_width=1.5, line_alpha=0.3, line_dash="dotted"
    )
)
p.add_layout(
    Span(
        location=critical_T,
        dimension="height",
        line_color=INK_MUTED,
        line_width=1.5,
        line_alpha=0.3,
        line_dash="dotted",
    )
)

# Dashed extension above critical point marking where liquid-gas boundary terminates
p.line(
    [critical_T, critical_T], [critical_P, 5e8], line_width=3, line_color=INK_SOFT, line_alpha=0.4, line_dash="dashed"
)

# Phase region labels — bold, INK color, placed within each region
p.add_layout(
    Label(x=205, y=5e6, text="SOLID", text_font_size="30pt", text_color=INK, text_alpha=0.5, text_font_style="bold")
)
p.add_layout(
    Label(x=390, y=5e7, text="LIQUID", text_font_size="30pt", text_color=INK, text_alpha=0.5, text_font_style="bold")
)
p.add_layout(
    Label(x=490, y=700, text="GAS", text_font_size="30pt", text_color=INK, text_alpha=0.5, text_font_style="bold")
)
# Supercritical label repositioned from right edge toward center of the region
p.add_layout(
    Label(
        x=658,
        y=9e7,
        text="SUPERCRITICAL\nFLUID",
        text_font_size="22pt",
        text_color=INK_SOFT,
        text_alpha=0.65,
        text_font_style="bold",
    )
)

# Triple point annotation with arrow
p.add_layout(
    Label(
        x=triple_T + 22,
        y=triple_P * 0.12,
        text="Triple Point\n(273.16 K, 611.73 Pa)",
        text_font_size="18pt",
        text_color="#AE3030",
        text_font_style="bold",
        background_fill_color=ELEVATED_BG,
        background_fill_alpha=0.88,
    )
)
p.add_layout(
    Arrow(
        end=NormalHead(size=12, fill_color="#AE3030", line_color="#AE3030"),
        x_start=triple_T + 22,
        y_start=triple_P * 0.58,
        x_end=triple_T + 2,
        y_end=triple_P * 0.95,
        line_color="#AE3030",
        line_alpha=0.7,
        line_width=2,
    )
)

# Critical point annotation with arrow
p.add_layout(
    Label(
        x=critical_T - 160,
        y=critical_P * 4,
        text="Critical Point\n(647.1 K, 22.06 MPa)",
        text_font_size="18pt",
        text_color="#4467A3",
        text_font_style="bold",
        background_fill_color=ELEVATED_BG,
        background_fill_alpha=0.88,
    )
)
p.add_layout(
    Arrow(
        end=NormalHead(size=12, fill_color="#4467A3", line_color="#4467A3"),
        x_start=critical_T - 55,
        y_start=critical_P * 3.5,
        x_end=critical_T - 2,
        y_end=critical_P * 1.1,
        line_color="#4467A3",
        line_alpha=0.7,
        line_width=2,
    )
)

# Style — Imprint sizing standards (50pt/42pt/34pt) + theme-adaptive chrome
p.title.text_font_size = "50pt"
p.title.text_color = INK
p.title.text_font_style = "bold"

p.xaxis.axis_label_text_font_size = "42pt"
p.yaxis.axis_label_text_font_size = "42pt"
p.xaxis.axis_label_text_color = INK
p.yaxis.axis_label_text_color = INK
p.xaxis.major_label_text_font_size = "34pt"
p.yaxis.major_label_text_font_size = "34pt"
p.xaxis.major_label_text_color = INK_SOFT
p.yaxis.major_label_text_color = INK_SOFT
p.xaxis.axis_line_color = INK_SOFT
p.yaxis.axis_line_color = INK_SOFT
p.xaxis.major_tick_line_color = INK_SOFT
p.yaxis.major_tick_line_color = INK_SOFT

p.xgrid.grid_line_color = INK
p.ygrid.grid_line_color = INK
p.xgrid.grid_line_alpha = 0.12
p.ygrid.grid_line_alpha = 0.12

p.background_fill_color = PAGE_BG
p.border_fill_color = PAGE_BG
p.outline_line_color = INK_SOFT

# Save HTML (interactive catalog artifact) then screenshot via headless Chrome
output_file(f"plot-{THEME}.html")
save(p)

W, H = 3200, 1800
opts = Options()
for arg in (
    "--headless=new",
    "--no-sandbox",
    "--disable-dev-shm-usage",
    "--disable-gpu",
    f"--window-size={W},{H + 200}",
    "--hide-scrollbars",
    "--force-device-scale-factor=1",
):
    opts.add_argument(arg)
driver = webdriver.Chrome(options=opts)
driver.set_window_size(W, H + 200)
driver.get(f"file://{Path(f'plot-{THEME}.html').resolve()}")
time.sleep(3)
raw = driver.get_screenshot_as_png()
driver.quit()
Image.open(io.BytesIO(raw)).crop((0, 0, W, H)).save(f"plot-{THEME}.png")
Runnable source as JSON, for any HTTP client: https://api.anyplot.ai/specs/phase-diagram-pt/bokeh/code. Any spec id and library id listed in llms-full.txt fit the same URL shape; every URL below is complete and callable.
{
  "spec_id": "phase-diagram-pt",
  "language": "python",
  "library": "bokeh",
  "page": "https://anyplot.ai/phase-diagram-pt/python/bokeh",
  "hub": "https://anyplot.ai/phase-diagram-pt",
  "code_json": "https://api.anyplot.ai/specs/phase-diagram-pt/bokeh/code",
  "spec_json": "https://api.anyplot.ai/specs/phase-diagram-pt",
  "render_light_png": "https://storage.googleapis.com/anyplot-images/plots/phase-diagram-pt/python/bokeh/plot-light.png",
  "render_dark_png": "https://storage.googleapis.com/anyplot-images/plots/phase-diagram-pt/python/bokeh/plot-dark.png",
  "interactive_light_html": "https://storage.googleapis.com/anyplot-images/plots/phase-diagram-pt/python/bokeh/plot-light.html",
  "interactive_dark_html": "https://storage.googleapis.com/anyplot-images/plots/phase-diagram-pt/python/bokeh/plot-dark.html",
  "quality_score": 90.0,
  "license": "MIT",
  "guide": "https://anyplot.ai/llms.txt"
}
Part of Thermodynamic Phase Diagram (Pressure-Temperature) on anyplot.ai.