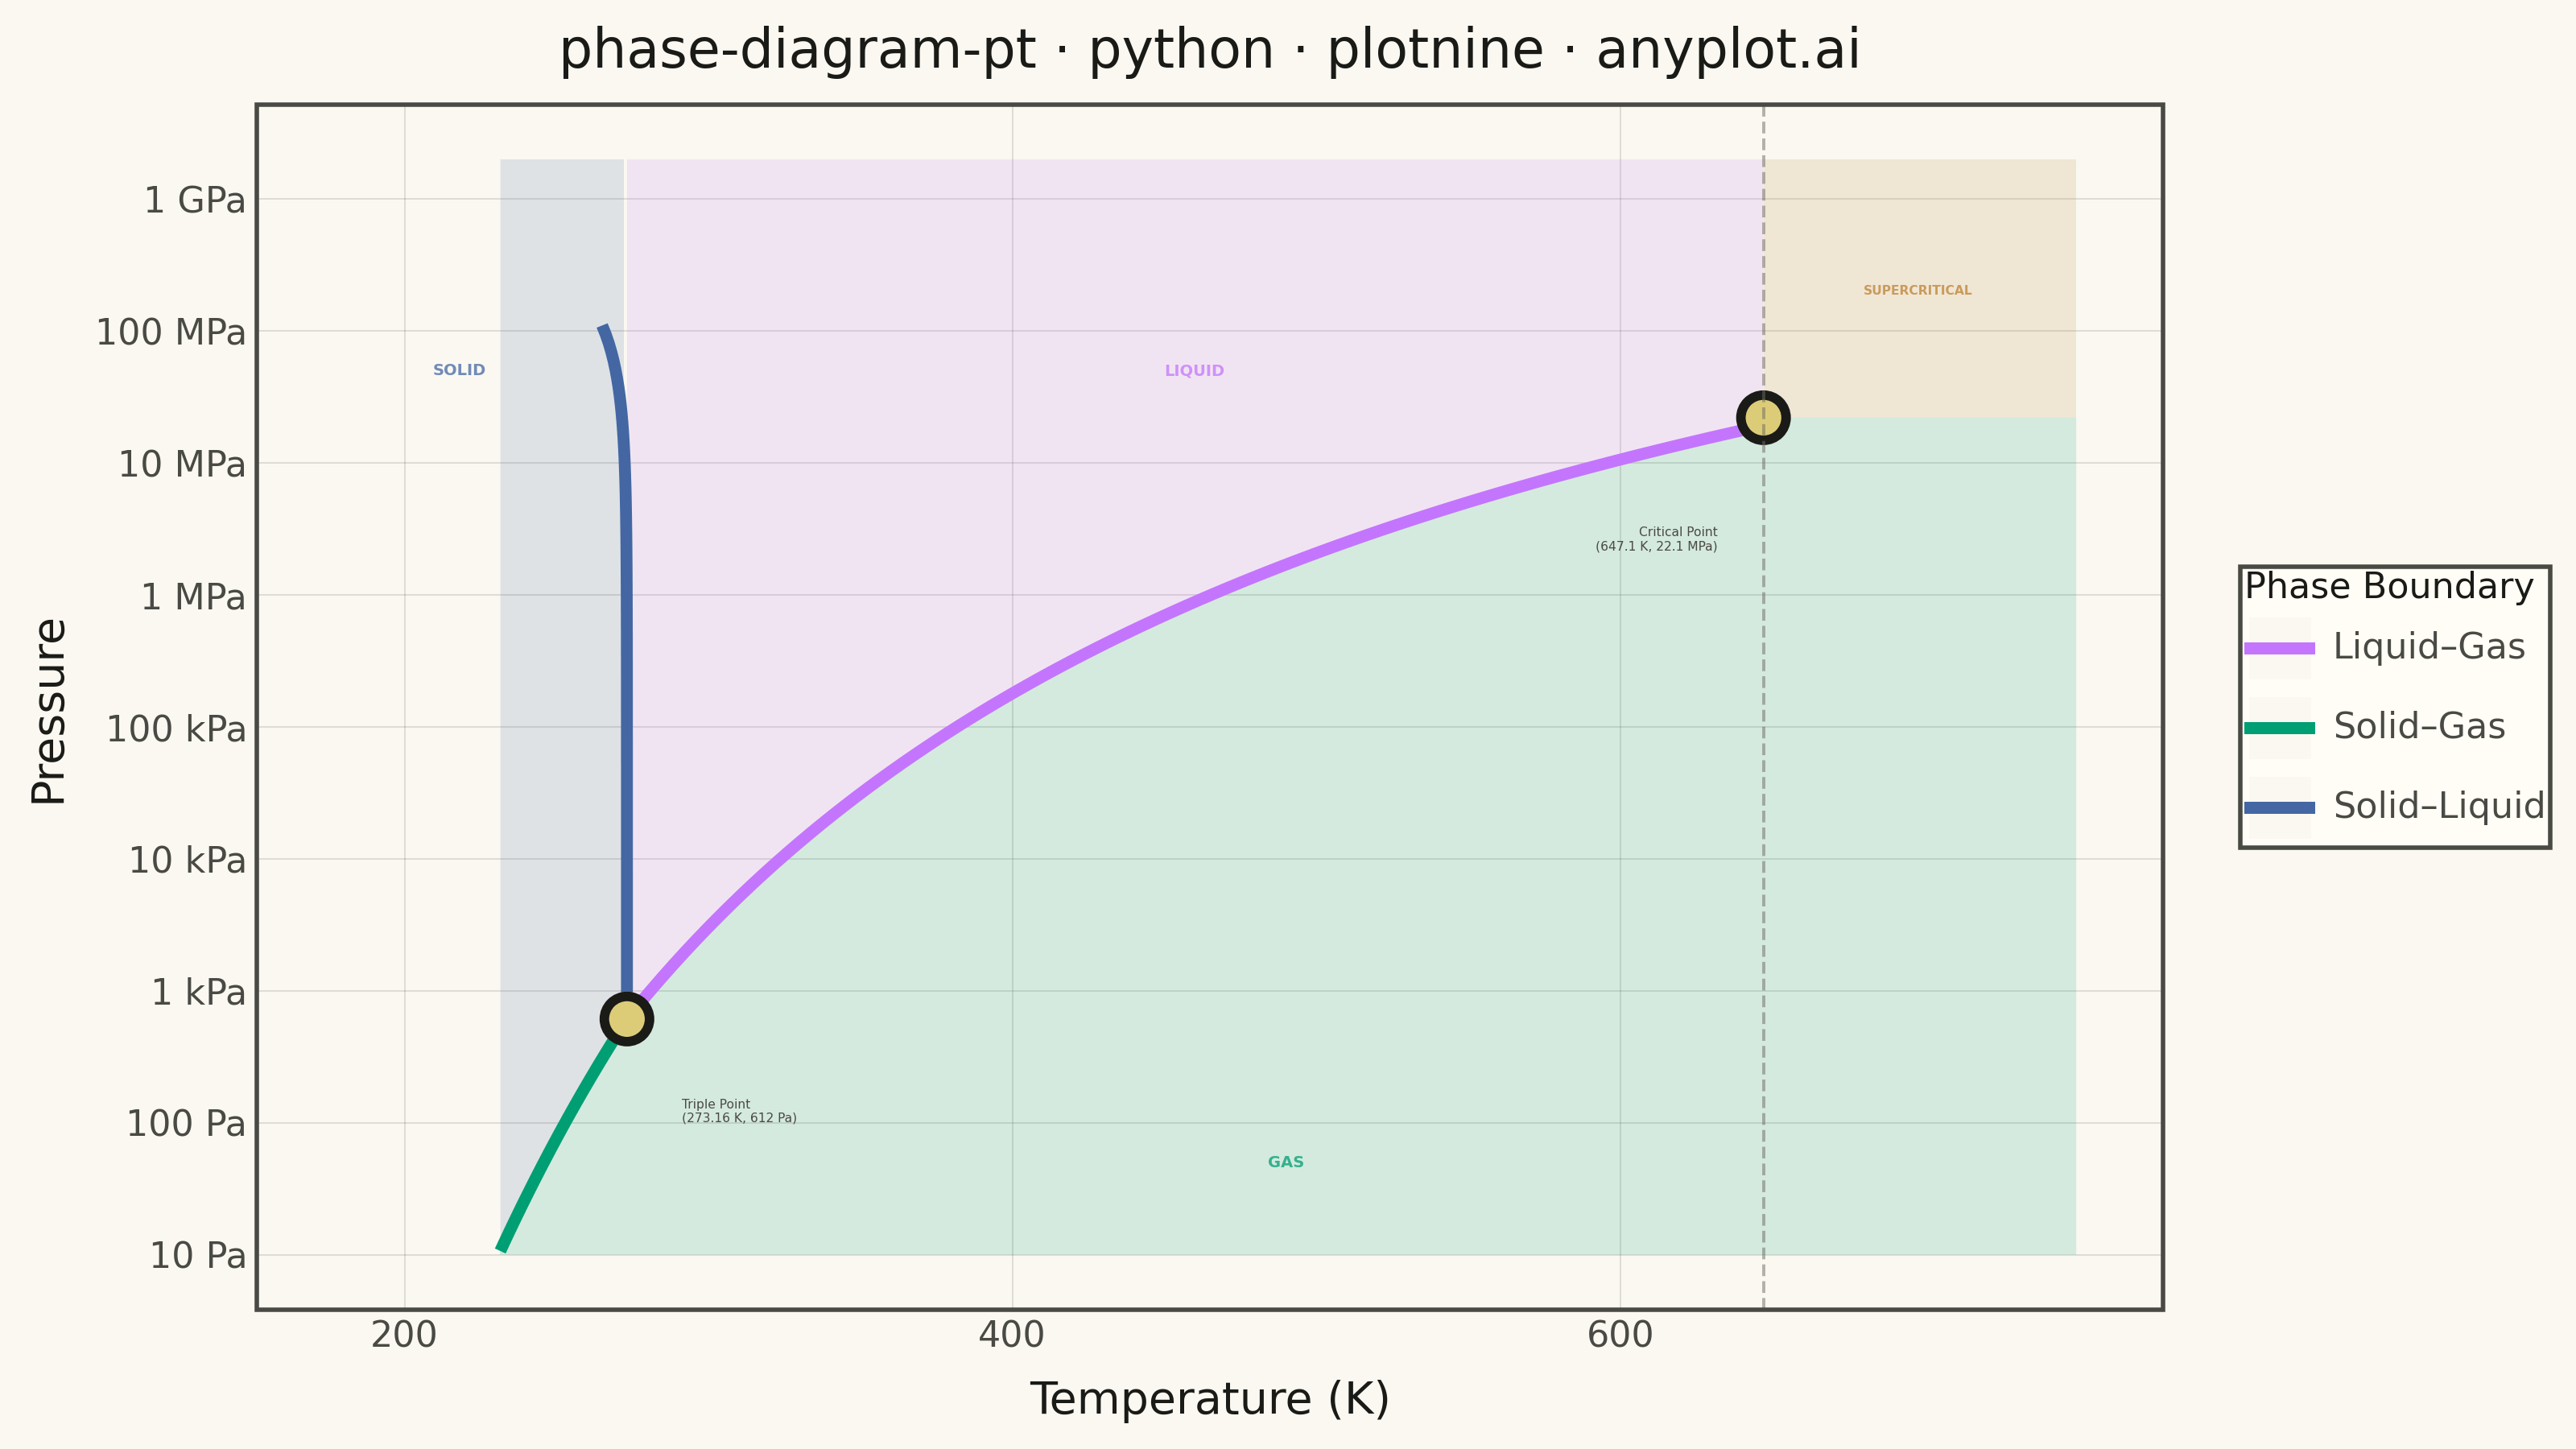
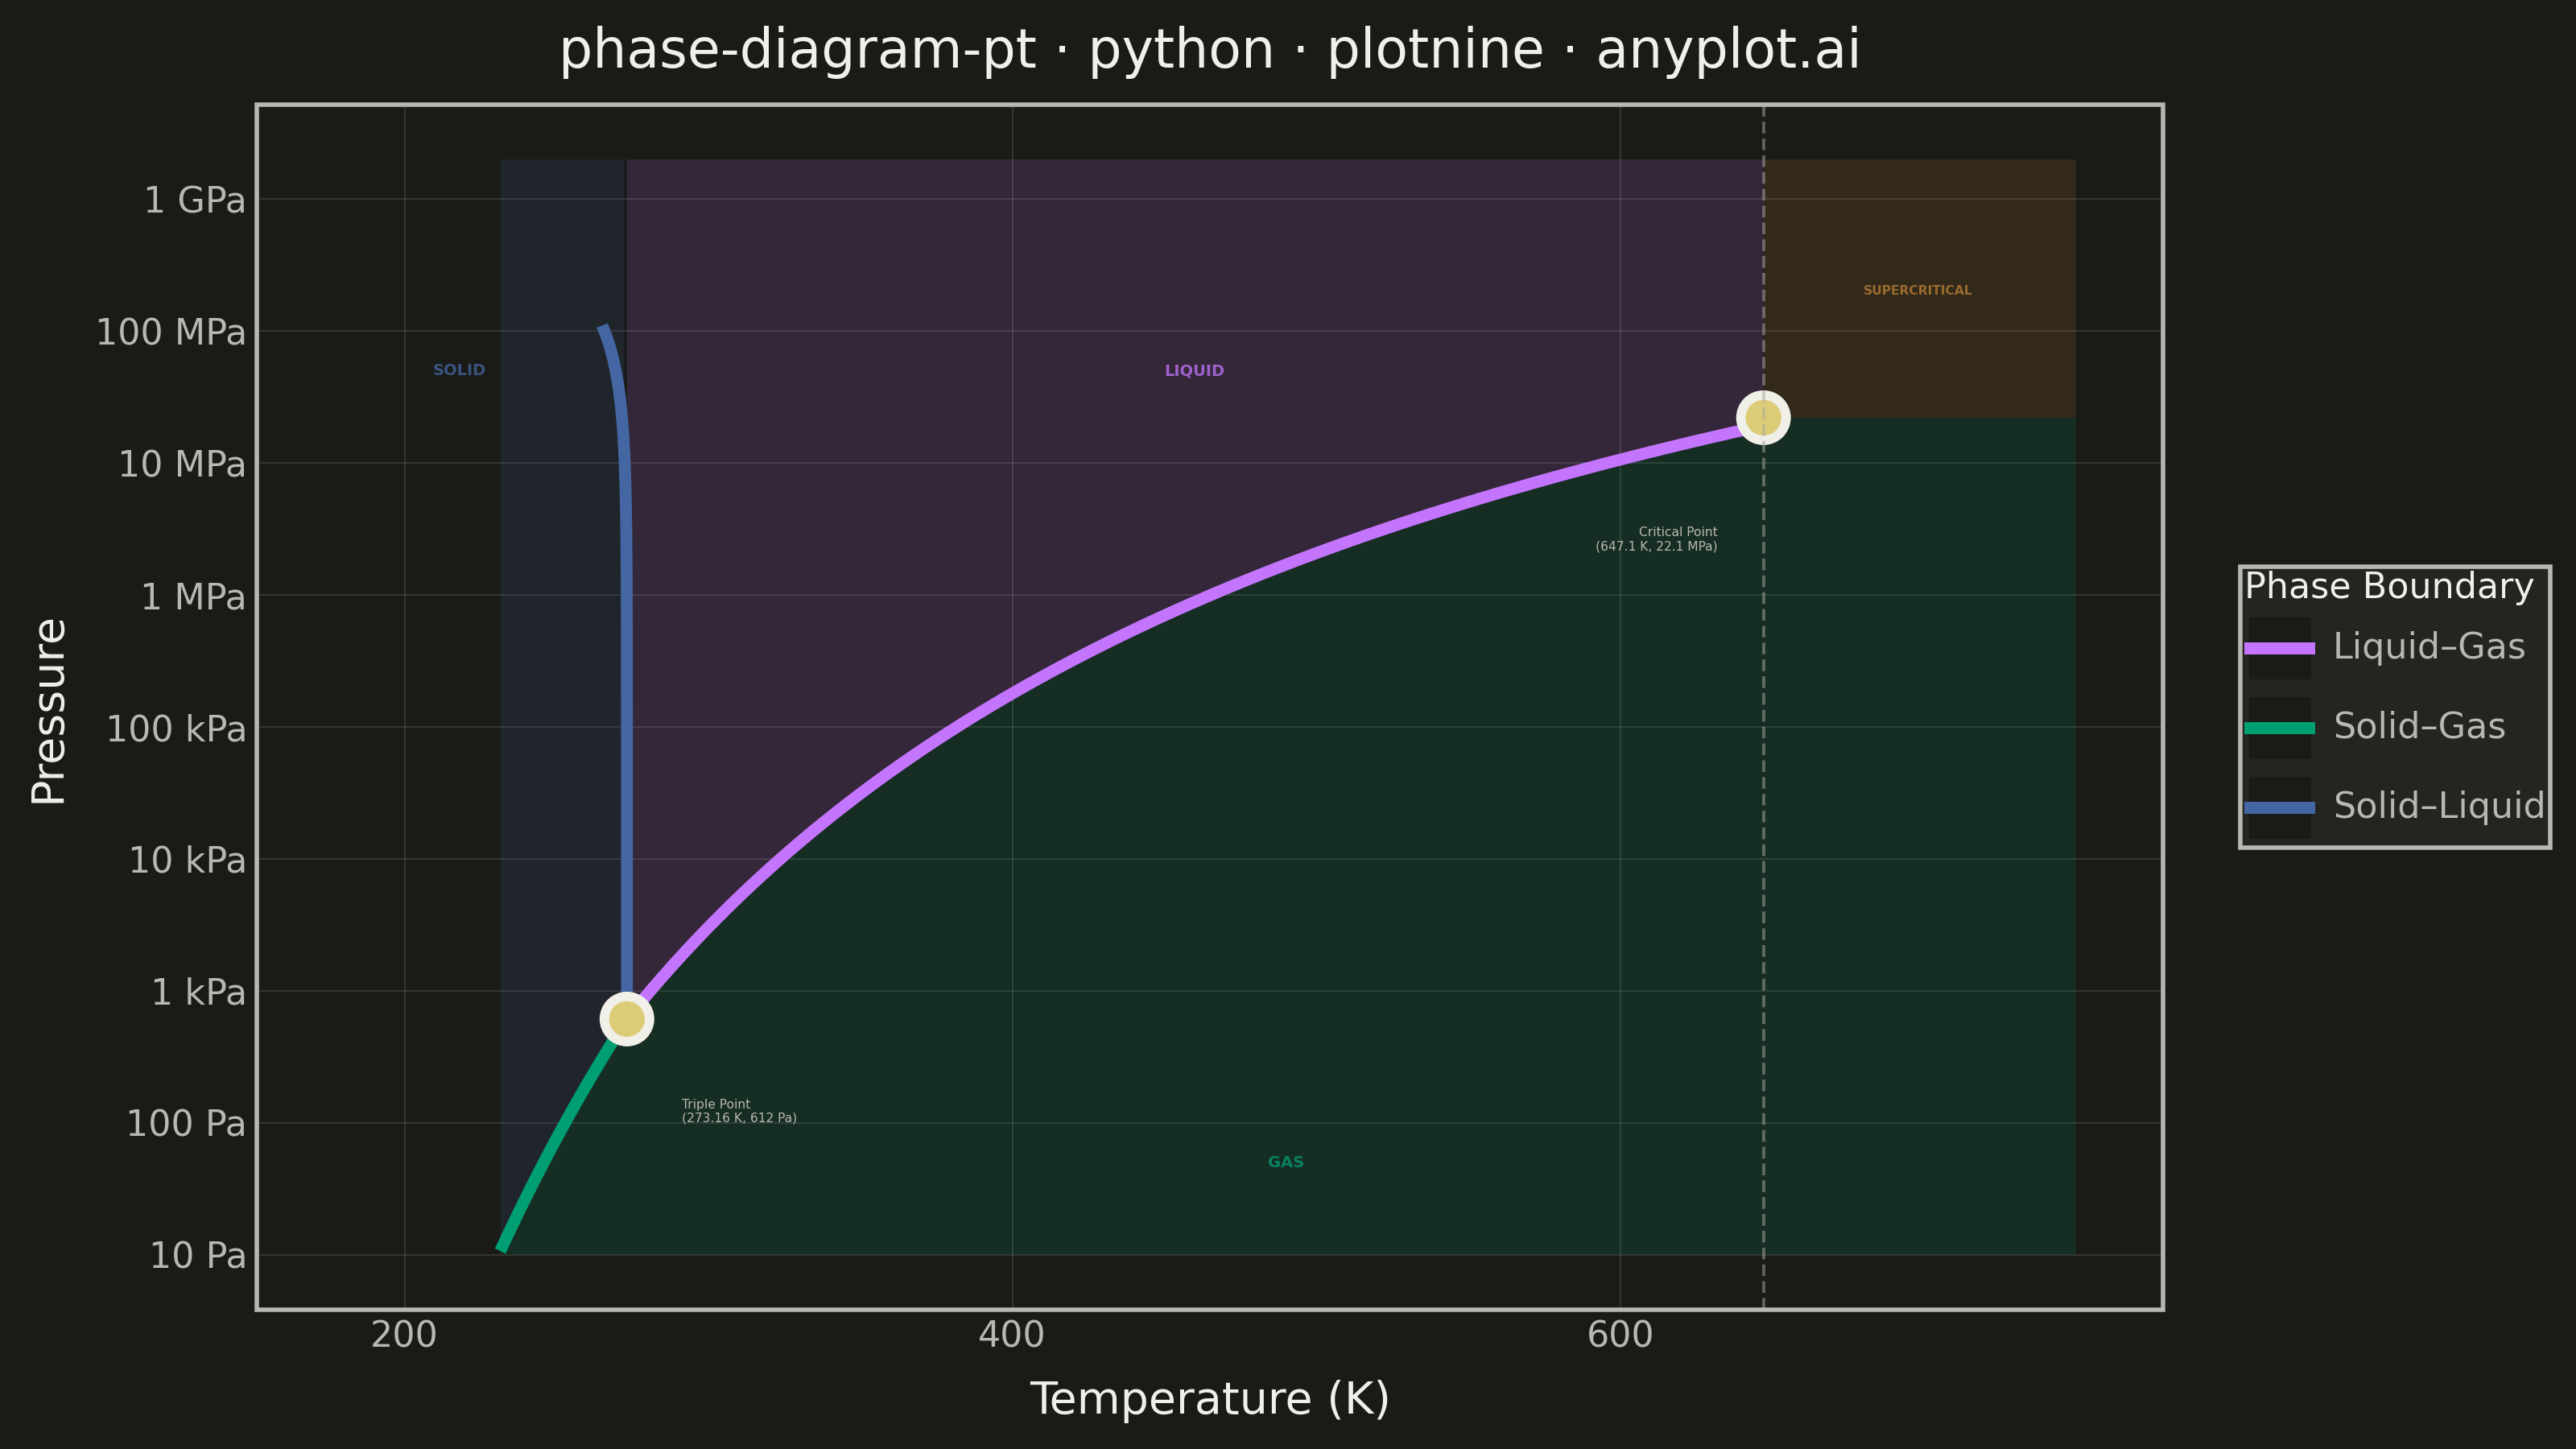
A pressure-temperature (P-T) phase diagram showing the boundaries between solid, liquid, and gas phases of a substance. The diagram includes the triple point where all three phases coexist and the critical point beyond which the liquid-gas distinction vanishes. This is one of the most fundamental diagrams in chemistry and physics, essential for understanding phase transitions and states of matter.
""" anyplot.ai
phase-diagram-pt: Thermodynamic Phase Diagram (Pressure-Temperature)
Library: plotnine 0.15.5 | Python 3.13.13
Quality: 90/100 | Updated: 2026-06-08
"""

import os
import sys

import numpy as np
import pandas as pd


# Work around naming conflict: plotnine.py script shadows the plotnine package
_script_dir = os.path.dirname(os.path.abspath(__file__))
if _script_dir in sys.path:
    sys.path.remove(_script_dir)
if "" in sys.path:
    sys.path.remove("")
if "." in sys.path:
    sys.path.remove(".")

from plotnine import (
    aes,
    annotate,
    element_blank,
    element_line,
    element_rect,
    element_text,
    geom_line,
    geom_point,
    geom_ribbon,
    geom_vline,
    ggplot,
    labs,
    scale_color_manual,
    scale_x_continuous,
    scale_y_log10,
    theme,
    theme_minimal,
)


# Theme tokens — Imprint palette, theme-adaptive chrome
THEME = os.getenv("ANYPLOT_THEME", "light")
PAGE_BG = "#FAF8F1" if THEME == "light" else "#1A1A17"
ELEVATED_BG = "#FFFDF6" if THEME == "light" else "#242420"
INK = "#1A1A17" if THEME == "light" else "#F0EFE8"
INK_SOFT = "#4A4A44" if THEME == "light" else "#B8B7B0"
INK_MUTED = "#6B6A63" if THEME == "light" else "#A8A79F"

# Imprint categorical palette (hybrid-v3 sort order)
IMPRINT_PALETTE = ["#009E73", "#C475FD", "#4467A3", "#BD8233", "#AE3030", "#2ABCCD", "#954477", "#99B314"]
ANYPLOT_AMBER = "#DDCC77"  # warning / caution anchor — used for special point markers

# Data — Water phase diagram (accurate physical constants)
# Triple point: 273.16 K, 611.73 Pa
# Critical point: 647.1 K, 22.064 MPa
R = 8.314  # J/(mol·K)
T_triple = 273.16
P_triple = 611.73
T_critical = 647.1
P_critical = 22.064e6

# Solid-gas boundary (sublimation curve) via Clausius-Clapeyron
L_sub = 51060  # J/mol, latent heat of sublimation
T_sub = np.linspace(200, T_triple, 80)
P_sub = P_triple * np.exp((L_sub / R) * (1 / T_triple - 1 / T_sub))

# Liquid-gas boundary (vaporization curve) via Clausius-Clapeyron
L_vap = 40700  # J/mol, latent heat of vaporization
T_vap = np.linspace(T_triple, T_critical, 100)
P_vap = P_triple * np.exp((L_vap / R) * (1 / T_triple - 1 / T_vap))

# Solid-liquid boundary (melting curve) — water's anomalous negative slope
P_melt = np.logspace(np.log10(P_triple), np.log10(P_critical * 5), 80)
T_melt = T_triple - 7.4e-8 * (P_melt - P_triple)

# Build dataframe for boundary curves
df_sub = pd.DataFrame({"temperature": T_sub, "pressure": P_sub, "boundary": "Solid–Gas"})
df_vap = pd.DataFrame({"temperature": T_vap, "pressure": P_vap, "boundary": "Liquid–Gas"})
df_melt = pd.DataFrame({"temperature": T_melt, "pressure": P_melt, "boundary": "Solid–Liquid"})
df = pd.concat([df_sub, df_vap, df_melt], ignore_index=True)

# Special points (triple + critical)
df_points = pd.DataFrame({"temperature": [T_triple, T_critical], "pressure": [P_triple, P_critical]})

# Phase region fills — separate ribbons per region (plotnine layer composition)
P_min = 10
P_max = 2e9
T_min = 180
T_max = 750

n_fill = 60
T_solid_fill = np.linspace(T_min, T_triple - 1, n_fill)
P_solid_lower = P_triple * np.exp((L_sub / R) * (1 / T_triple - 1 / T_solid_fill))
df_solid = pd.DataFrame({"temperature": T_solid_fill, "ymin": P_solid_lower, "ymax": np.full(n_fill, P_max)})

T_gas_sub = np.linspace(T_min, T_triple, 30)
P_gas_sub_upper = P_triple * np.exp((L_sub / R) * (1 / T_triple - 1 / T_gas_sub))
T_gas_vap = np.linspace(T_triple, T_critical, 30)
P_gas_vap_upper = P_triple * np.exp((L_vap / R) * (1 / T_triple - 1 / T_gas_vap))
T_gas_beyond = np.linspace(T_critical, T_max, 15)
P_gas_beyond_upper = np.full(15, P_critical)
df_gas = pd.DataFrame(
    {
        "temperature": np.concatenate([T_gas_sub, T_gas_vap, T_gas_beyond]),
        "ymin": np.full(75, P_min),
        "ymax": np.concatenate([P_gas_sub_upper, P_gas_vap_upper, P_gas_beyond_upper]),
    }
)

T_liq = np.linspace(T_triple, T_critical, n_fill)
P_liq_lower = P_triple * np.exp((L_vap / R) * (1 / T_triple - 1 / T_liq))
df_liquid = pd.DataFrame({"temperature": T_liq, "ymin": P_liq_lower, "ymax": np.full(n_fill, P_max)})

T_sc = np.linspace(T_critical, T_max, 30)
df_supercritical = pd.DataFrame({"temperature": T_sc, "ymin": np.full(30, P_critical), "ymax": np.full(30, P_max)})

# Imprint palette: boundaries in canonical order (positions 1–3)
boundary_colors = {
    "Solid–Gas": IMPRINT_PALETTE[0],  # brand green
    "Liquid–Gas": IMPRINT_PALETTE[1],  # lavender
    "Solid–Liquid": IMPRINT_PALETTE[2],  # blue
}

# Pressure axis: pre-computed breaks and labels spanning 9 log-scale decades
pressure_breaks = [10, 100, 1000, 1e4, 1e5, 1e6, 1e7, 1e8, 1e9]
pressure_labels = ["10 Pa", "100 Pa", "1 kPa", "10 kPa", "100 kPa", "1 MPa", "10 MPa", "100 MPa", "1 GPa"]

title = "phase-diagram-pt · python · plotnine · anyplot.ai"
n = len(title)
title_fontsize = round(12 * 67 / n) if n > 67 else 12

plot = (
    ggplot()
    # Phase region fills — color matches corresponding boundary curve
    + geom_ribbon(
        data=df_solid,
        mapping=aes(x="temperature", ymin="ymin", ymax="ymax"),
        fill=IMPRINT_PALETTE[2],
        alpha=0.15,
        inherit_aes=False,
    )
    + geom_ribbon(
        data=df_gas,
        mapping=aes(x="temperature", ymin="ymin", ymax="ymax"),
        fill=IMPRINT_PALETTE[0],
        alpha=0.15,
        inherit_aes=False,
    )
    + geom_ribbon(
        data=df_liquid,
        mapping=aes(x="temperature", ymin="ymin", ymax="ymax"),
        fill=IMPRINT_PALETTE[1],
        alpha=0.15,
        inherit_aes=False,
    )
    + geom_ribbon(
        data=df_supercritical,
        mapping=aes(x="temperature", ymin="ymin", ymax="ymax"),
        fill=IMPRINT_PALETTE[3],
        alpha=0.15,
        inherit_aes=False,
    )
    # Boundary curves — Imprint palette canonical order
    + geom_line(data=df, mapping=aes(x="temperature", y="pressure", color="boundary"), size=1.5)
    # Triple point and critical point: amber fill, ink border
    + geom_point(
        data=df_points,
        mapping=aes(x="temperature", y="pressure"),
        color=INK,
        fill=ANYPLOT_AMBER,
        size=4.5,
        stroke=1.2,
        shape="o",
        inherit_aes=False,
    )
    + scale_color_manual(values=boundary_colors)
    + scale_y_log10(breaks=pressure_breaks, labels=pressure_labels, limits=(P_min, P_max))
    + scale_x_continuous(limits=(T_min, T_max))
    # Phase region labels — color matches fill color for visual coherence
    + annotate("text", x=218, y=5e7, label="SOLID", size=3.5, color=IMPRINT_PALETTE[2], alpha=0.75, fontweight="bold")
    + annotate("text", x=460, y=5e7, label="LIQUID", size=3.5, color=IMPRINT_PALETTE[1], alpha=0.75, fontweight="bold")
    + annotate("text", x=490, y=50, label="GAS", size=3.5, color=IMPRINT_PALETTE[0], alpha=0.75, fontweight="bold")
    + annotate(
        "text",
        x=698,
        y=2e8,
        label="SUPERCRITICAL",
        size=2.8,
        color=IMPRINT_PALETTE[3],
        alpha=0.75,
        fontweight="bold",
        ha="center",
    )
    # Triple point coordinate annotation
    + annotate(
        "text",
        x=T_triple + 18,
        y=P_triple * 0.25,
        label=f"Triple Point\n({T_triple} K, {P_triple:.0f} Pa)",
        size=2.8,
        color=INK_SOFT,
        ha="left",
        va="top",
    )
    # Critical point coordinate annotation
    + annotate(
        "text",
        x=T_critical - 15,
        y=P_critical * 0.15,
        label=f"Critical Point\n({T_critical} K, {P_critical / 1e6:.1f} MPa)",
        size=2.8,
        color=INK_SOFT,
        ha="right",
        va="top",
    )
    # Dashed vertical line at critical temperature
    + geom_vline(xintercept=T_critical, linetype="dashed", color=INK_MUTED, size=0.4, alpha=0.5)
    + labs(x="Temperature (K)", y="Pressure", title=title, color="Phase Boundary")
    + theme_minimal()
    + theme(
        figure_size=(8, 4.5),
        text=element_text(size=7, color=INK_SOFT),
        axis_title=element_text(size=10, color=INK),
        axis_text=element_text(size=8, color=INK_SOFT),
        plot_title=element_text(size=title_fontsize, color=INK),
        legend_title=element_text(size=8, color=INK),
        legend_text=element_text(size=8, color=INK_SOFT),
        legend_position="right",
        legend_background=element_rect(fill=ELEVATED_BG, color=INK_SOFT),
        panel_background=element_rect(fill=PAGE_BG),
        plot_background=element_rect(fill=PAGE_BG, color=PAGE_BG),
        panel_grid_major=element_line(color=INK, size=0.3, alpha=0.15),
        panel_grid_minor=element_blank(),
        axis_line_x=element_line(color=INK_SOFT, size=0.5),
        axis_line_y=element_line(color=INK_SOFT, size=0.5),
        panel_border=element_rect(color=INK_SOFT, fill=None),
    )
)

plot.save(f"plot-{THEME}.png", dpi=400, width=8, height=4.5, units="in", verbose=False)
Runnable source as JSON, for any HTTP client: https://api.anyplot.ai/specs/phase-diagram-pt/plotnine/code. Any spec id and library id listed in llms-full.txt fit the same URL shape; every URL below is complete and callable.
{
  "spec_id": "phase-diagram-pt",
  "language": "python",
  "library": "plotnine",
  "page": "https://anyplot.ai/phase-diagram-pt/python/plotnine",
  "hub": "https://anyplot.ai/phase-diagram-pt",
  "code_json": "https://api.anyplot.ai/specs/phase-diagram-pt/plotnine/code",
  "spec_json": "https://api.anyplot.ai/specs/phase-diagram-pt",
  "render_light_png": "https://storage.googleapis.com/anyplot-images/plots/phase-diagram-pt/python/plotnine/plot-light.png",
  "render_dark_png": "https://storage.googleapis.com/anyplot-images/plots/phase-diagram-pt/python/plotnine/plot-dark.png",
  "quality_score": 90.0,
  "license": "MIT",
  "guide": "https://anyplot.ai/llms.txt"
}
Part of Thermodynamic Phase Diagram (Pressure-Temperature) on anyplot.ai.