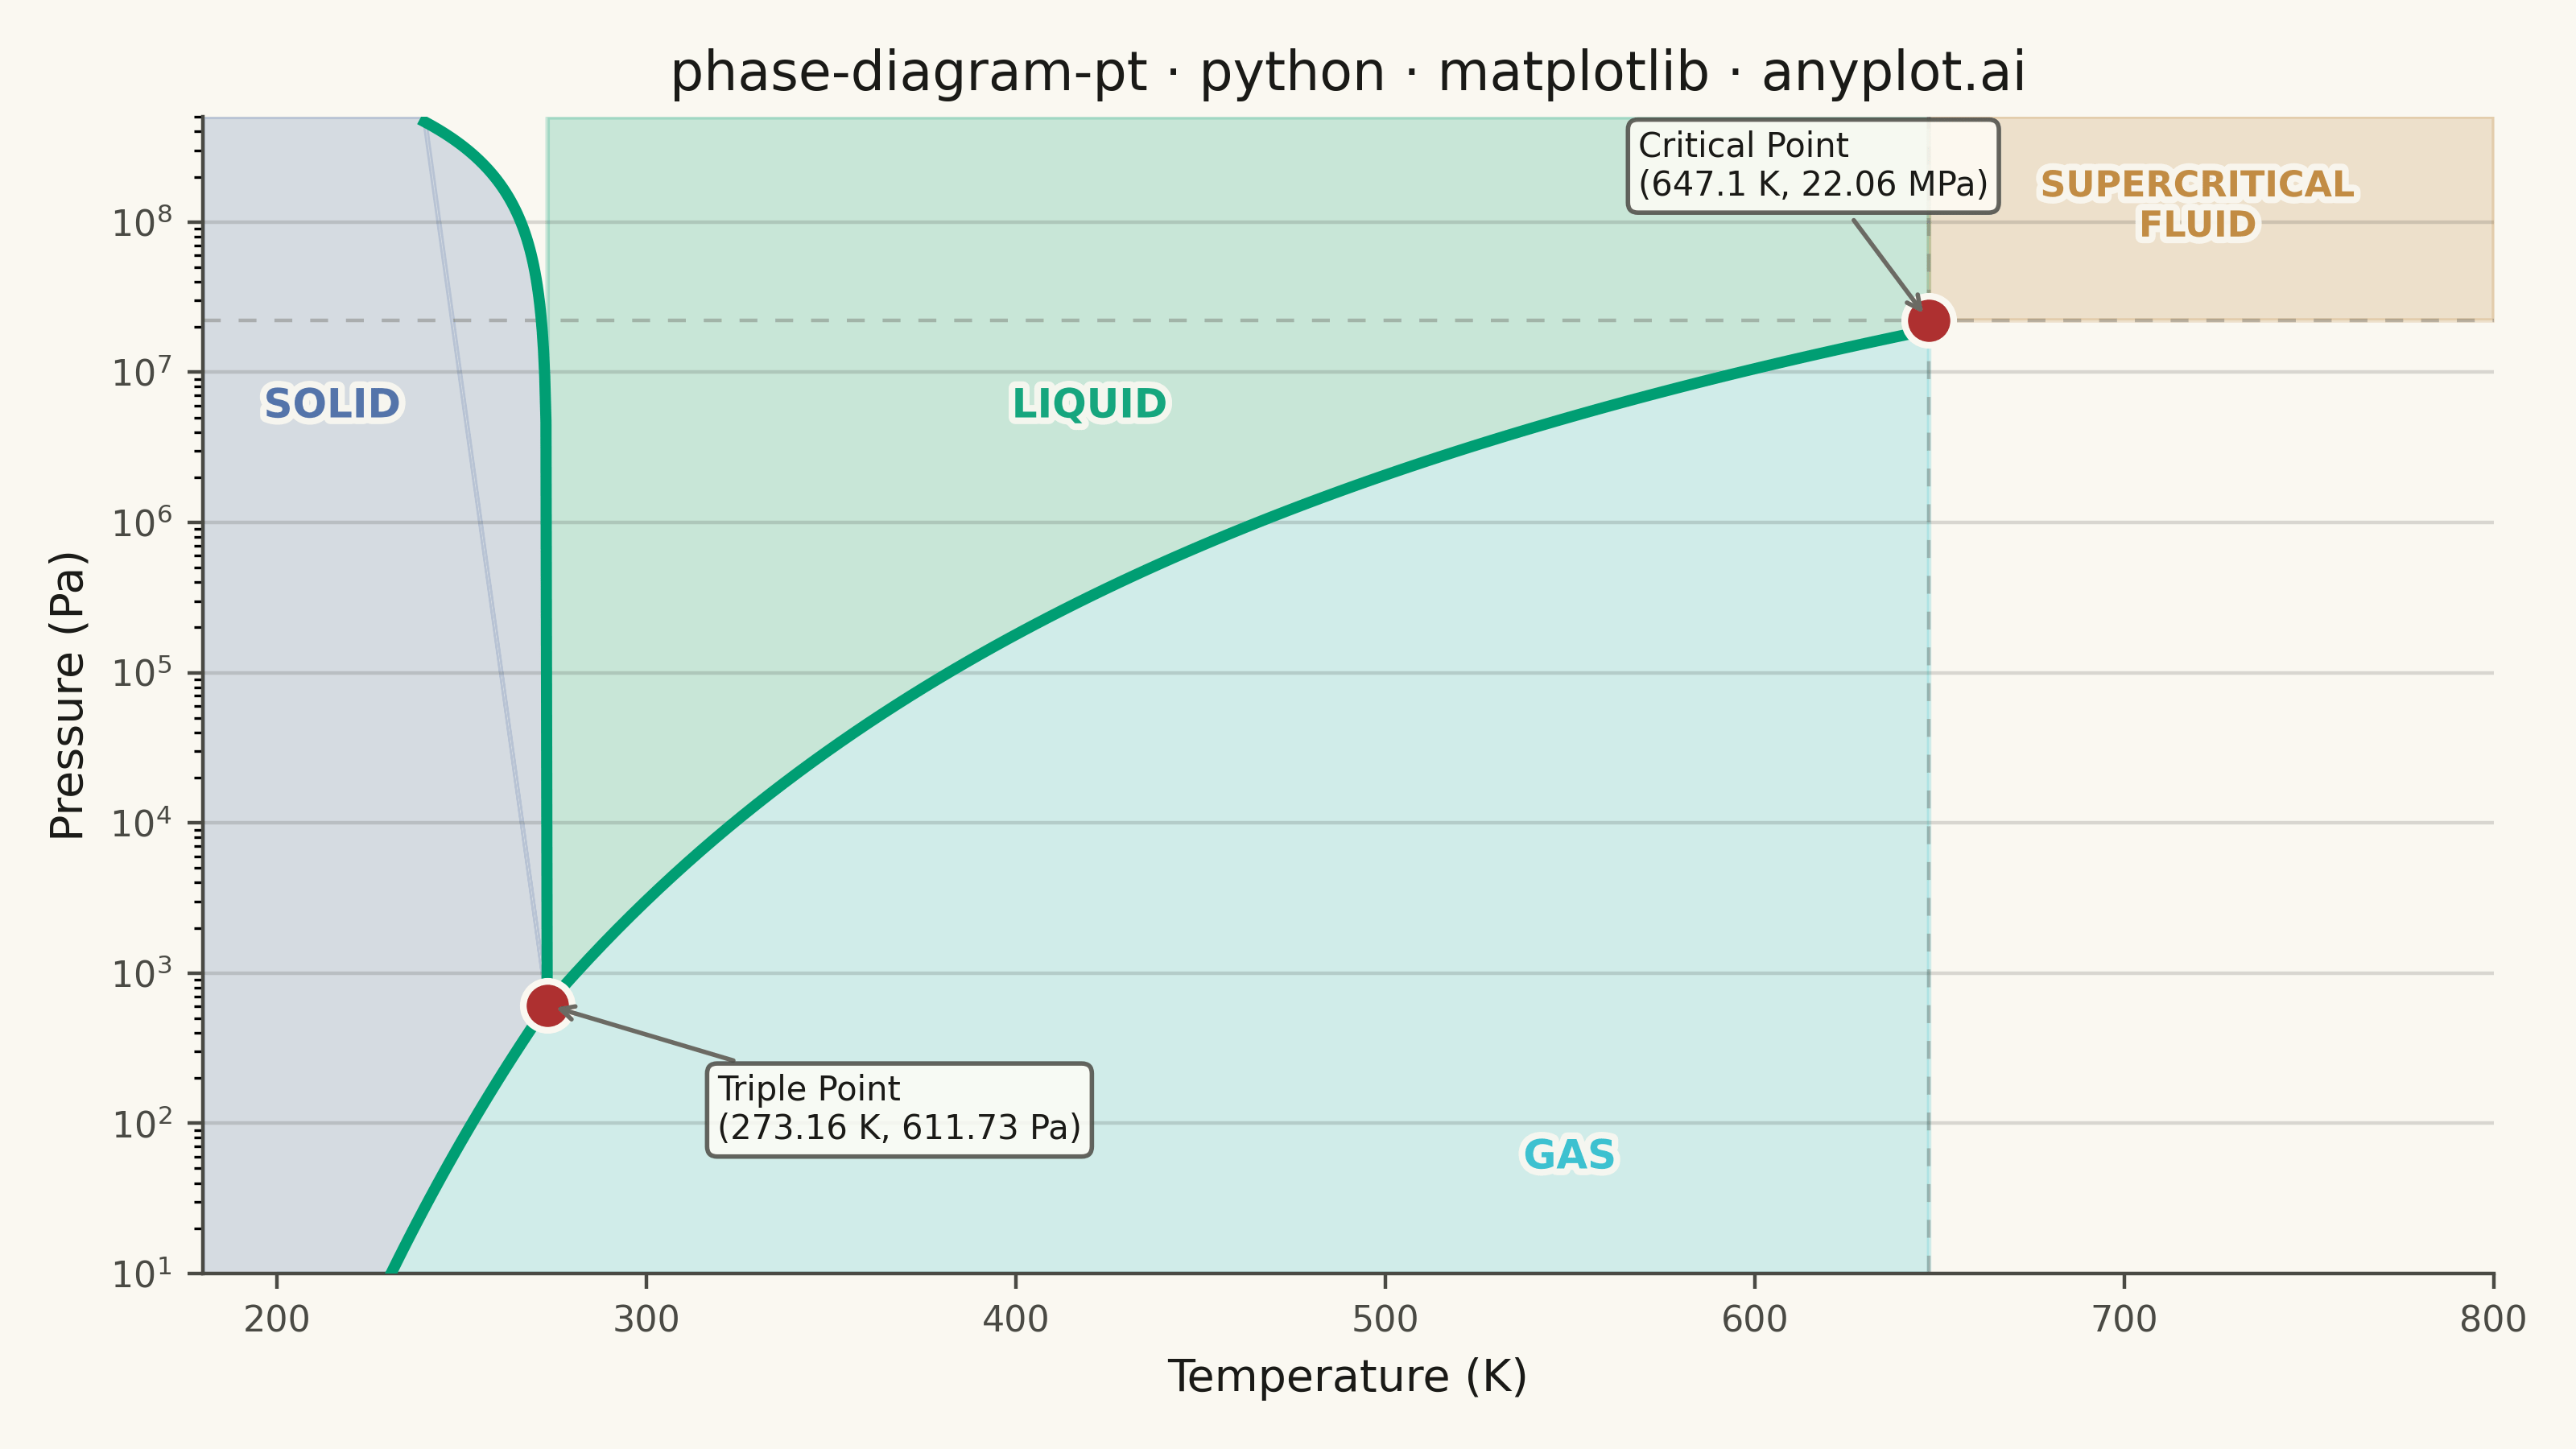
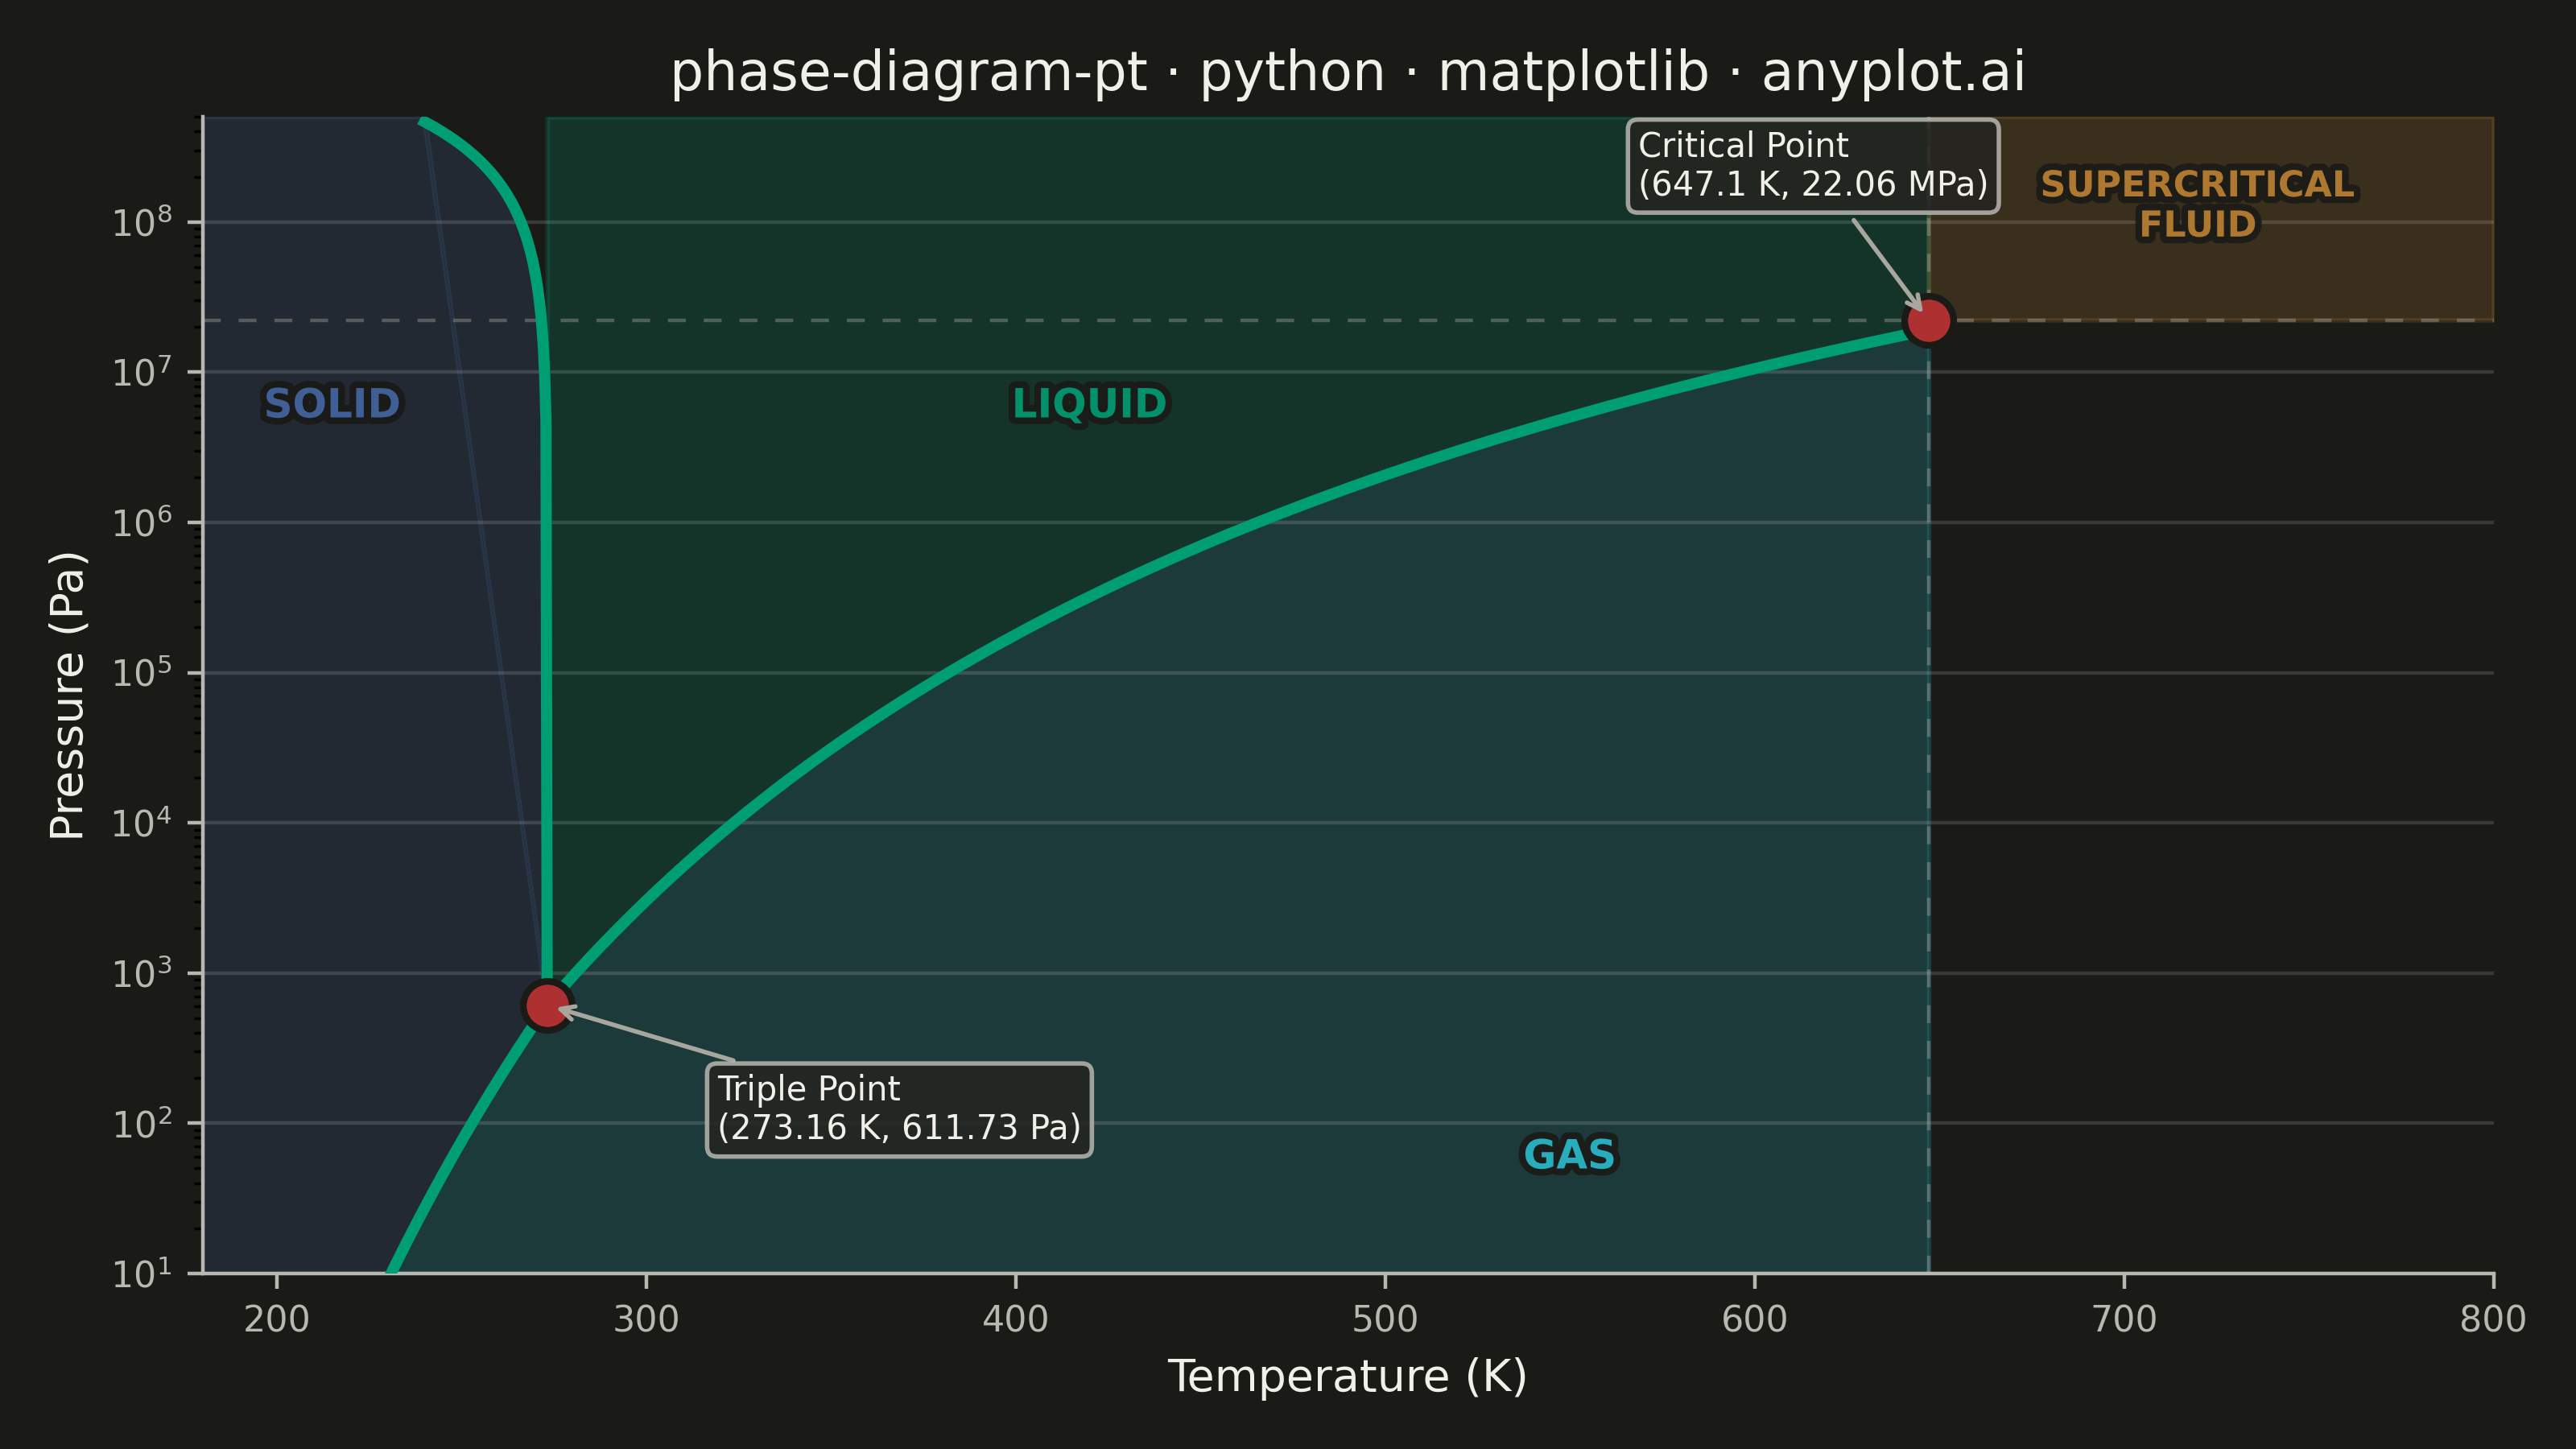
A pressure-temperature (P-T) phase diagram showing the boundaries between solid, liquid, and gas phases of a substance. The diagram includes the triple point where all three phases coexist and the critical point beyond which the liquid-gas distinction vanishes. This is one of the most fundamental diagrams in chemistry and physics, essential for understanding phase transitions and states of matter.
""" anyplot.ai
phase-diagram-pt: Thermodynamic Phase Diagram (Pressure-Temperature)
Library: matplotlib 3.10.9 | Python 3.13.13
Quality: 92/100 | Updated: 2026-06-08
"""

import os

import matplotlib.patheffects as pe
import matplotlib.pyplot as plt
import numpy as np


# Theme tokens
THEME = os.getenv("ANYPLOT_THEME", "light")
PAGE_BG = "#FAF8F1" if THEME == "light" else "#1A1A17"
ELEVATED_BG = "#FFFDF6" if THEME == "light" else "#242420"
INK = "#1A1A17" if THEME == "light" else "#F0EFE8"
INK_SOFT = "#4A4A44" if THEME == "light" else "#B8B7B0"
INK_MUTED = "#6B6A63" if THEME == "light" else "#A8A79F"

# Imprint palette — positions used by semantic role
# 1=green (boundary curves + liquid region), 3=blue (solid/ice), 4=ochre (supercritical),
# 5=red (key point markers), 6=cyan (gas/atmosphere)
IMPRINT_PALETTE = ["#009E73", "#C475FD", "#4467A3", "#BD8233", "#AE3030", "#2ABCCD", "#954477", "#99B314"]

# Data — Water phase diagram (real physical constants)
# Triple point: 273.16 K, 611.73 Pa
# Critical point: 647.1 K, 22.064 MPa
triple_T, triple_P = 273.16, 611.73
critical_T, critical_P = 647.1, 22.064e6

R = 8.314  # J/(mol·K)

# Sublimation curve: solid-gas boundary (Clausius-Clapeyron)
T_solid_gas = np.linspace(200, triple_T, 80)
L_sub = 51059  # J/mol sublimation enthalpy for water
P_solid_gas = triple_P * np.exp((L_sub / R) * (1 / triple_T - 1 / T_solid_gas))

# Vaporization curve: liquid-gas boundary (triple point → critical point)
T_liquid_gas = np.linspace(triple_T, critical_T, 100)
L_vap = 40670  # J/mol vaporization enthalpy for water
P_liquid_gas = triple_P * np.exp((L_vap / R) * (1 / triple_T - 1 / T_liquid_gas))

# Melting curve: solid-liquid boundary — water has anomalous negative slope
T_solid_liquid = np.linspace(triple_T, 240, 100)
P_solid_liquid = triple_P + (T_solid_liquid - triple_T) * (-1.4e7)

# Plot — landscape canvas: 3200 × 1800 px
fig, ax = plt.subplots(figsize=(8, 4.5), dpi=400, facecolor=PAGE_BG)
ax.set_facecolor(PAGE_BG)

ax.set_yscale("log")
x_min, x_max = 180, 800
y_min, y_max = 10, 5e8
ax.set_xlim(x_min, x_max)
ax.set_ylim(y_min, y_max)

# Phase region fills — Imprint palette at low alpha, semantic color mapping
# gas → cyan (atmosphere), liquid → green (water/life), solid → blue (ice), supercritical → ochre (heat)
gas_T = np.concatenate([T_solid_gas, T_liquid_gas])
gas_P = np.concatenate([P_solid_gas, P_liquid_gas])
ax.fill_between(gas_T, y_min, gas_P, color=IMPRINT_PALETTE[5], alpha=0.20, zorder=1)

ax.fill_between(T_liquid_gas, P_liquid_gas, y_max, color=IMPRINT_PALETTE[0], alpha=0.20, zorder=1)

solid_T = np.concatenate([[x_min], T_solid_gas, T_solid_liquid[::-1], [T_solid_liquid[-1]], [x_min]])
solid_P = np.concatenate([[P_solid_gas[0]], P_solid_gas, P_solid_liquid[::-1], [y_max], [y_max]])
ax.fill(solid_T, solid_P, color=IMPRINT_PALETTE[2], alpha=0.20, zorder=1)

ax.fill_between([critical_T, x_max], critical_P, y_max, color=IMPRINT_PALETTE[3], alpha=0.20, zorder=1)

# Dashed reference lines at the critical point
ax.axhline(critical_P, color=INK_MUTED, linewidth=0.8, linestyle=(0, (5, 5)), alpha=0.4, zorder=2)
ax.axvline(critical_T, color=INK_MUTED, linewidth=0.8, linestyle=(0, (5, 5)), alpha=0.4, zorder=2)

# Phase boundary curves — all Imprint brand green (single boundary type)
text_outline = [pe.withStroke(linewidth=3, foreground=PAGE_BG)]
curve_color = IMPRINT_PALETTE[0]  # #009E73
ax.plot(T_solid_gas, P_solid_gas, color=curve_color, linewidth=2.5, zorder=3)
ax.plot(T_liquid_gas, P_liquid_gas, color=curve_color, linewidth=2.5, zorder=3)
ax.plot(T_solid_liquid, P_solid_liquid, color=curve_color, linewidth=2.5, zorder=3)

# Special point markers — matte red (semantic: significant physical states)
pt_color = IMPRINT_PALETTE[4]  # #AE3030
ax.scatter(triple_T, triple_P, s=120, color=pt_color, edgecolors=PAGE_BG, linewidth=1.5, zorder=5)
ax.scatter(critical_T, critical_P, s=120, color=pt_color, edgecolors=PAGE_BG, linewidth=1.5, zorder=5)

# Annotations for key points
ax.annotate(
    "Triple Point\n(273.16 K, 611.73 Pa)",
    xy=(triple_T, triple_P),
    xytext=(38, -30),
    textcoords="offset points",
    fontsize=7.5,
    color=INK,
    arrowprops={"arrowstyle": "->", "color": INK_MUTED, "lw": 1.0},
    bbox={"facecolor": ELEVATED_BG, "edgecolor": INK_SOFT, "alpha": 0.85, "pad": 2, "boxstyle": "round,pad=0.3"},
    zorder=6,
)
ax.annotate(
    "Critical Point\n(647.1 K, 22.06 MPa)",
    xy=(critical_T, critical_P),
    xytext=(-65, 28),
    textcoords="offset points",
    fontsize=7.5,
    color=INK,
    arrowprops={"arrowstyle": "->", "color": INK_MUTED, "lw": 1.0},
    bbox={"facecolor": ELEVATED_BG, "edgecolor": INK_SOFT, "alpha": 0.85, "pad": 2, "boxstyle": "round,pad=0.3"},
    zorder=6,
)

# Phase region labels with path effects for readability over fills
ax.text(
    215,
    5e6,
    "SOLID",
    fontsize=9,
    fontweight="bold",
    color=IMPRINT_PALETTE[2],
    alpha=0.9,
    ha="center",
    path_effects=text_outline,
    zorder=4,
)
ax.text(
    420,
    5e6,
    "LIQUID",
    fontsize=9,
    fontweight="bold",
    color=IMPRINT_PALETTE[0],
    alpha=0.9,
    ha="center",
    path_effects=text_outline,
    zorder=4,
)
ax.text(
    550,
    50,
    "GAS",
    fontsize=9,
    fontweight="bold",
    color=IMPRINT_PALETTE[5],
    alpha=0.9,
    ha="center",
    path_effects=text_outline,
    zorder=4,
)
ax.text(
    720,
    8e7,
    "SUPERCRITICAL\nFLUID",
    fontsize=8,
    fontweight="bold",
    color=IMPRINT_PALETTE[3],
    alpha=0.9,
    ha="center",
    path_effects=text_outline,
    zorder=4,
)

# Style
title = "phase-diagram-pt · python · matplotlib · anyplot.ai"
title_fontsize = max(8, round(12 * 67 / len(title))) if len(title) > 67 else 12

ax.set_xlabel("Temperature (K)", fontsize=10, color=INK)
ax.set_ylabel("Pressure (Pa)", fontsize=10, color=INK)
ax.set_title(title, fontsize=title_fontsize, fontweight="medium", color=INK)
ax.tick_params(axis="both", labelsize=8, colors=INK_SOFT)
ax.spines["top"].set_visible(False)
ax.spines["right"].set_visible(False)
for s in ("left", "bottom"):
    ax.spines[s].set_color(INK_SOFT)
ax.yaxis.grid(True, alpha=0.15, linewidth=0.8, color=INK)

plt.tight_layout()
plt.savefig(f"plot-{THEME}.png", dpi=400, facecolor=PAGE_BG)
Runnable source as JSON, for any HTTP client: https://api.anyplot.ai/specs/phase-diagram-pt/matplotlib/code. Any spec id and library id listed in llms-full.txt fit the same URL shape; every URL below is complete and callable.
{
  "spec_id": "phase-diagram-pt",
  "language": "python",
  "library": "matplotlib",
  "page": "https://anyplot.ai/phase-diagram-pt/python/matplotlib",
  "hub": "https://anyplot.ai/phase-diagram-pt",
  "code_json": "https://api.anyplot.ai/specs/phase-diagram-pt/matplotlib/code",
  "spec_json": "https://api.anyplot.ai/specs/phase-diagram-pt",
  "render_light_png": "https://storage.googleapis.com/anyplot-images/plots/phase-diagram-pt/python/matplotlib/plot-light.png",
  "render_dark_png": "https://storage.googleapis.com/anyplot-images/plots/phase-diagram-pt/python/matplotlib/plot-dark.png",
  "quality_score": 92.0,
  "license": "MIT",
  "guide": "https://anyplot.ai/llms.txt"
}
Part of Thermodynamic Phase Diagram (Pressure-Temperature) on anyplot.ai.