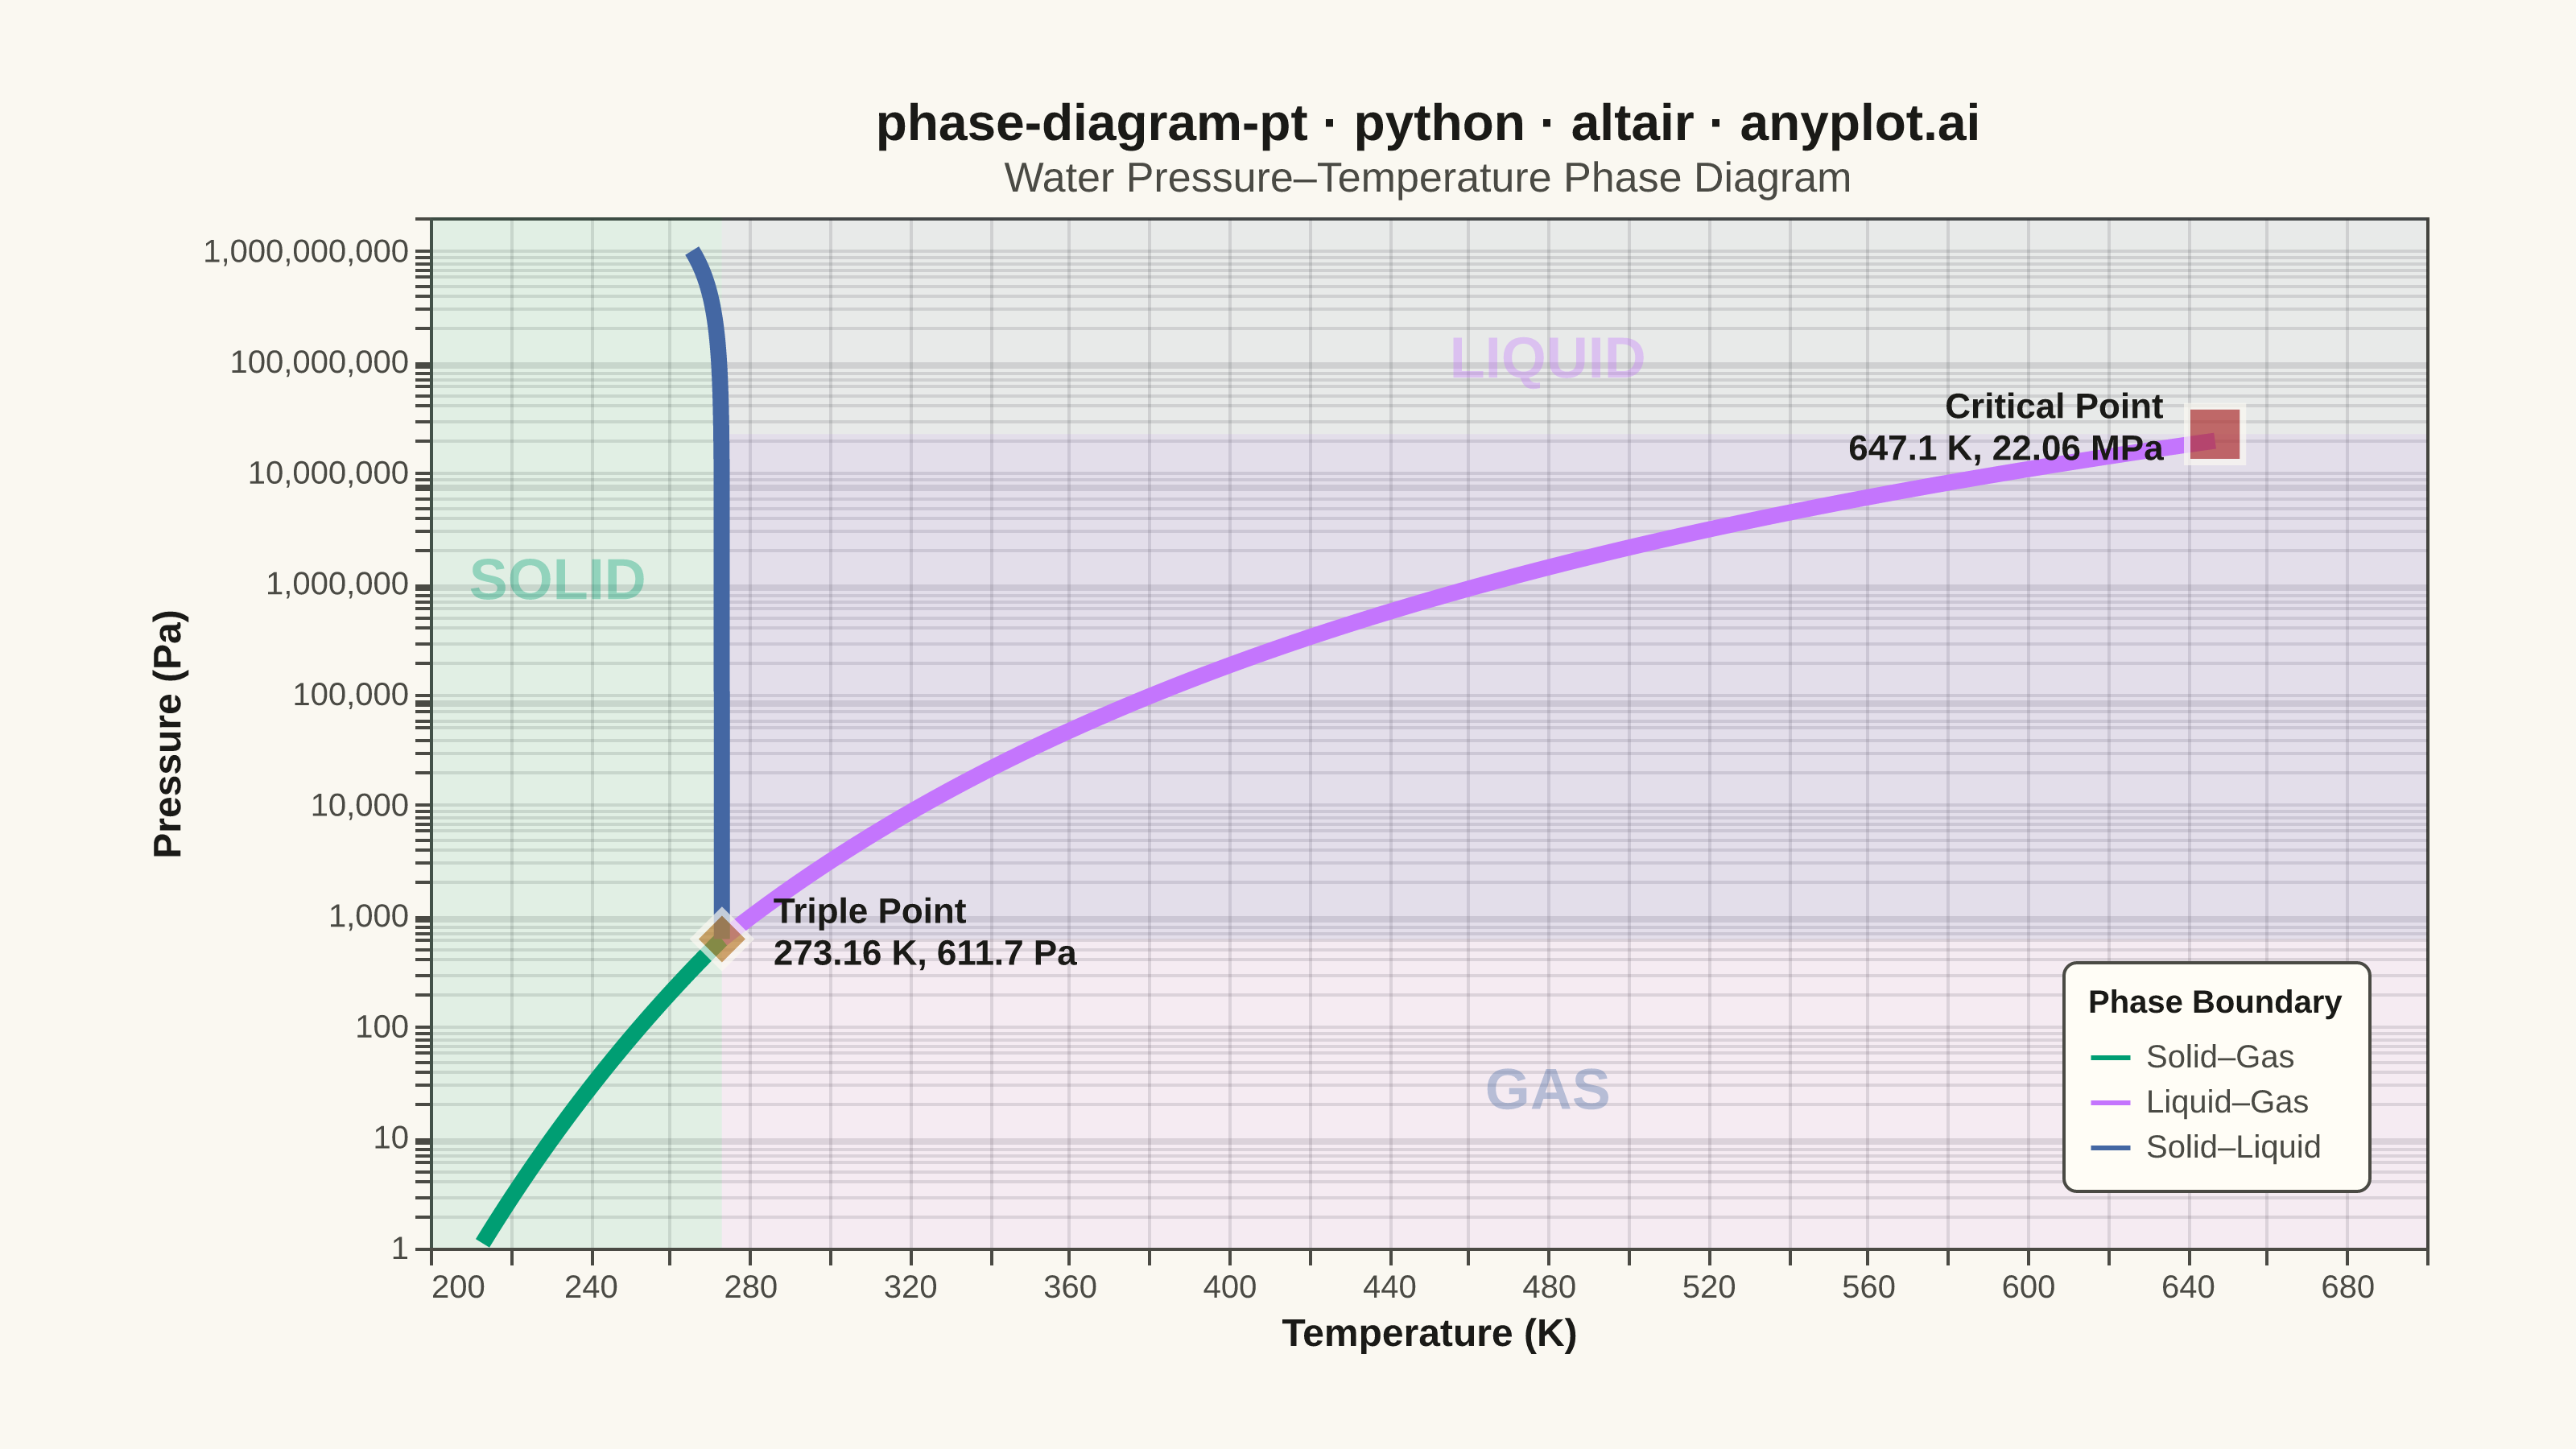
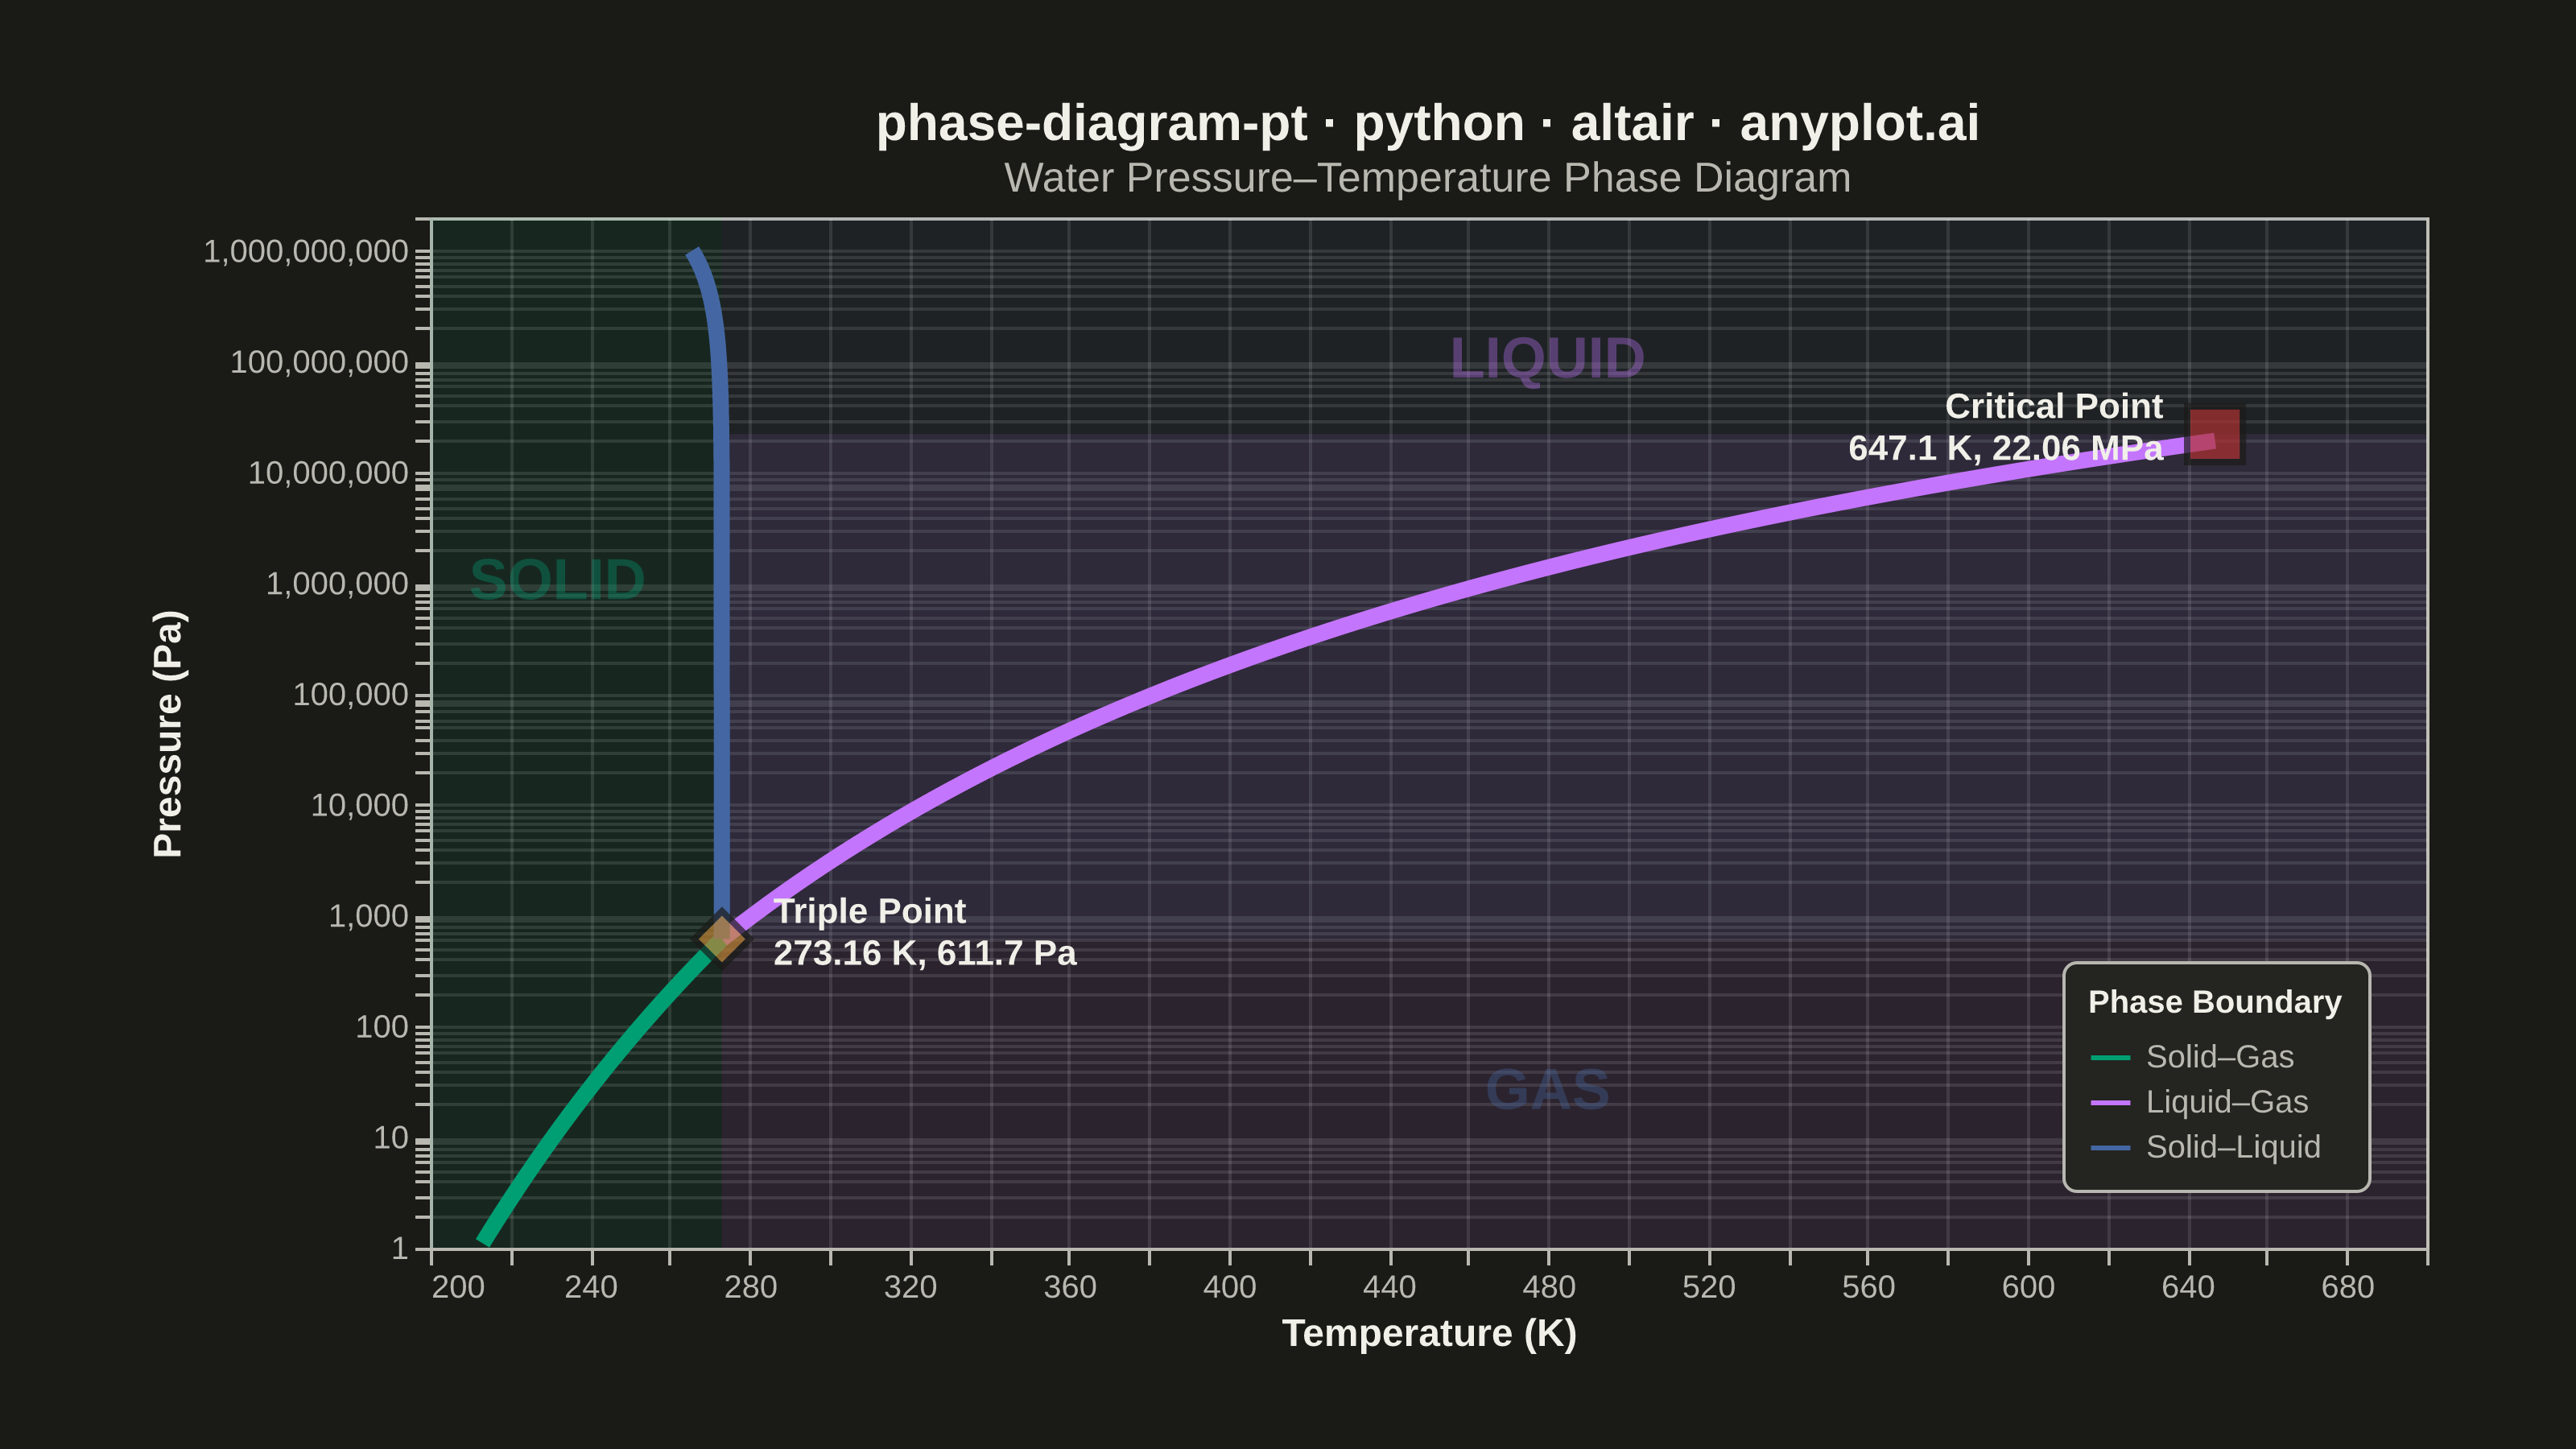
A pressure-temperature (P-T) phase diagram showing the boundaries between solid, liquid, and gas phases of a substance. The diagram includes the triple point where all three phases coexist and the critical point beyond which the liquid-gas distinction vanishes. This is one of the most fundamental diagrams in chemistry and physics, essential for understanding phase transitions and states of matter.
""" anyplot.ai
phase-diagram-pt: Thermodynamic Phase Diagram (Pressure-Temperature)
Library: altair 6.2.1 | Python 3.13.13
Quality: 88/100 | Updated: 2026-06-08
"""

import importlib
import os
import sys

import numpy as np
import pandas as pd
from PIL import Image


# Drop script directory from sys.path so `altair` resolves the package, not this file
sys.path[:] = [p for p in sys.path if os.path.abspath(p or ".") != os.path.dirname(os.path.abspath(__file__))]
alt = importlib.import_module("altair")

# Theme tokens — Imprint palette
THEME = os.getenv("ANYPLOT_THEME", "light")
PAGE_BG = "#FAF8F1" if THEME == "light" else "#1A1A17"
ELEVATED_BG = "#FFFDF6" if THEME == "light" else "#242420"
INK = "#1A1A17" if THEME == "light" else "#F0EFE8"
INK_SOFT = "#4A4A44" if THEME == "light" else "#B8B7B0"
IMPRINT = ["#009E73", "#C475FD", "#4467A3", "#BD8233", "#AE3030"]

# Data — Water phase diagram (representative thermodynamic values)
T_triple = 273.16  # K
P_triple = 611.73  # Pa
T_critical = 647.1  # K
P_critical = 2.2064e7  # Pa
L_sub = 51059  # J/mol sublimation enthalpy (ice)
L_vap = 40700  # J/mol vaporization enthalpy (water)
R = 8.314

# Solid-gas boundary (sublimation) — Clausius-Clapeyron approximation
T_sg = np.linspace(210, T_triple, 80)
P_sg = P_triple * np.exp((L_sub / R) * (1 / T_triple - 1 / T_sg))
mask_sg = P_sg >= 1
T_sg, P_sg = T_sg[mask_sg], P_sg[mask_sg]

# Liquid-gas boundary (vaporization) — triple point to critical point
T_lg = np.linspace(T_triple, T_critical, 100)
P_lg = P_triple * np.exp((L_vap / R) * (1 / T_triple - 1 / T_lg))

# Solid-liquid boundary (melting) — negative slope is water's anomaly
P_sl = np.linspace(P_triple, 1e9, 80)
T_sl = T_triple - (P_sl - P_triple) * 7.5e-9

df_sg = pd.DataFrame({"temperature": T_sg, "pressure": P_sg, "boundary": "Solid–Gas"})
df_lg = pd.DataFrame({"temperature": T_lg, "pressure": P_lg, "boundary": "Liquid–Gas"})
df_sl = pd.DataFrame({"temperature": T_sl, "pressure": P_sl, "boundary": "Solid–Liquid"})
df_boundaries = pd.concat([df_sg, df_lg, df_sl], ignore_index=True)

# Phase region shading (approximate rectangular extents)
df_regions = pd.DataFrame(
    {
        "t1": [200, T_triple, T_triple],
        "t2": [T_triple, 700, 700],
        "p1": [1, 1, P_triple],
        "p2": [2e9, P_critical, 2e9],
        "phase": ["Solid", "Gas", "Liquid"],
    }
)

# Triple and critical points
df_points = pd.DataFrame(
    {
        "temperature": [T_triple, T_critical],
        "pressure": [P_triple, P_critical],
        "label": ["Triple Point\n273.16 K, 611.7 Pa", "Critical Point\n647.1 K, 22.06 MPa"],
        "point_type": ["Triple Point", "Critical Point"],
    }
)

# Phase region text labels
df_labels = pd.DataFrame(
    {"temperature": [232, 480, 480], "pressure": [1e6, 1e8, 25], "phase": ["SOLID", "LIQUID", "GAS"]}
)

# Shared axis scales and encodings
x_scale = alt.Scale(domain=[200, 700])
y_scale = alt.Scale(type="log", domain=[1, 2e9])
x_enc = alt.X("temperature:Q", title="Temperature (K)", scale=x_scale)
y_enc = alt.Y("pressure:Q", title="Pressure (Pa)", scale=y_scale)

# Imprint palette positions 1–3 for the three phase boundaries
boundary_scale = alt.Scale(
    domain=["Solid–Gas", "Liquid–Gas", "Solid–Liquid"], range=[IMPRINT[0], IMPRINT[1], IMPRINT[2]]
)

hover = alt.selection_point(fields=["boundary"], on="pointerover", empty="all")

# Phase region fills (same Imprint colors at low opacity for coherence)
regions = (
    alt.Chart(df_regions)
    .mark_rect(opacity=0.10)
    .encode(
        x=alt.X("t1:Q", scale=x_scale),
        x2="t2:Q",
        y=alt.Y("p1:Q", scale=y_scale),
        y2="p2:Q",
        color=alt.Color(
            "phase:N",
            scale=alt.Scale(domain=["Solid", "Gas", "Liquid"], range=[IMPRINT[0], IMPRINT[1], IMPRINT[2]]),
            legend=None,
        ),
    )
)

# Phase region text (large bold labels at low opacity)
phase_text = (
    alt.Chart(df_labels)
    .mark_text(fontSize=18, fontWeight="bold", opacity=0.35)
    .encode(
        x=alt.X("temperature:Q", scale=x_scale),
        y=alt.Y("pressure:Q", scale=y_scale),
        text="phase:N",
        color=alt.Color(
            "phase:N",
            scale=alt.Scale(domain=["SOLID", "LIQUID", "GAS"], range=[IMPRINT[0], IMPRINT[1], IMPRINT[2]]),
            legend=None,
        ),
    )
)

# Phase boundary lines with hover highlight
lines = (
    alt.Chart(df_boundaries)
    .mark_line()
    .encode(
        x=x_enc,
        y=y_enc,
        color=alt.Color("boundary:N", scale=boundary_scale, legend=alt.Legend(title="Phase Boundary")),
        opacity=alt.condition(hover, alt.value(1.0), alt.value(0.5)),
        strokeWidth=alt.condition(hover, alt.value(5.0), alt.value(3.5)),
        tooltip=[
            alt.Tooltip("temperature:Q", title="Temperature (K)", format=".1f"),
            alt.Tooltip("pressure:Q", title="Pressure (Pa)", format=".2e"),
            alt.Tooltip("boundary:N", title="Boundary"),
        ],
    )
    .add_params(hover)
)

# Triple and critical points — distinct shapes, Imprint positions 4–5
points = (
    alt.Chart(df_points)
    .mark_point(size=300, filled=True, stroke=PAGE_BG, strokeWidth=2)
    .encode(
        x=x_enc,
        y=y_enc,
        shape=alt.Shape(
            "point_type:N",
            scale=alt.Scale(domain=["Triple Point", "Critical Point"], range=["diamond", "square"]),
            legend=None,
        ),
        color=alt.Color(
            "point_type:N",
            scale=alt.Scale(domain=["Triple Point", "Critical Point"], range=[IMPRINT[3], IMPRINT[4]]),
            legend=None,
        ),
        tooltip=[alt.Tooltip("label:N", title="Point")],
    )
)

df_tp = df_points[df_points["point_type"] == "Triple Point"]
df_cp = df_points[df_points["point_type"] == "Critical Point"]

tp_label = (
    alt.Chart(df_tp)
    .mark_text(fontSize=11, fontWeight="bold", align="left", dx=16, dy=-8, lineBreak="\n")
    .encode(x=x_enc, y=y_enc, text="label:N", color=alt.value(INK))
)

cp_label = (
    alt.Chart(df_cp)
    .mark_text(fontSize=11, fontWeight="bold", align="right", dx=-16, dy=-8, lineBreak="\n")
    .encode(x=x_enc, y=y_enc, text="label:N", color=alt.value(INK))
)

# Title — len("phase-diagram-pt · python · altair · anyplot.ai") = 47 < 67, use default 16px
title_str = "phase-diagram-pt · python · altair · anyplot.ai"

chart = (
    alt.layer(regions, phase_text, lines, points, tp_label, cp_label)
    .resolve_scale(color="independent", shape="independent")
    .properties(
        width=620,
        height=320,
        background=PAGE_BG,
        title=alt.Title(
            title_str,
            fontSize=16,
            fontWeight="bold",
            color=INK,
            subtitle="Water Pressure–Temperature Phase Diagram",
            subtitleFontSize=13,
            subtitleColor=INK_SOFT,
        ),
    )
    .configure_view(fill=PAGE_BG, stroke=INK_SOFT)
    .configure_axis(
        labelFontSize=10,
        titleFontSize=12,
        gridOpacity=0.12,
        domainColor=INK_SOFT,
        tickColor=INK_SOFT,
        labelColor=INK_SOFT,
        titleColor=INK,
        gridColor=INK,
    )
    .configure_legend(
        titleFontSize=10,
        labelFontSize=10,
        symbolSize=150,
        titleLimit=300,
        labelLimit=300,
        orient="bottom-right",
        padding=8,
        cornerRadius=4,
        fillColor=ELEVATED_BG,
        strokeColor=INK_SOFT,
        labelColor=INK_SOFT,
        titleColor=INK,
    )
)

# Save PNG and pad to exact 3200×1800 canvas with PAGE_BG fill
chart.save(f"plot-{THEME}.png", scale_factor=4.0)

TW, TH = 3200, 1800
_img = Image.open(f"plot-{THEME}.png").convert("RGB")
_w, _h = _img.size
if _w > TW or _h > TH:
    raise SystemExit(
        f"altair vl-convert produced {_w}×{_h}, exceeds target {TW}×{TH}. "
        f"Shrink chart .properties(width=, height=) values and re-render."
    )
if _w < TW or _h < TH:
    _canvas = Image.new("RGB", (TW, TH), PAGE_BG)
    _canvas.paste(_img, ((TW - _w) // 2, (TH - _h) // 2))
    _canvas.save(f"plot-{THEME}.png")

# Save interactive HTML
chart.interactive().save(f"plot-{THEME}.html")
Runnable source as JSON, for any HTTP client: https://api.anyplot.ai/specs/phase-diagram-pt/altair/code. Any spec id and library id listed in llms-full.txt fit the same URL shape; every URL below is complete and callable.
{
  "spec_id": "phase-diagram-pt",
  "language": "python",
  "library": "altair",
  "page": "https://anyplot.ai/phase-diagram-pt/python/altair",
  "hub": "https://anyplot.ai/phase-diagram-pt",
  "code_json": "https://api.anyplot.ai/specs/phase-diagram-pt/altair/code",
  "spec_json": "https://api.anyplot.ai/specs/phase-diagram-pt",
  "render_light_png": "https://storage.googleapis.com/anyplot-images/plots/phase-diagram-pt/python/altair/plot-light.png",
  "render_dark_png": "https://storage.googleapis.com/anyplot-images/plots/phase-diagram-pt/python/altair/plot-dark.png",
  "interactive_light_html": "https://storage.googleapis.com/anyplot-images/plots/phase-diagram-pt/python/altair/plot-light.html",
  "interactive_dark_html": "https://storage.googleapis.com/anyplot-images/plots/phase-diagram-pt/python/altair/plot-dark.html",
  "quality_score": 88.0,
  "license": "MIT",
  "guide": "https://anyplot.ai/llms.txt"
}
Part of Thermodynamic Phase Diagram (Pressure-Temperature) on anyplot.ai.