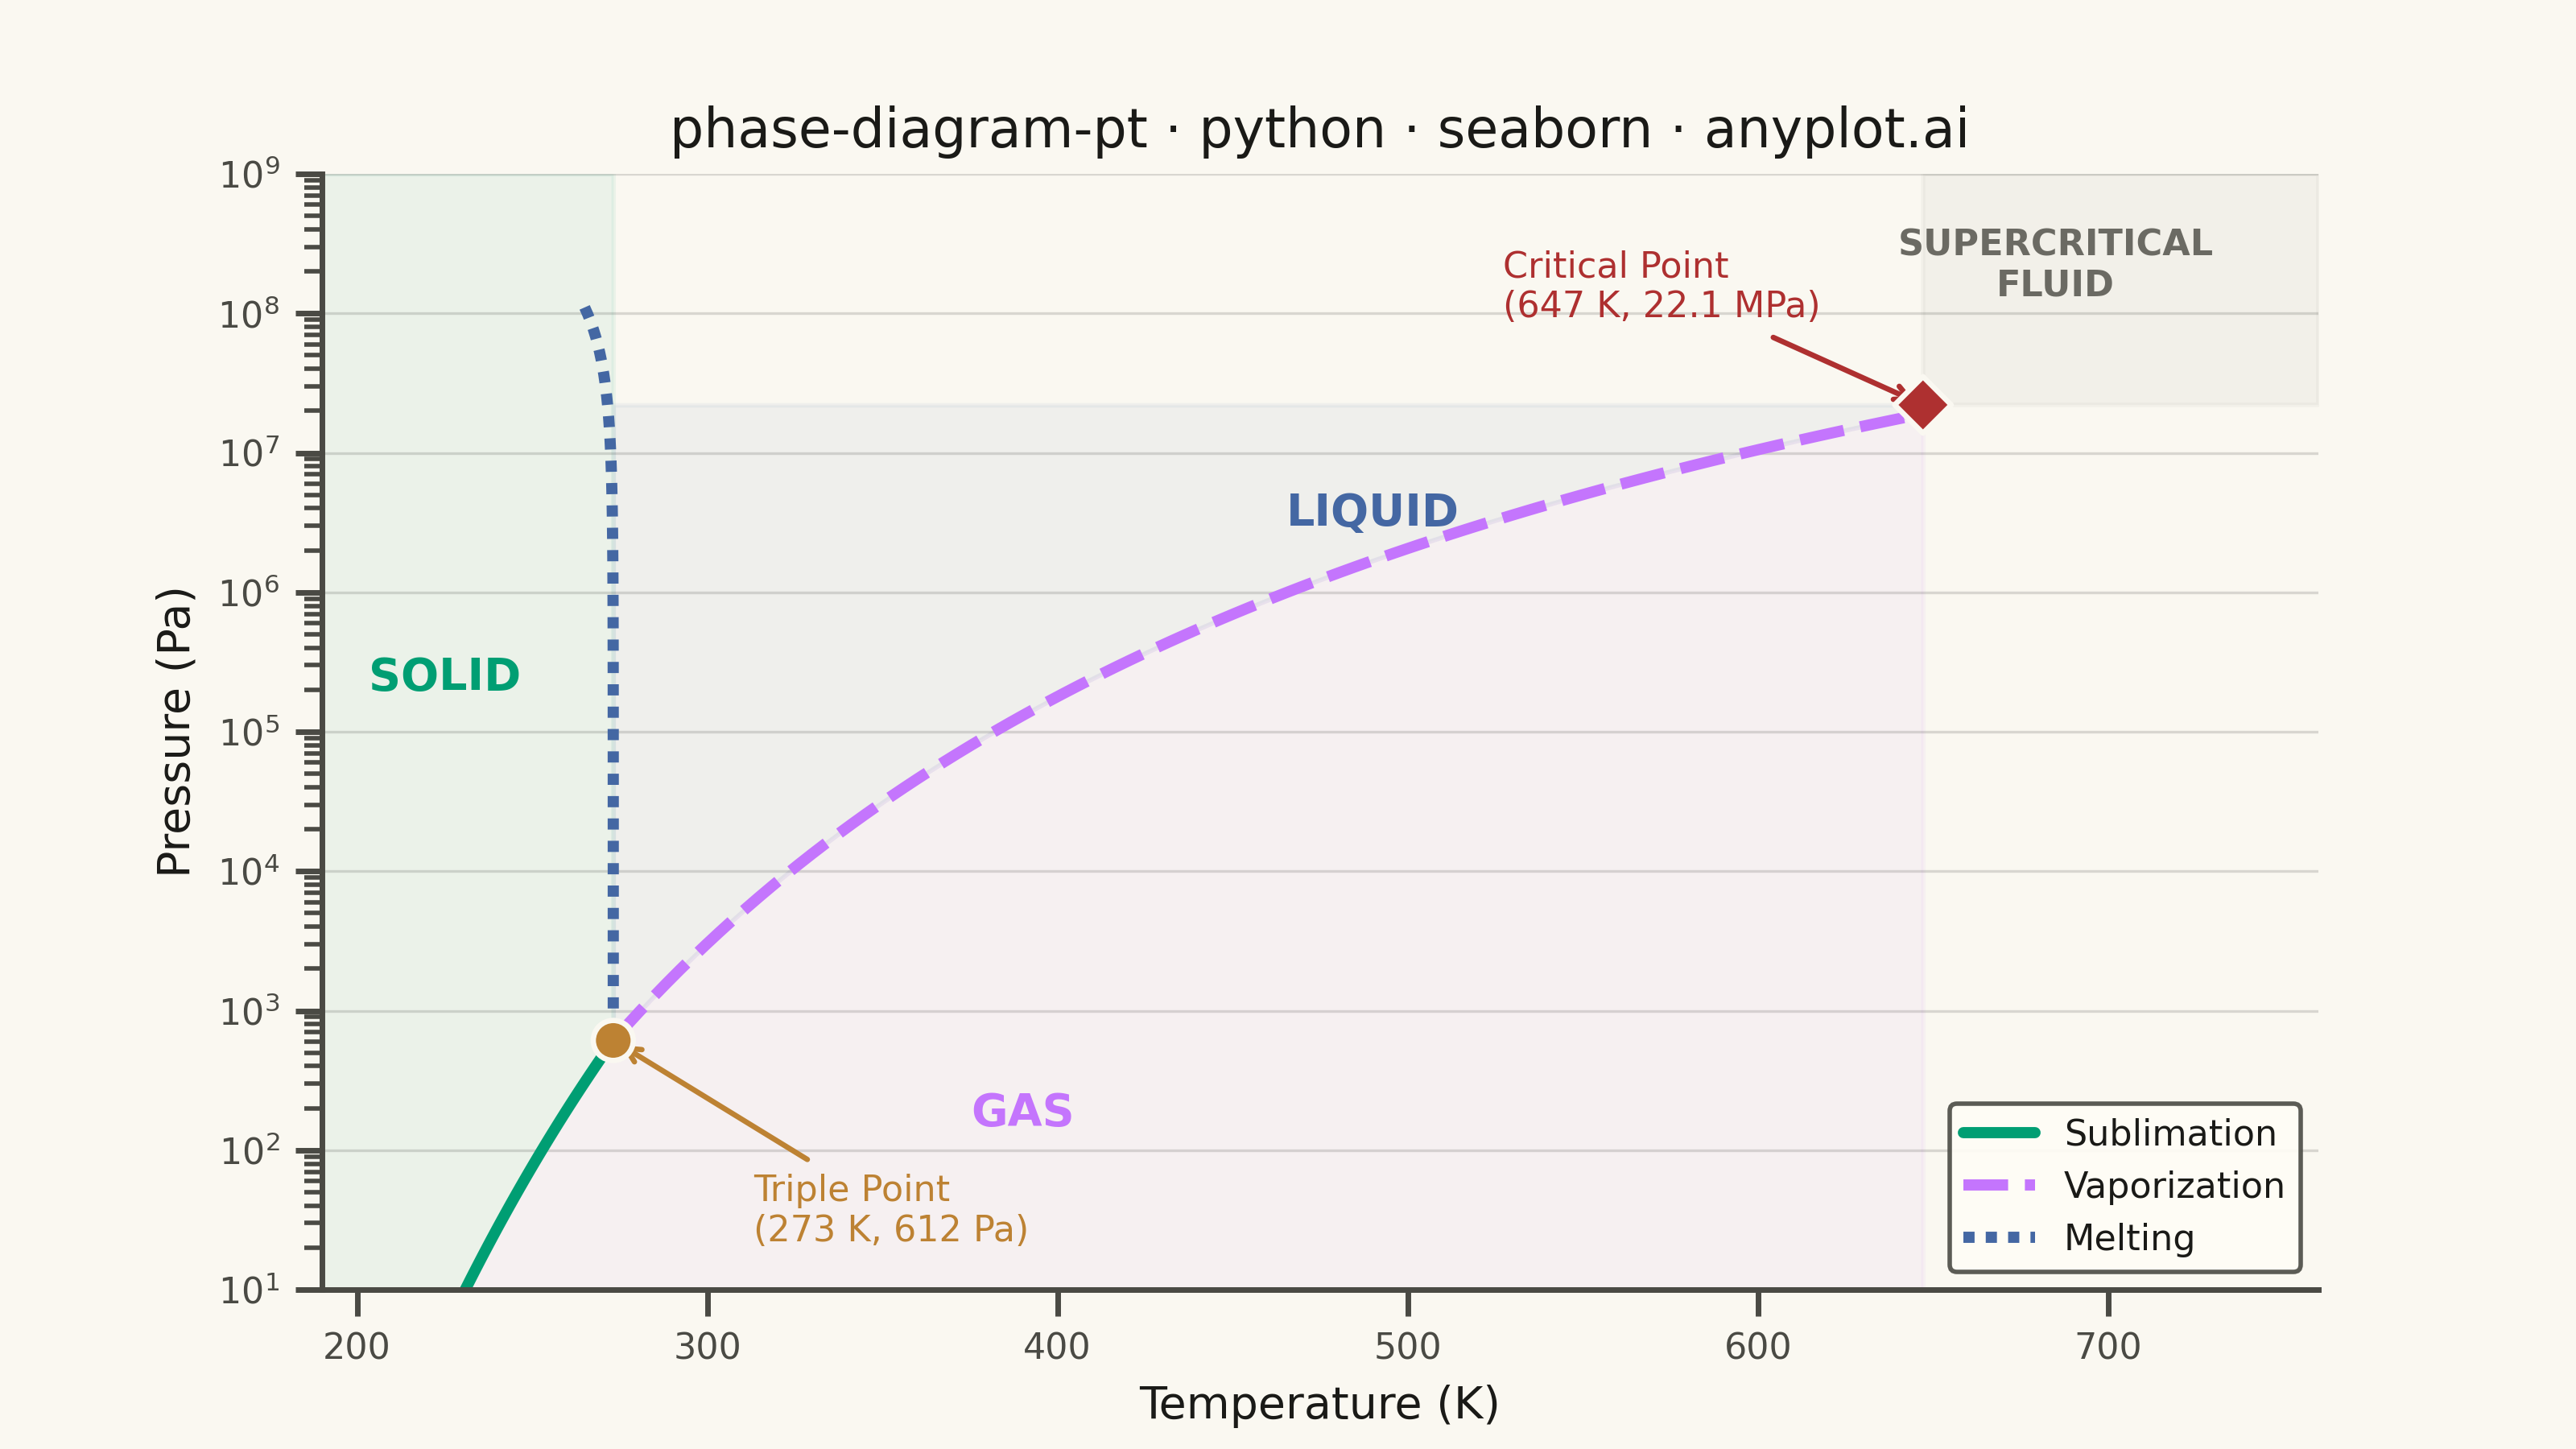
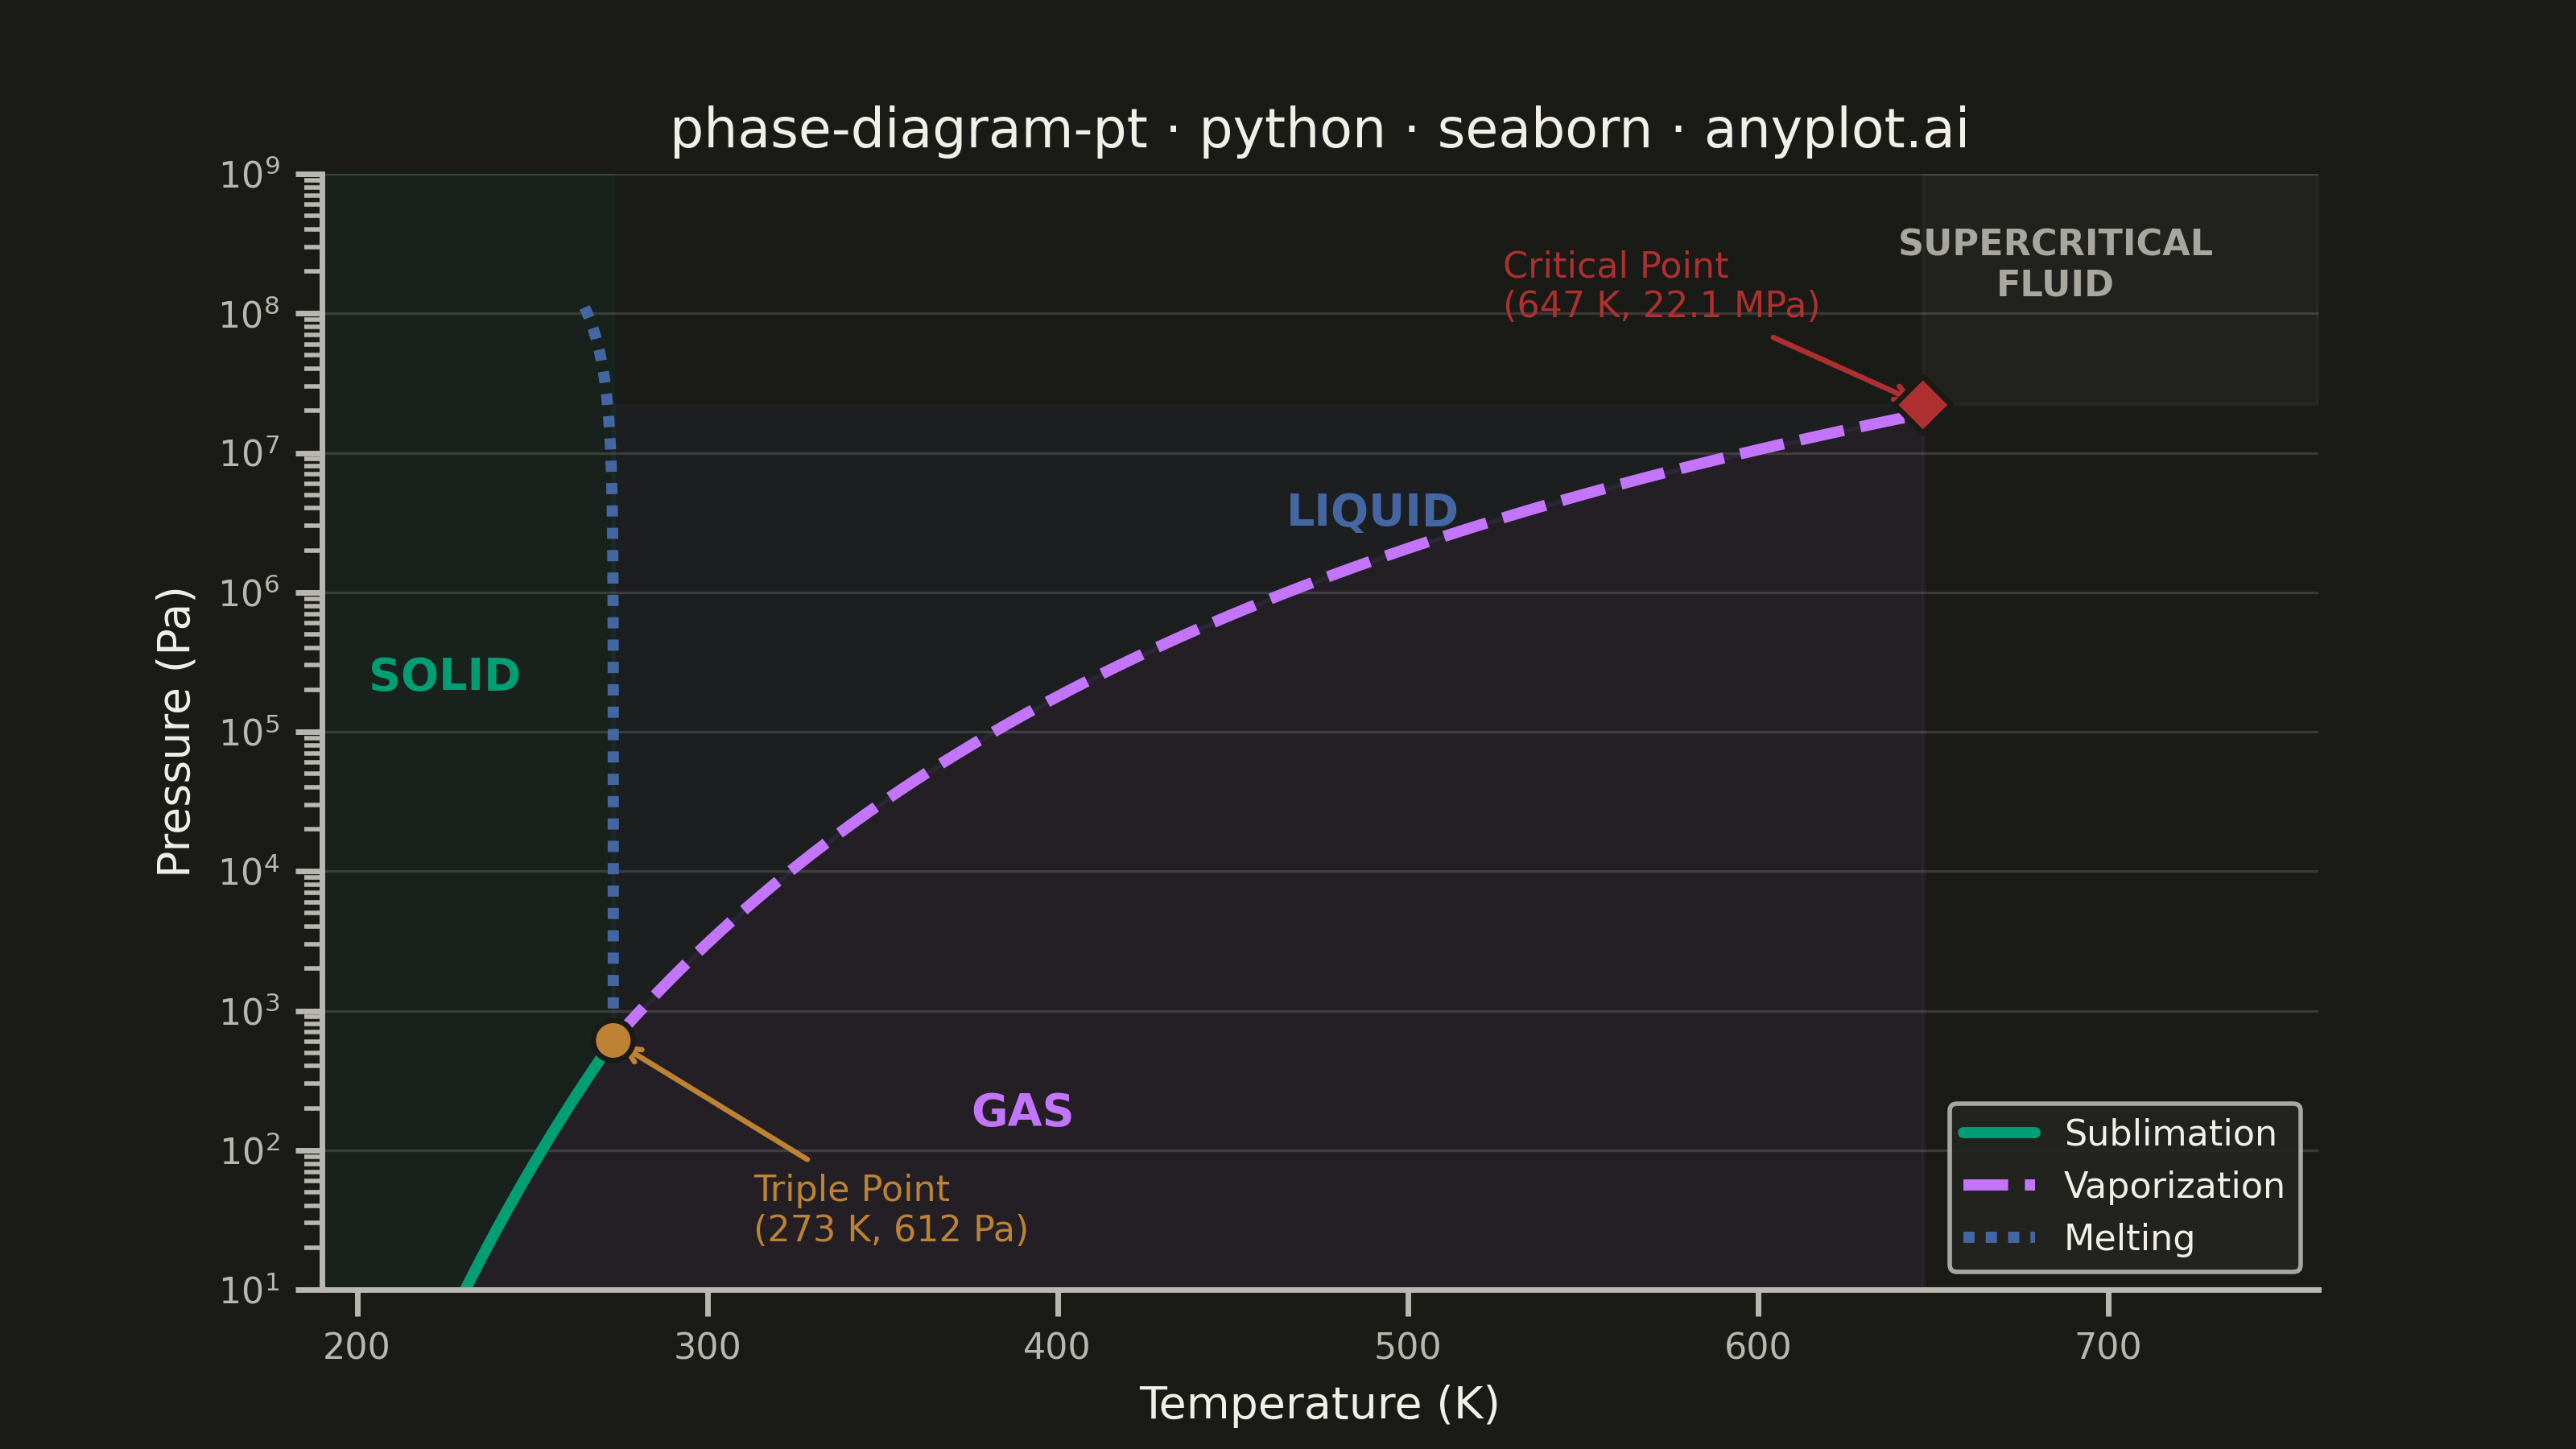
A pressure-temperature (P-T) phase diagram showing the boundaries between solid, liquid, and gas phases of a substance. The diagram includes the triple point where all three phases coexist and the critical point beyond which the liquid-gas distinction vanishes. This is one of the most fundamental diagrams in chemistry and physics, essential for understanding phase transitions and states of matter.
""" anyplot.ai
phase-diagram-pt: Thermodynamic Phase Diagram (Pressure-Temperature)
Library: seaborn 0.13.2 | Python 3.13.13
Quality: 90/100 | Updated: 2026-06-08
"""

import os

import matplotlib.pyplot as plt
import numpy as np
import pandas as pd
import seaborn as sns


# Theme tokens — Imprint palette, theme-adaptive chrome
THEME = os.getenv("ANYPLOT_THEME", "light")
PAGE_BG = "#FAF8F1" if THEME == "light" else "#1A1A17"
ELEVATED_BG = "#FFFDF6" if THEME == "light" else "#242420"
INK = "#1A1A17" if THEME == "light" else "#F0EFE8"
INK_SOFT = "#4A4A44" if THEME == "light" else "#B8B7B0"
INK_MUTED = "#6B6A63" if THEME == "light" else "#A8A79F"

# Imprint palette positions 1–3 for three phase boundaries
IMPRINT_PALETTE = ["#009E73", "#C475FD", "#4467A3"]

sns.set_theme(
    context="notebook",
    style="ticks",
    rc={
        "figure.facecolor": PAGE_BG,
        "axes.facecolor": PAGE_BG,
        "axes.edgecolor": INK_SOFT,
        "axes.labelcolor": INK,
        "text.color": INK,
        "xtick.color": INK_SOFT,
        "ytick.color": INK_SOFT,
        "legend.facecolor": ELEVATED_BG,
        "legend.edgecolor": INK_SOFT,
    },
)

# Data — water phase diagram, Clausius-Clapeyron approximation
# Triple point: 273.16 K / 611.73 Pa; critical point: 647.1 K / 22.064 MPa
triple_T, triple_P = 273.16, 611.73
critical_T, critical_P = 647.1, 22_064_000.0
R = 8.314

T_sub = np.linspace(200, triple_T, 100)
P_sub = triple_P * np.exp((51059.0 / R) * (1 / triple_T - 1 / T_sub))

T_vap = np.linspace(triple_T, critical_T, 100)
P_vap = triple_P * np.exp((40660.0 / R) * (1 / triple_T - 1 / T_vap))

# Water melting curve — anomalous negative slope (increasing pressure lowers melting point)
P_melt = np.logspace(np.log10(triple_P), np.log10(critical_P * 5), 100)
T_melt = triple_T + (-7.4e-8) * (P_melt - triple_P)

df = pd.concat(
    [
        pd.DataFrame({"Temperature (K)": T_sub, "Pressure (Pa)": P_sub, "Boundary": "Sublimation"}),
        pd.DataFrame({"Temperature (K)": T_vap, "Pressure (Pa)": P_vap, "Boundary": "Vaporization"}),
        pd.DataFrame({"Temperature (K)": T_melt, "Pressure (Pa)": P_melt, "Boundary": "Melting"}),
    ],
    ignore_index=True,
)

# Plot
fig, ax = plt.subplots(figsize=(8, 4.5), dpi=400, facecolor=PAGE_BG)
ax.set_facecolor(PAGE_BG)

sns.lineplot(
    data=df,
    x="Temperature (K)",
    y="Pressure (Pa)",
    hue="Boundary",
    style="Boundary",
    palette=IMPRINT_PALETTE,
    linewidth=2.5,
    ax=ax,
)

# Subtle phase-region fills to visually separate regions
T_solid_ext = np.concatenate([[190], T_sub])
P_solid_ext = np.concatenate([[P_sub[0]], P_sub])
ax.fill_between(T_solid_ext, P_solid_ext, 1e9, color=IMPRINT_PALETTE[0], alpha=0.06, zorder=0)
gas_T = np.concatenate([T_sub, T_vap[1:]])
gas_P = np.concatenate([P_sub, P_vap[1:]])
ax.fill_between(gas_T, 1e1, gas_P, color=IMPRINT_PALETTE[1], alpha=0.06, zorder=0)
ax.fill_between(T_vap, P_vap, critical_P, color=IMPRINT_PALETTE[2], alpha=0.06, zorder=0)
ax.fill_between([critical_T, 760], critical_P, 1e9, color=INK_MUTED, alpha=0.05, zorder=0)

# Mark triple point (ochre) and critical point (matte red) — seaborn scatter for LM-02
special_df = pd.DataFrame(
    {
        "Temperature (K)": [triple_T, critical_T],
        "Pressure (Pa)": [triple_P, critical_P],
        "Marker": ["Triple Point", "Critical Point"],
    }
)
sns.scatterplot(
    data=special_df,
    x="Temperature (K)",
    y="Pressure (Pa)",
    hue="Marker",
    style="Marker",
    palette={"Triple Point": "#BD8233", "Critical Point": "#AE3030"},
    markers={"Triple Point": "o", "Critical Point": "D"},
    s=80,
    zorder=5,
    ax=ax,
    legend=False,
    edgecolors=PAGE_BG,
    linewidths=1.2,
)

ax.annotate(
    "Triple Point\n(273 K, 612 Pa)",
    xy=(triple_T, triple_P),
    xytext=(triple_T + 40, triple_P * 0.06),
    fontsize=8,
    color="#BD8233",
    arrowprops={"arrowstyle": "->", "color": "#BD8233", "lw": 1.2},
    va="center",
)
ax.annotate(
    "Critical Point\n(647 K, 22.1 MPa)",
    xy=(critical_T, critical_P),
    xytext=(critical_T - 120, critical_P * 7),
    fontsize=8,
    color="#AE3030",
    arrowprops={"arrowstyle": "->", "color": "#AE3030", "lw": 1.2},
    va="center",
)

# Phase region labels — color-coordinated with boundary curves
ax.text(225, 2e5, "SOLID", fontsize=10, fontweight="bold", color=IMPRINT_PALETTE[0], ha="center")
ax.text(390, 1.5e2, "GAS", fontsize=10, fontweight="bold", color=IMPRINT_PALETTE[1], ha="center")
ax.text(490, 3e6, "LIQUID", fontsize=10, fontweight="bold", color=IMPRINT_PALETTE[2], ha="center")
ax.text(
    685,
    critical_P * 10,
    "SUPERCRITICAL\nFLUID",
    fontsize=8,
    fontweight="bold",
    color=INK_MUTED,
    ha="center",
    va="center",
)

# Axes
ax.set_yscale("log")
ax.set_xlim(190, 760)
ax.set_ylim(1e1, 1e9)
ax.set_xlabel("Temperature (K)", fontsize=10, color=INK)
ax.set_ylabel("Pressure (Pa)", fontsize=10, color=INK)

title = "phase-diagram-pt · python · seaborn · anyplot.ai"
ax.set_title(title, fontsize=12, fontweight="medium", color=INK)
ax.tick_params(axis="both", labelsize=8, colors=INK_SOFT)

sns.despine(ax=ax)
ax.yaxis.grid(True, color=INK, alpha=0.15, linewidth=0.6)
ax.legend(fontsize=8, loc="lower right", framealpha=0.9, facecolor=ELEVATED_BG, edgecolor=INK_SOFT)

# Save
plt.savefig(f"plot-{THEME}.png", dpi=400, facecolor=PAGE_BG)
Runnable source as JSON, for any HTTP client: https://api.anyplot.ai/specs/phase-diagram-pt/seaborn/code. Any spec id and library id listed in llms-full.txt fit the same URL shape; every URL below is complete and callable.
{
  "spec_id": "phase-diagram-pt",
  "language": "python",
  "library": "seaborn",
  "page": "https://anyplot.ai/phase-diagram-pt/python/seaborn",
  "hub": "https://anyplot.ai/phase-diagram-pt",
  "code_json": "https://api.anyplot.ai/specs/phase-diagram-pt/seaborn/code",
  "spec_json": "https://api.anyplot.ai/specs/phase-diagram-pt",
  "render_light_png": "https://storage.googleapis.com/anyplot-images/plots/phase-diagram-pt/python/seaborn/plot-light.png",
  "render_dark_png": "https://storage.googleapis.com/anyplot-images/plots/phase-diagram-pt/python/seaborn/plot-dark.png",
  "quality_score": 90.0,
  "license": "MIT",
  "guide": "https://anyplot.ai/llms.txt"
}
Part of Thermodynamic Phase Diagram (Pressure-Temperature) on anyplot.ai.