The same plot in 14 other libraries — JavaScript: Chart.js, D3.js, Apache ECharts, MUI X Charts; Python: Altair, Bokeh, lets-plot, Matplotlib, Plotly, plotnine, Pygal, Seaborn; R: ggplot2; Julia: Makie.jl. Compare all 15 side by side: Thermodynamic Phase Diagram (Pressure-Temperature) in Python, R, Julia and JavaScript.
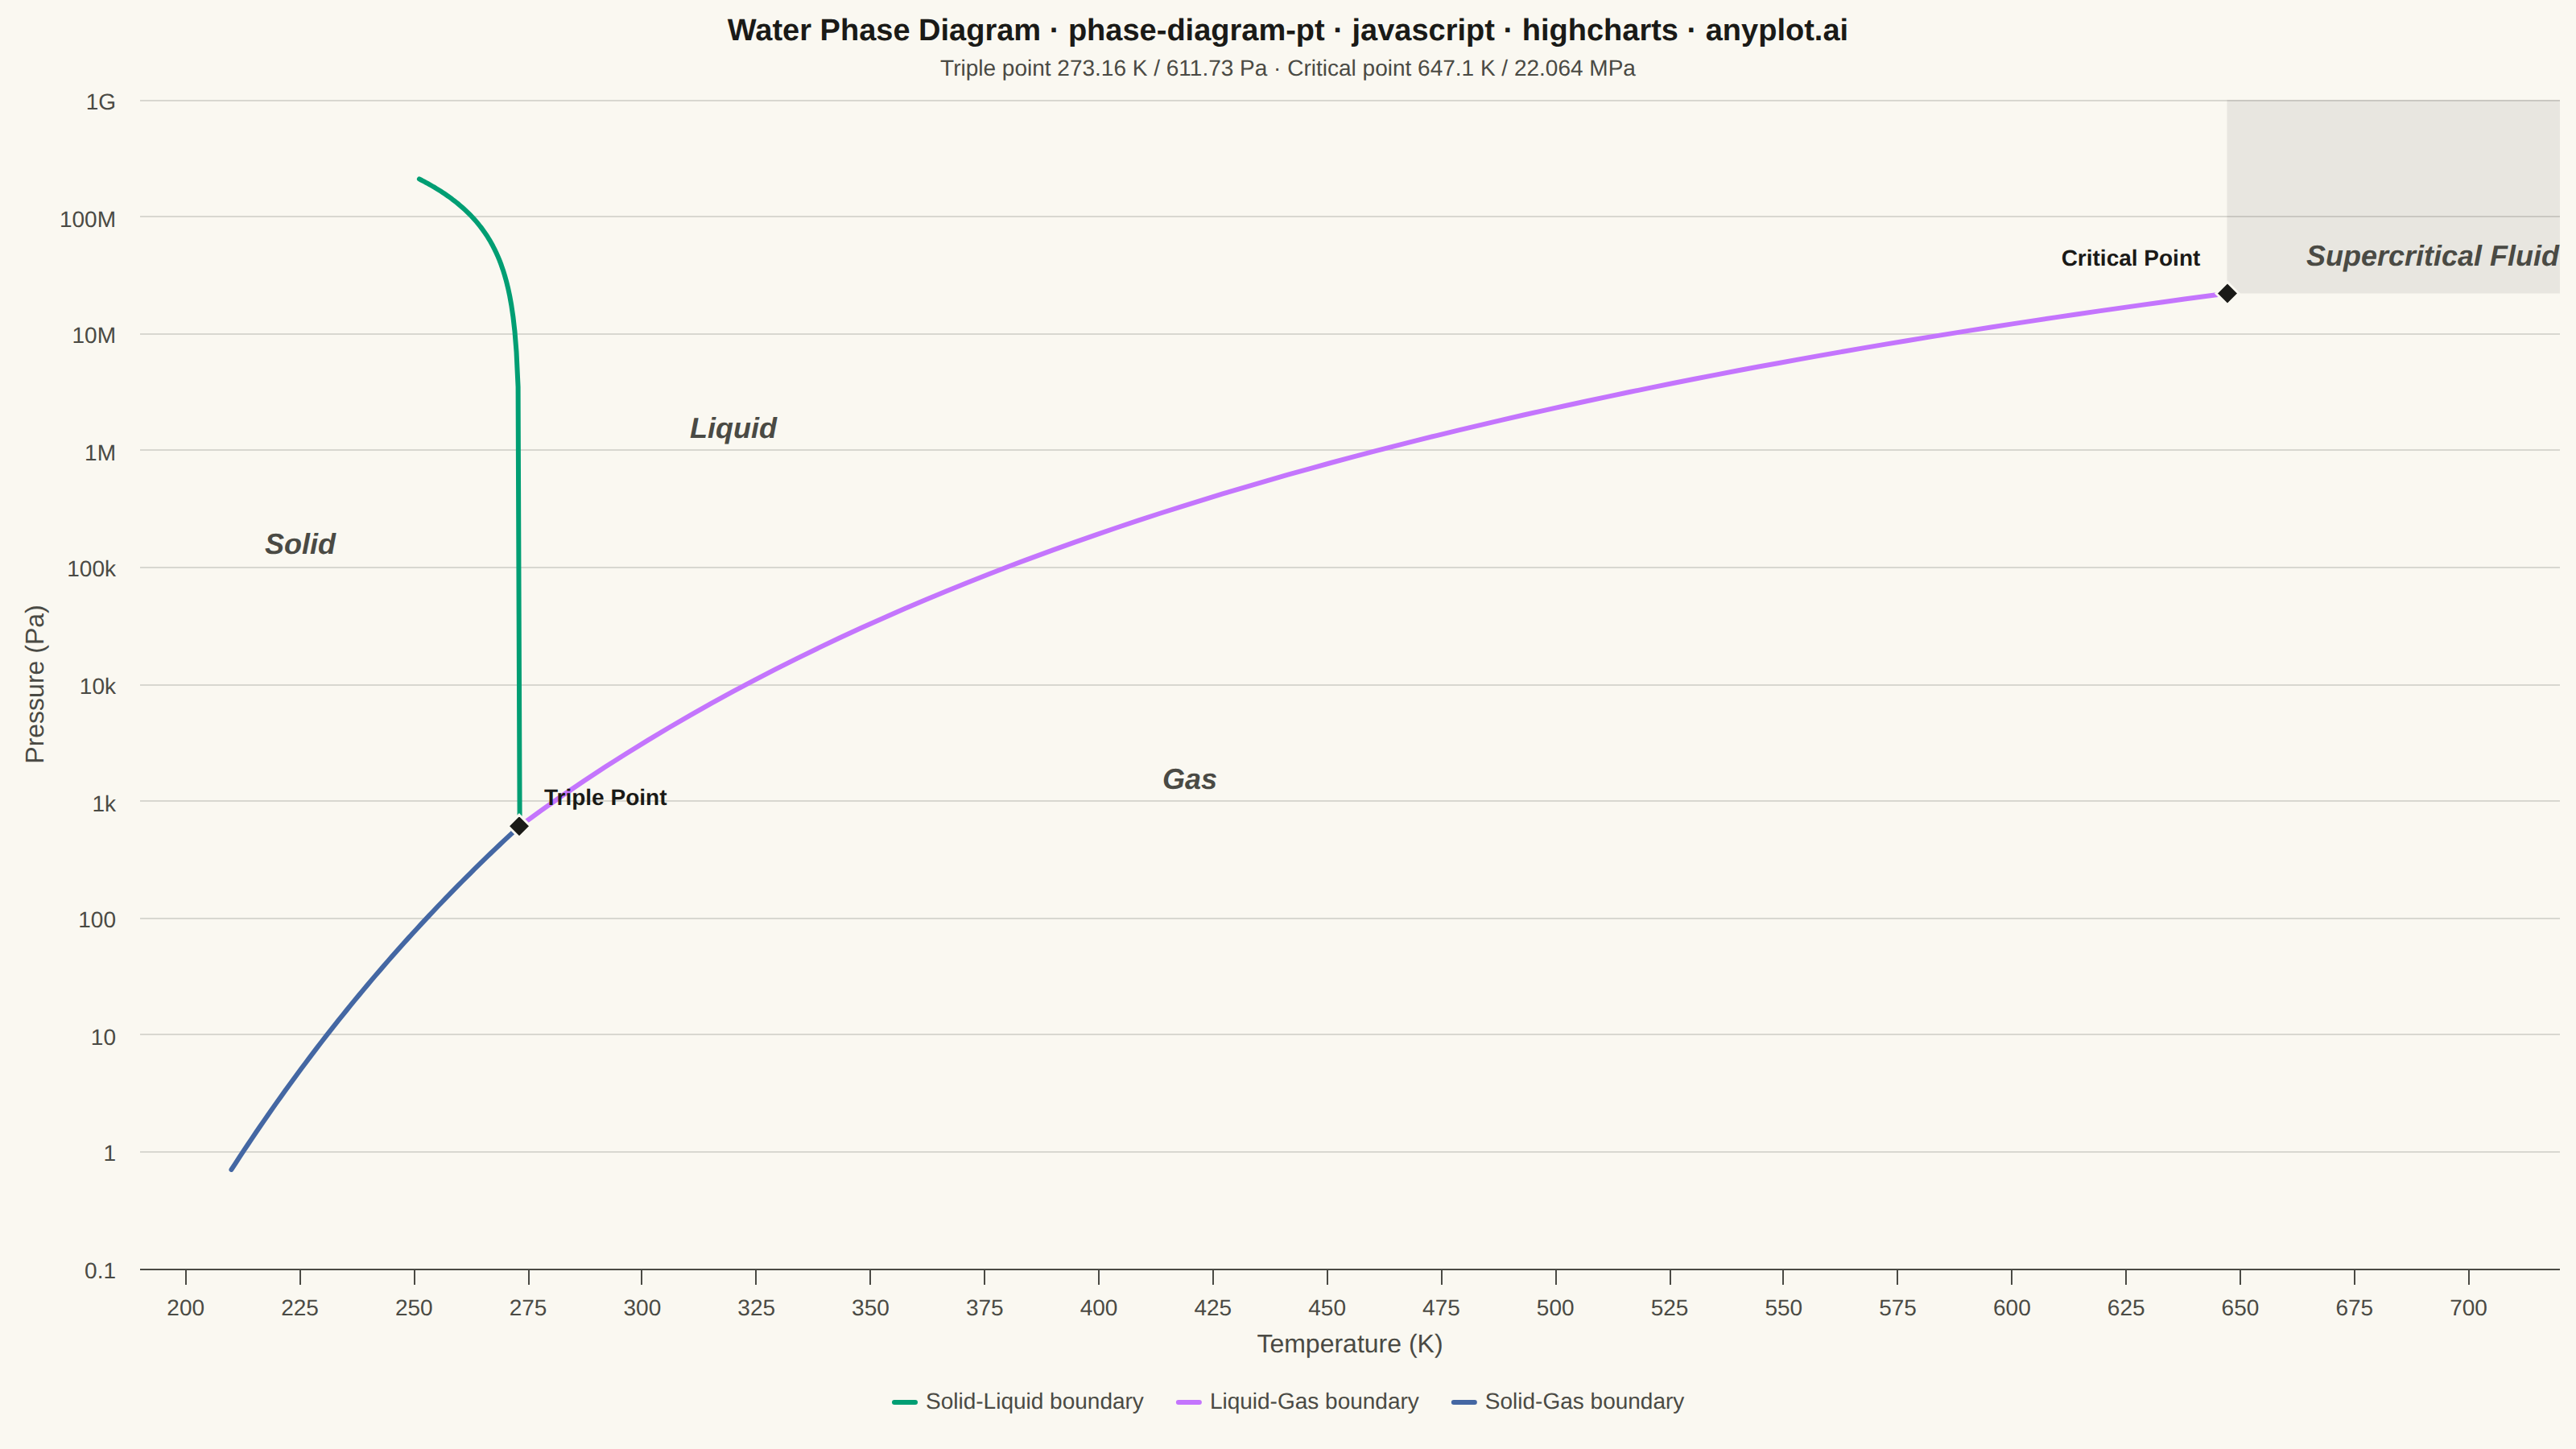
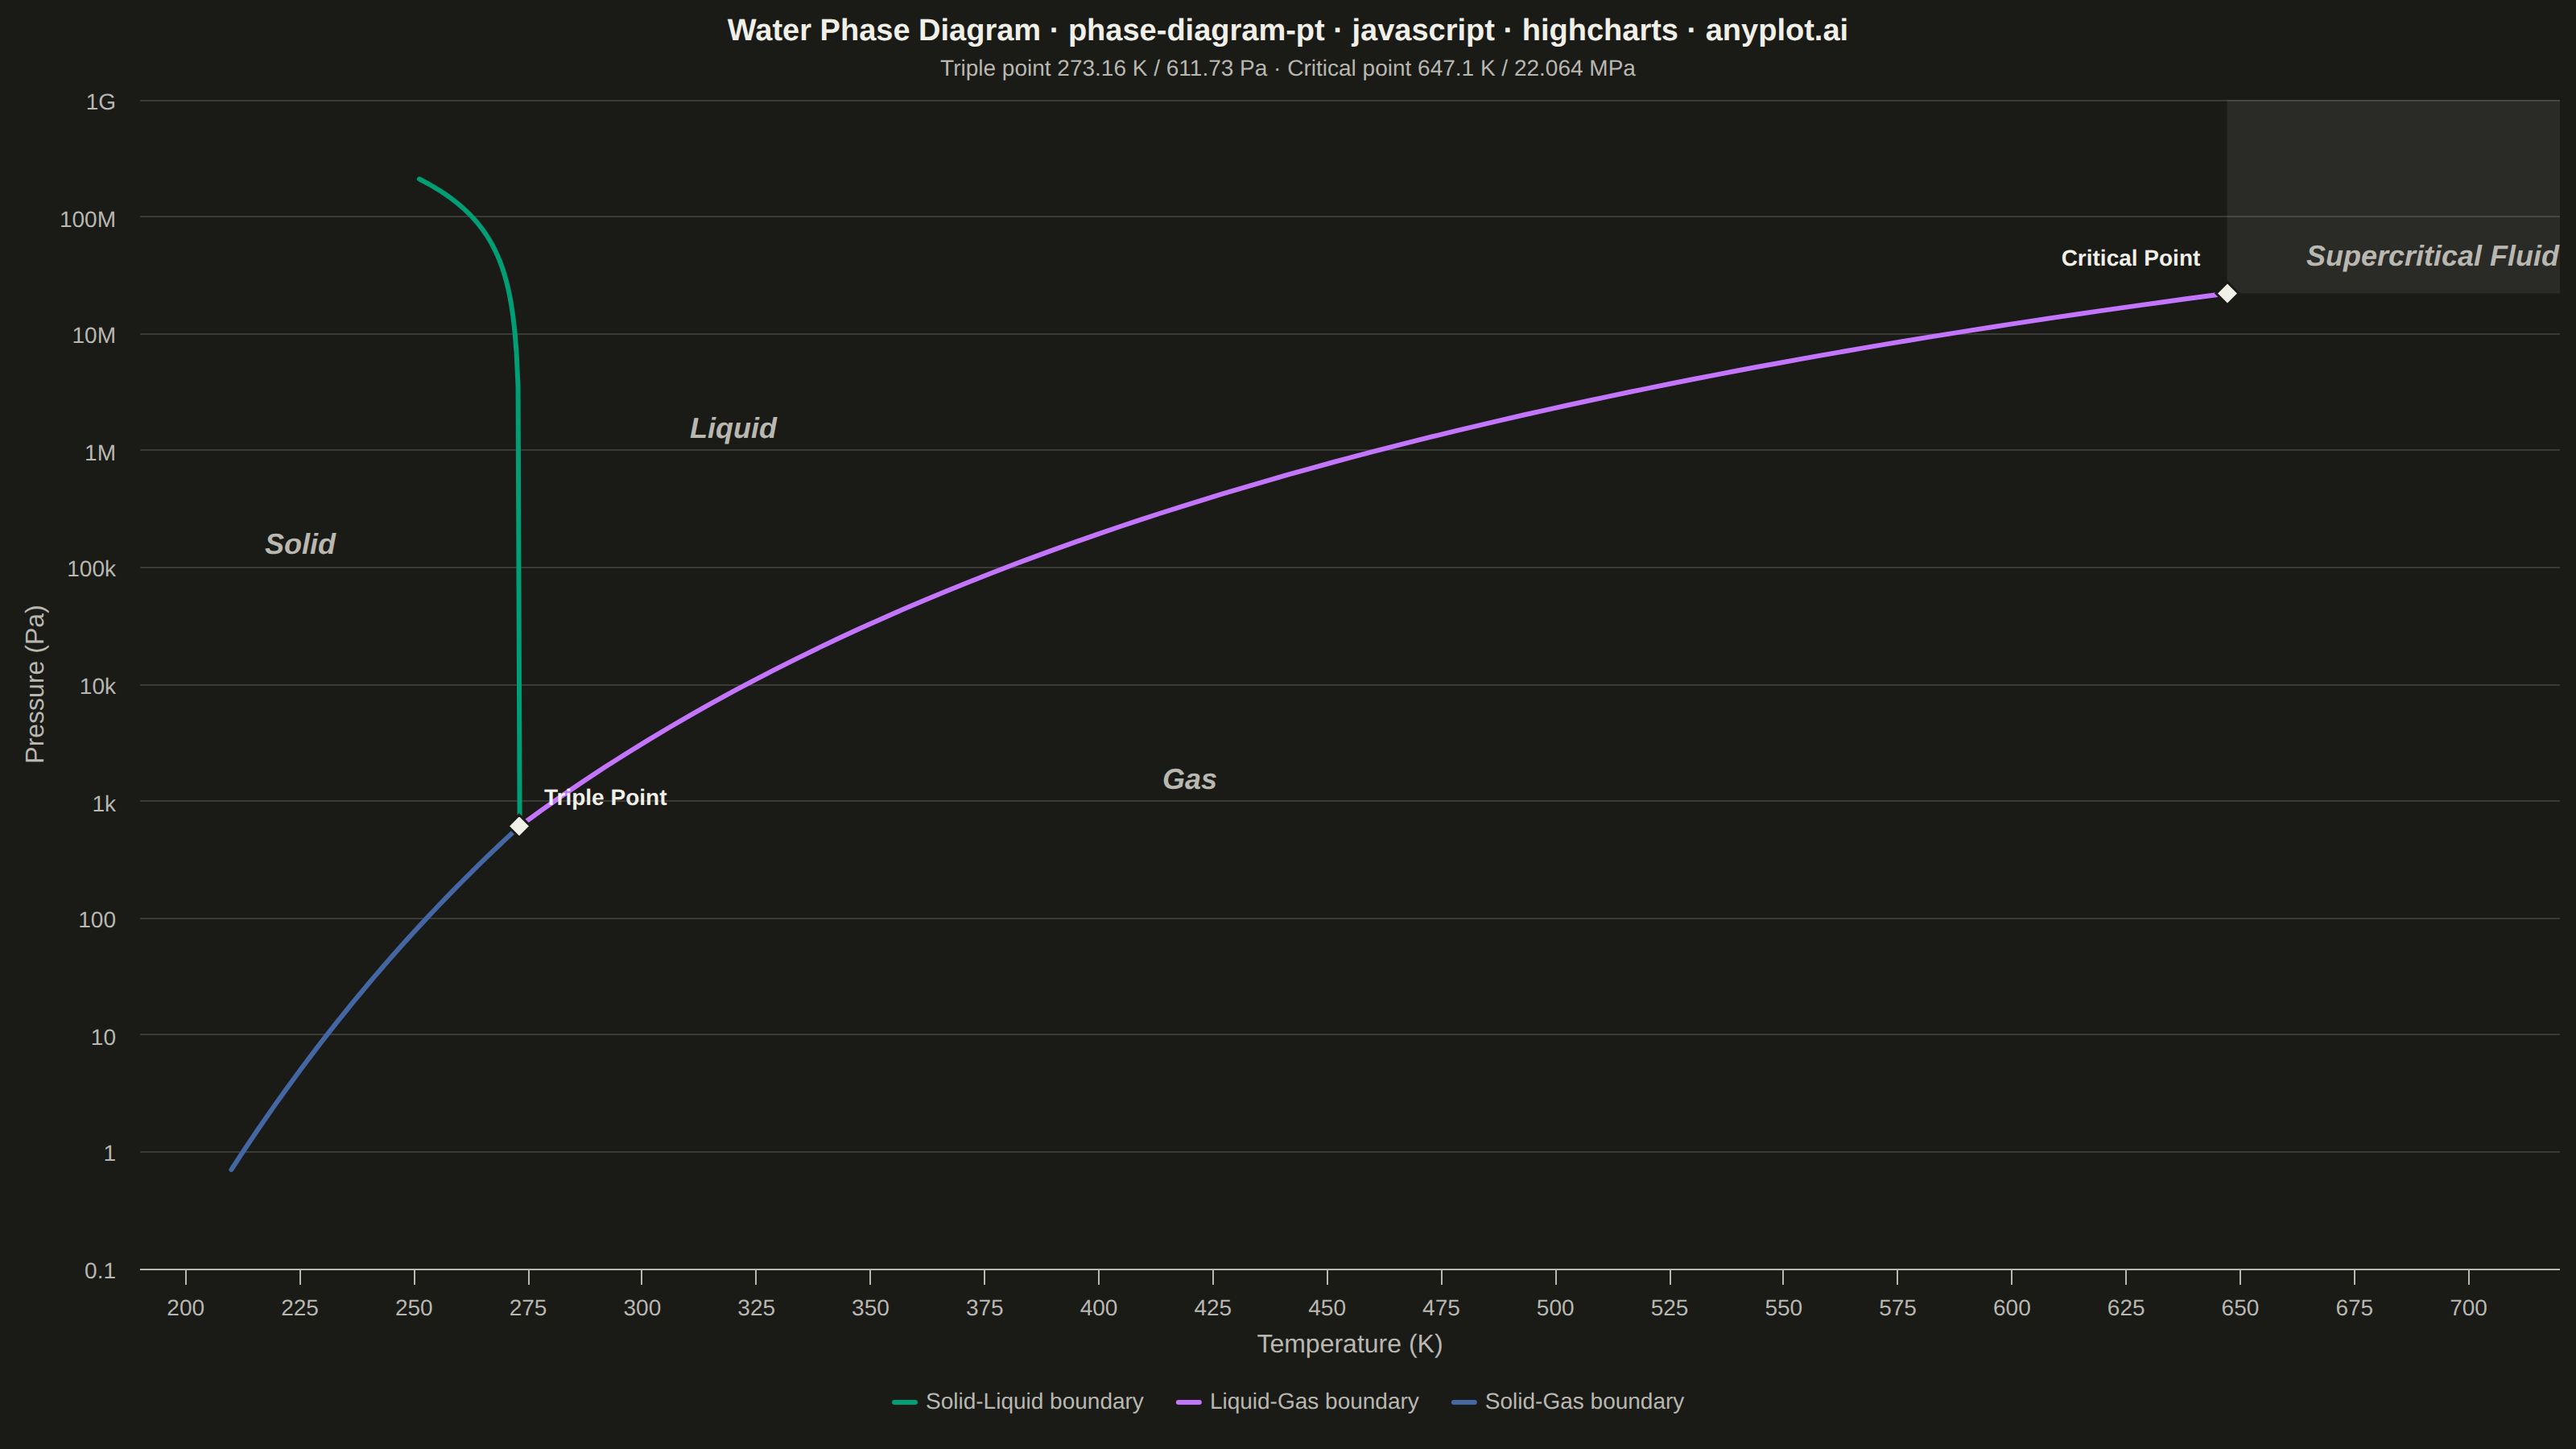
A pressure-temperature (P-T) phase diagram showing the boundaries between solid, liquid, and gas phases of a substance. The diagram includes the triple point where all three phases coexist and the critical point beyond which the liquid-gas distinction vanishes. This is one of the most fundamental diagrams in chemistry and physics, essential for understanding phase transitions and states of matter.
// anyplot.ai
// phase-diagram-pt: Thermodynamic Phase Diagram (Pressure-Temperature)
// Library: highcharts 12.6.0 | JavaScript 22.23.2
// Quality: 93/100 | Created: 2026-08-20

const t = window.ANYPLOT_TOKENS;

// --- Data: water's P-T phase boundaries -------------------------------------
// Reference points (well-known constants for water):
//   triple point:  273.16 K,   611.73 Pa
//   critical point: 647.1 K,   22.064 MPa
//   ice Ih/III/liquid triple point: 251.165 K, 209.9 MPa (fusion curve terminus)
const R = 8.314; // gas constant, J/(mol*K)

const TRIPLE_T = 273.16;
const TRIPLE_P = 611.73;
const CRITICAL_T = 647.1;
const CRITICAL_P = 22.064e6;
const ICE_III_T = 251.165;
const ICE_III_P = 209.9e6;

// Liquid-gas boundary: Clausius-Clapeyron, latent heat calibrated so the curve
// passes exactly through the triple point and the critical point.
const L_VAP = (-R * Math.log(CRITICAL_P / TRIPLE_P)) / (1 / CRITICAL_T - 1 / TRIPLE_T);
const VAPORIZATION_POINTS = 80;
const vaporizationCurve = [];
for (let i = 0; i <= VAPORIZATION_POINTS; i++) {
  const temperature = TRIPLE_T + (i / VAPORIZATION_POINTS) * (CRITICAL_T - TRIPLE_T);
  const pressure = TRIPLE_P * Math.exp((-L_VAP / R) * (1 / temperature - 1 / TRIPLE_T));
  vaporizationCurve.push([temperature, pressure]);
}

// Solid-gas boundary: Clausius-Clapeyron with the standard latent heat of
// sublimation for ice, anchored at the triple point.
const L_SUB = 51100; // J/mol
const SUB_T_MIN = 210;
const SUBLIMATION_POINTS = 70;
const sublimationCurve = [];
for (let i = 0; i <= SUBLIMATION_POINTS; i++) {
  const temperature = SUB_T_MIN + (i / SUBLIMATION_POINTS) * (TRIPLE_T - SUB_T_MIN);
  const pressure = TRIPLE_P * Math.exp((-L_SUB / R) * (1 / temperature - 1 / TRIPLE_T));
  sublimationCurve.push([temperature, pressure]);
}

// Solid-liquid boundary: water's anomalous negative slope (melting point drops
// as pressure rises), a linear-in-temperature approximation anchored at the
// triple point and the ice Ih/III/liquid triple point.
const FUSION_SLOPE = (ICE_III_P - TRIPLE_P) / (ICE_III_T / TRIPLE_T - 1);
const FUSION_POINTS = 60;
const fusionCurve = [];
for (let i = 0; i <= FUSION_POINTS; i++) {
  const temperature = TRIPLE_T + (i / FUSION_POINTS) * (ICE_III_T - TRIPLE_T);
  const pressure = TRIPLE_P + FUSION_SLOPE * (temperature / TRIPLE_T - 1);
  fusionCurve.push([temperature, pressure]);
}

// Phase region labels — literal chart text, always visible (not hover-dependent).
const regionLabels = [
  { x: 225, y: 1e5, text: "Solid" },
  { x: 320, y: 1e6, text: "Liquid" },
  { x: 420, y: 1e3, text: "Gas" },
  { x: 695, y: 3e7, text: "Supercritical Fluid" },
];

const referencePoints = [
  { x: TRIPLE_T, y: TRIPLE_P, name: "Triple Point", dataLabels: { align: "left", x: 10, y: -6 } },
  { x: CRITICAL_T, y: CRITICAL_P, name: "Critical Point", dataLabels: { align: "right", x: -12, y: -10 } },
];

// --- Title (fontsize scales down when the string runs past the 67-char baseline) ---
const TITLE = "Water Phase Diagram · phase-diagram-pt · javascript · highcharts · anyplot.ai";
const TITLE_DEFAULT_PX = 22;
const titleFontSize = Math.max(14, Math.round(TITLE_DEFAULT_PX * Math.min(1, 67 / TITLE.length)));

// --- Chart -------------------------------------------------------------------
Highcharts.chart("container", {
  chart: {
    type: "line",
    backgroundColor: "transparent",
    animation: false,
    style: { fontFamily: "inherit" },
    events: {
      // Soft background tint for the Supercritical Fluid corner (T > critical T
      // AND P > critical P) — the one region whose boundary is a straight
      // rectangle rather than a curve, so a flat shade stays physically honest.
      render() {
        if (this.supercriticalShade) return;
        const left = this.xAxis[0].toPixels(CRITICAL_T, false);
        const right = this.plotLeft + this.plotWidth;
        const plotAreaTop = this.plotTop;
        const criticalPTop = this.yAxis[0].toPixels(CRITICAL_P, false);
        if (right > left && criticalPTop > plotAreaTop) {
          this.supercriticalShade = this.renderer
            .rect(left, plotAreaTop, right - left, criticalPTop - plotAreaTop)
            .attr({ fill: Highcharts.color(t.ink).setOpacity(0.08).get(), zIndex: -1 })
            .add();
        }
      },
    },
  },
  credits: { enabled: false },
  colors: t.palette,
  title: {
    text: TITLE,
    style: { color: t.ink, fontSize: `${titleFontSize}px`, fontWeight: "600" },
  },
  subtitle: {
    text: "Triple point 273.16 K / 611.73 Pa · Critical point 647.1 K / 22.064 MPa",
    style: { color: t.inkSoft, fontSize: "14px" },
  },
  xAxis: {
    title: { text: "Temperature (K)", style: { color: t.inkSoft, fontSize: "16px" } },
    min: 190,
    max: 720,
    lineColor: t.inkSoft,
    tickColor: t.inkSoft,
    gridLineWidth: 0,
    labels: { style: { color: t.inkSoft, fontSize: "14px" } },
  },
  yAxis: {
    type: "logarithmic",
    title: { text: "Pressure (Pa)", style: { color: t.inkSoft, fontSize: "16px" } },
    min: 0.1,
    max: 5e8,
    gridLineColor: t.grid,
    lineColor: t.inkSoft,
    tickColor: t.inkSoft,
    labels: { style: { color: t.inkSoft, fontSize: "14px" } },
  },
  legend: {
    itemStyle: { color: t.inkSoft, fontSize: "14px" },
    itemHoverStyle: { color: t.ink },
  },
  plotOptions: {
    series: { animation: false },
  },
  series: [
    {
      name: "Solid-Liquid boundary",
      type: "line",
      data: fusionCurve,
      color: t.palette[0],
      lineWidth: 3,
      marker: { enabled: false },
      zIndex: 3,
    },
    {
      name: "Liquid-Gas boundary",
      type: "line",
      data: vaporizationCurve,
      color: t.palette[1],
      lineWidth: 3,
      marker: { enabled: false },
      zIndex: 3,
    },
    {
      name: "Solid-Gas boundary",
      type: "line",
      data: sublimationCurve,
      color: t.palette[2],
      lineWidth: 3,
      marker: { enabled: false },
      zIndex: 3,
    },
    {
      name: "Phase regions",
      type: "scatter",
      data: regionLabels.map((r) => ({ x: r.x, y: r.y, name: r.text })),
      color: t.inkSoft,
      showInLegend: false,
      marker: { enabled: false },
      dataLabels: {
        enabled: true,
        format: "{point.name}",
        style: { color: t.inkSoft, fontSize: "18px", fontStyle: "italic", textOutline: "none" },
      },
      zIndex: 1,
    },
    {
      name: "Reference points",
      type: "scatter",
      data: referencePoints.map((p) => ({
        x: p.x,
        y: p.y,
        name: p.name,
        dataLabels: p.dataLabels,
      })),
      color: t.ink,
      showInLegend: false,
      marker: { enabled: true, symbol: "diamond", radius: 7, lineWidth: 1.5, lineColor: t.pageBg },
      dataLabels: {
        enabled: true,
        allowOverlap: true,
        format: "{point.name}",
        style: { color: t.ink, fontSize: "14px", fontWeight: "600", textOutline: "none" },
      },
      zIndex: 4,
    },
  ],
});
Runnable source as JSON, for any HTTP client: https://api.anyplot.ai/specs/phase-diagram-pt/highcharts/code. Any spec id and library id listed in llms-full.txt fit the same URL shape; every URL below is complete and callable.
{
  "spec_id": "phase-diagram-pt",
  "language": "javascript",
  "library": "highcharts",
  "page": "https://anyplot.ai/phase-diagram-pt/javascript/highcharts",
  "hub": "https://anyplot.ai/phase-diagram-pt",
  "code_json": "https://api.anyplot.ai/specs/phase-diagram-pt/highcharts/code",
  "spec_json": "https://api.anyplot.ai/specs/phase-diagram-pt",
  "render_light_png": "https://storage.googleapis.com/anyplot-images/plots/phase-diagram-pt/javascript/highcharts/plot-light.png",
  "render_dark_png": "https://storage.googleapis.com/anyplot-images/plots/phase-diagram-pt/javascript/highcharts/plot-dark.png",
  "interactive_light_html": "https://storage.googleapis.com/anyplot-images/plots/phase-diagram-pt/javascript/highcharts/plot-light.html",
  "interactive_dark_html": "https://storage.googleapis.com/anyplot-images/plots/phase-diagram-pt/javascript/highcharts/plot-dark.html",
  "quality_score": 93.0,
  "license": "MIT",
  "guide": "https://anyplot.ai/llms.txt"
}
Part of Thermodynamic Phase Diagram (Pressure-Temperature) on anyplot.ai.