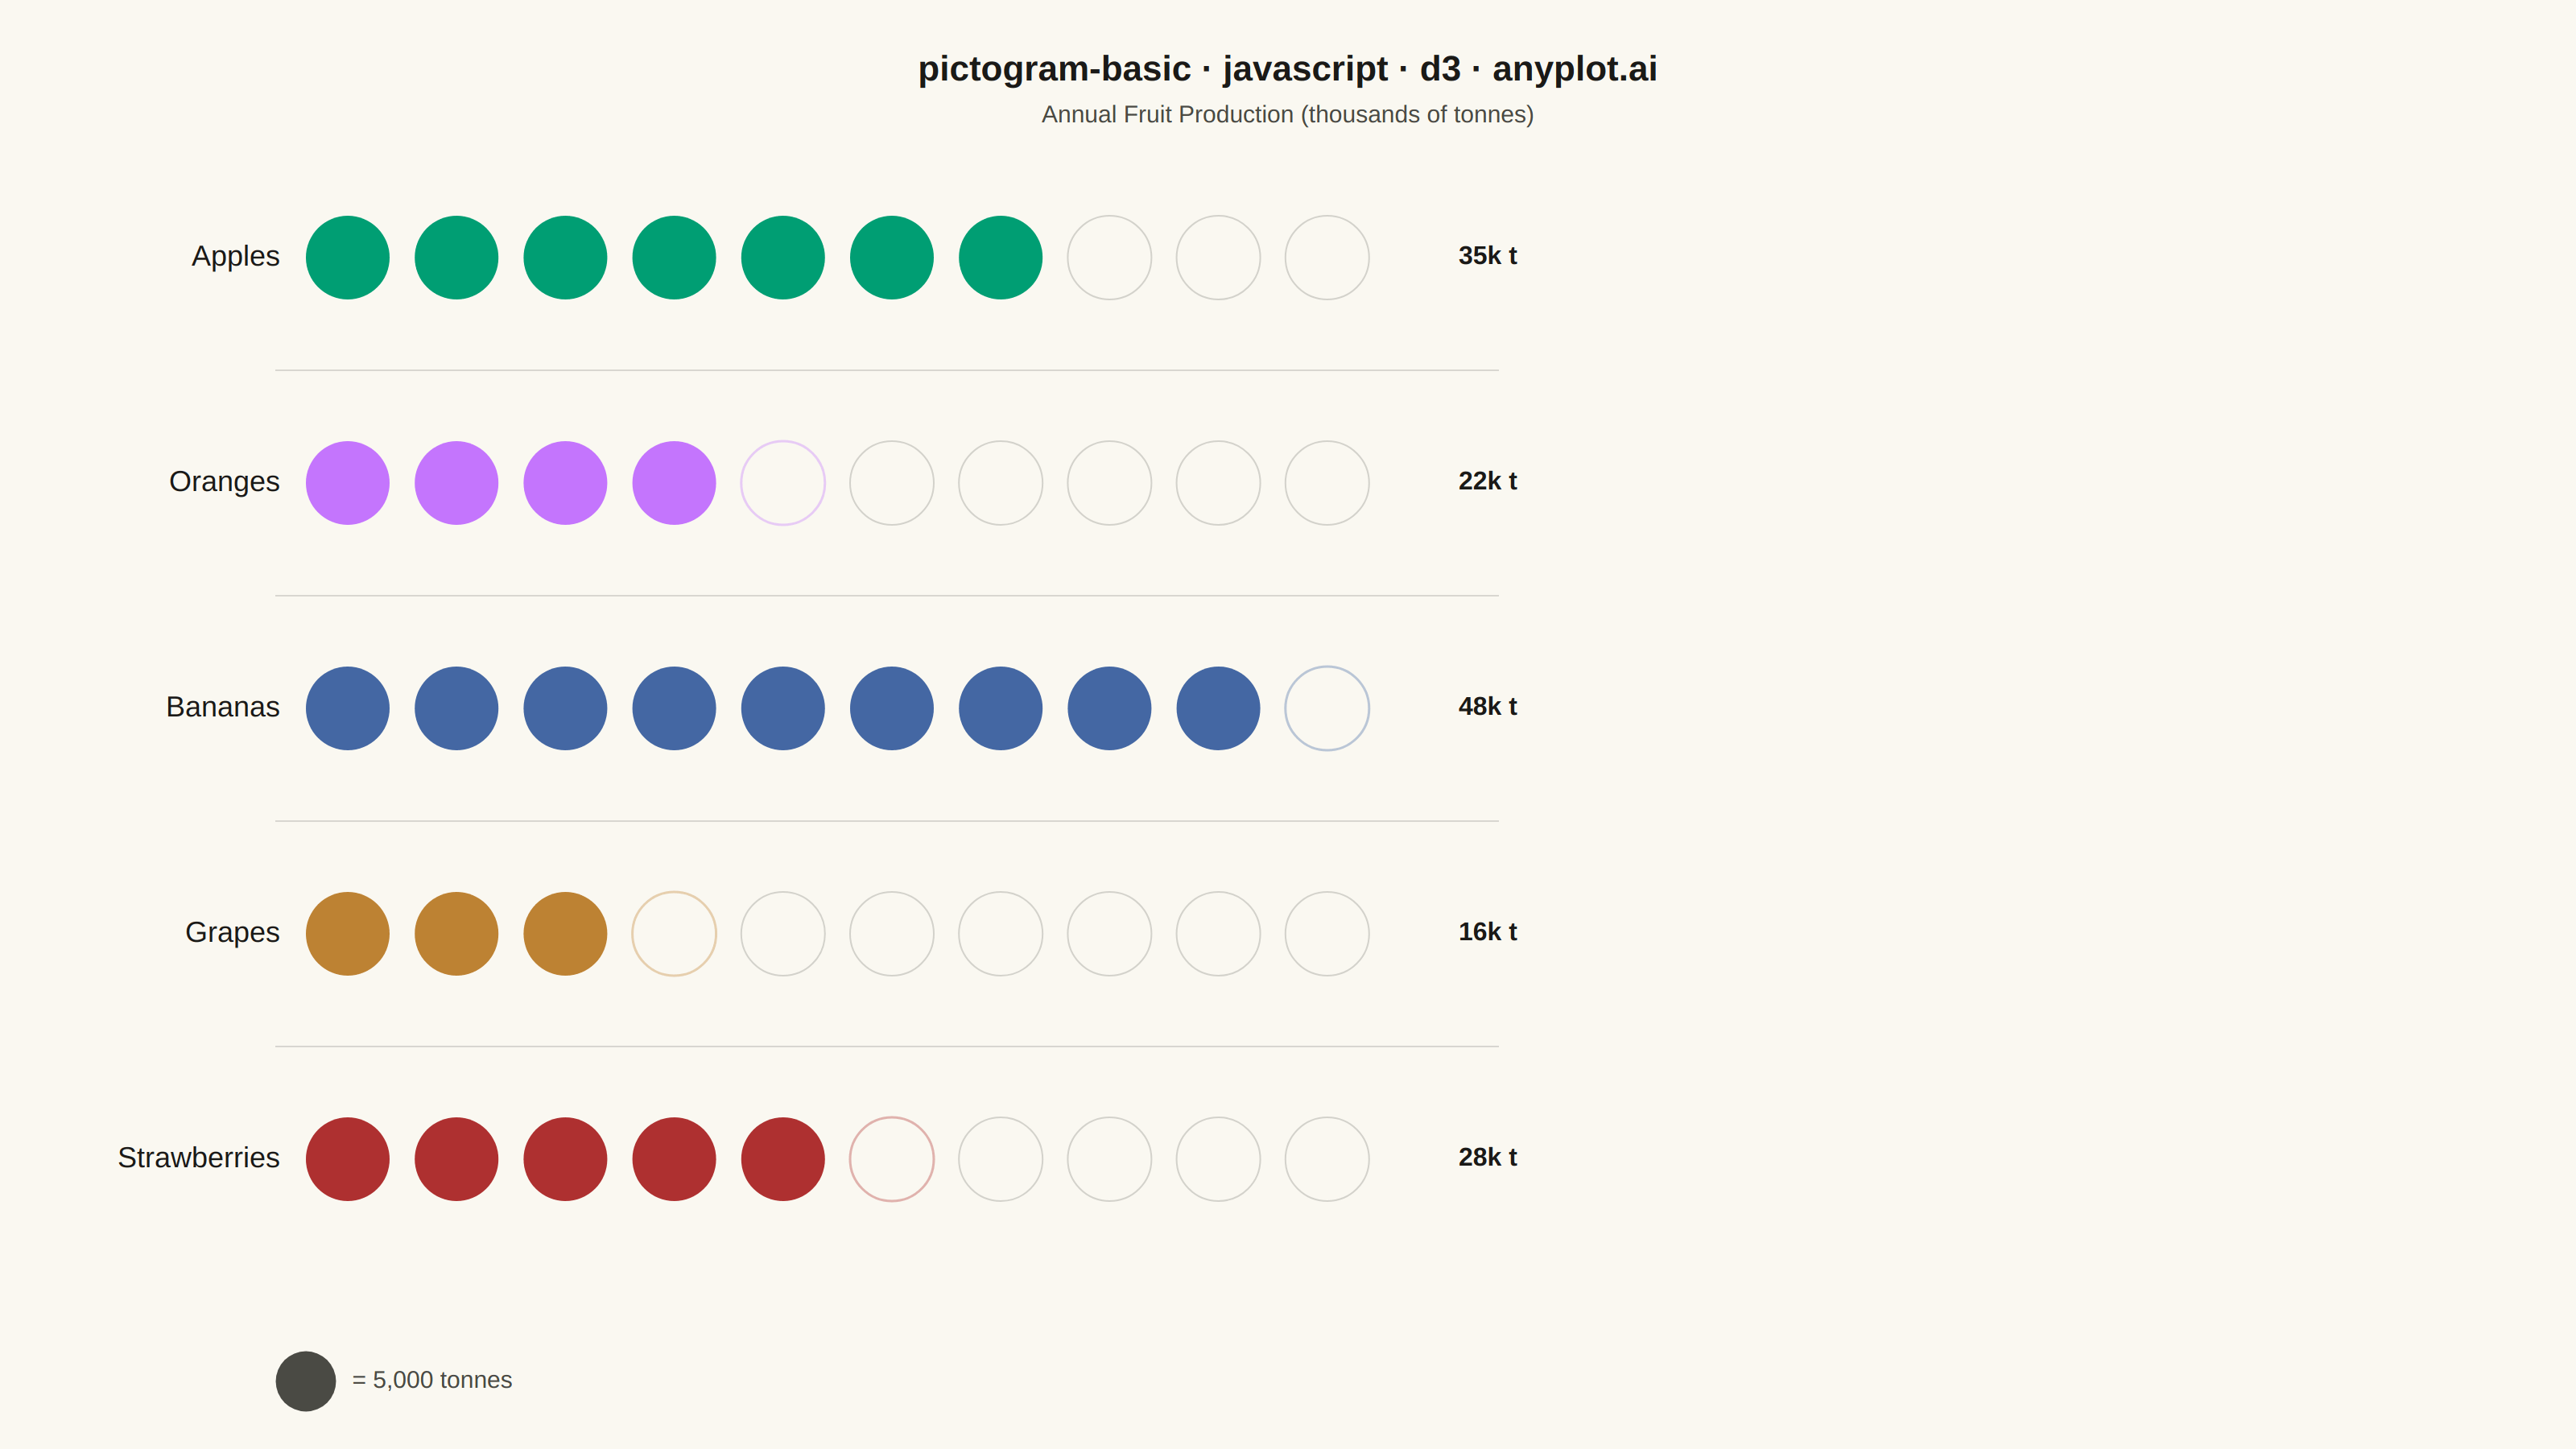
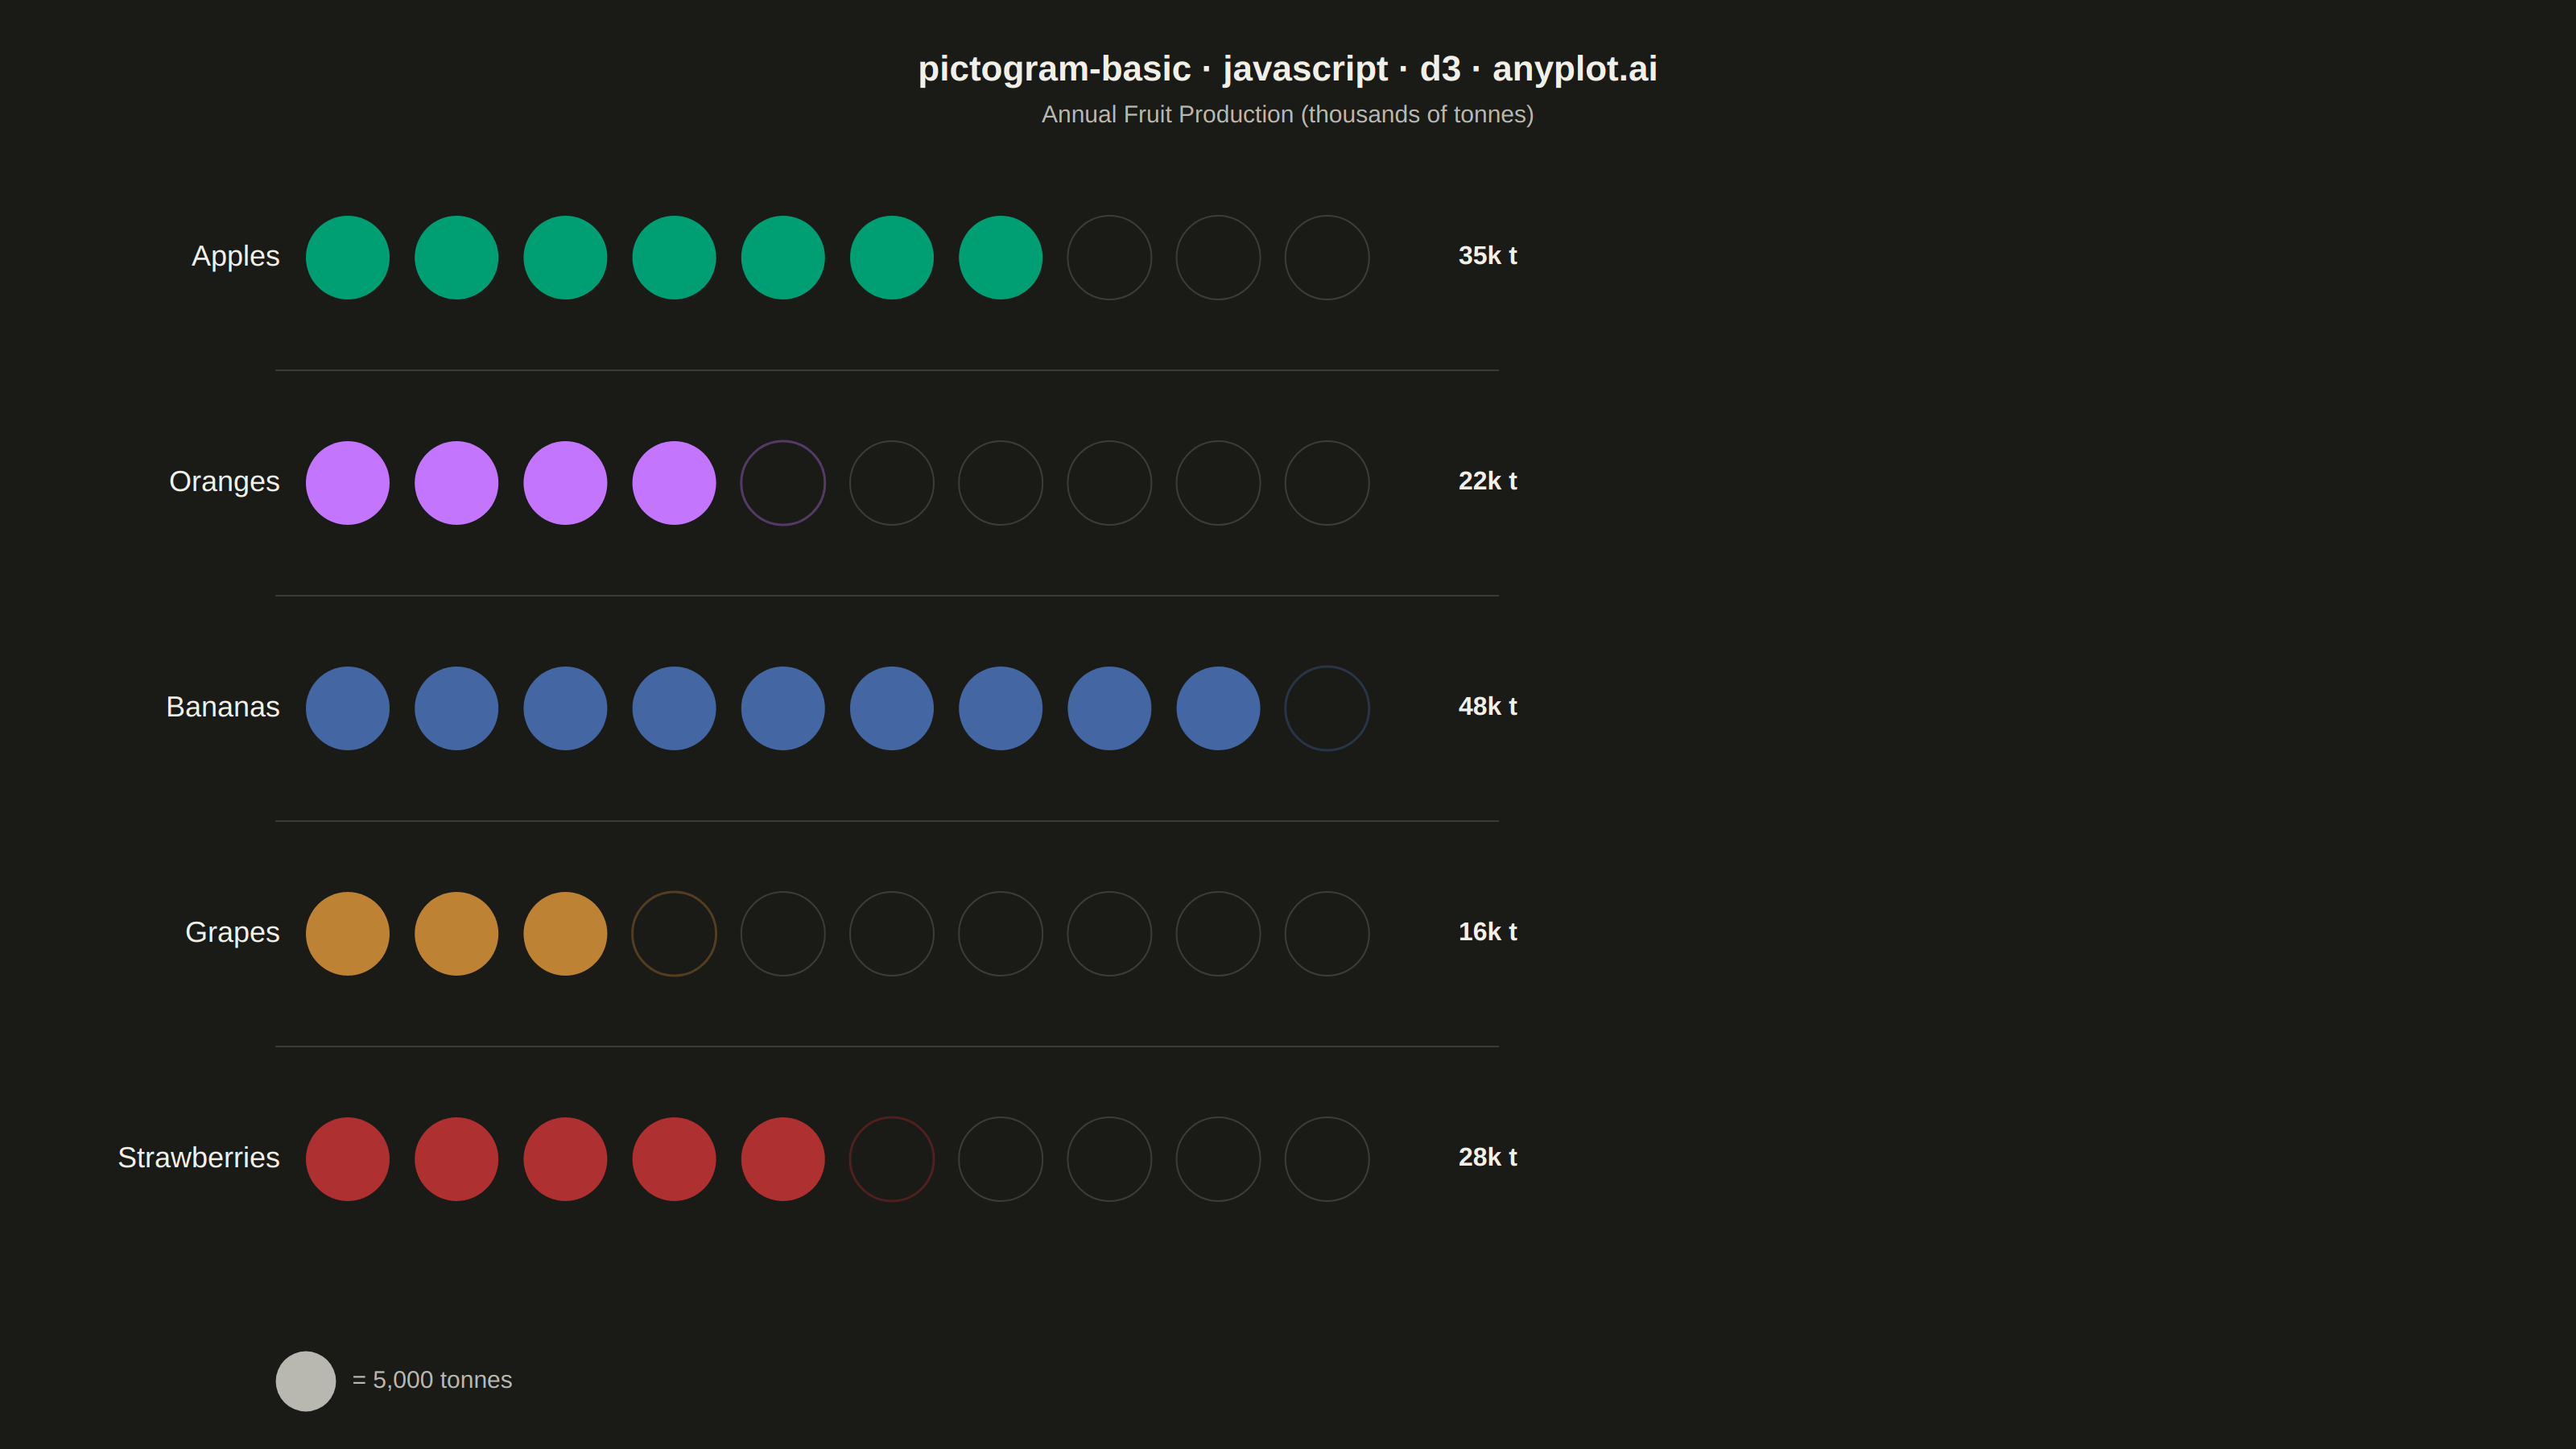
A pictogram chart represents quantities using repeated icons or symbols, where each icon stands for a fixed number of units. Inspired by Otto Neurath's ISOTYPE system, this visualization makes numerical comparisons more intuitive and engaging than plain bar charts. It is especially effective for public-facing data communication and infographics where visual appeal and immediate comprehension are important.
Preview render from the D3.js implementation.