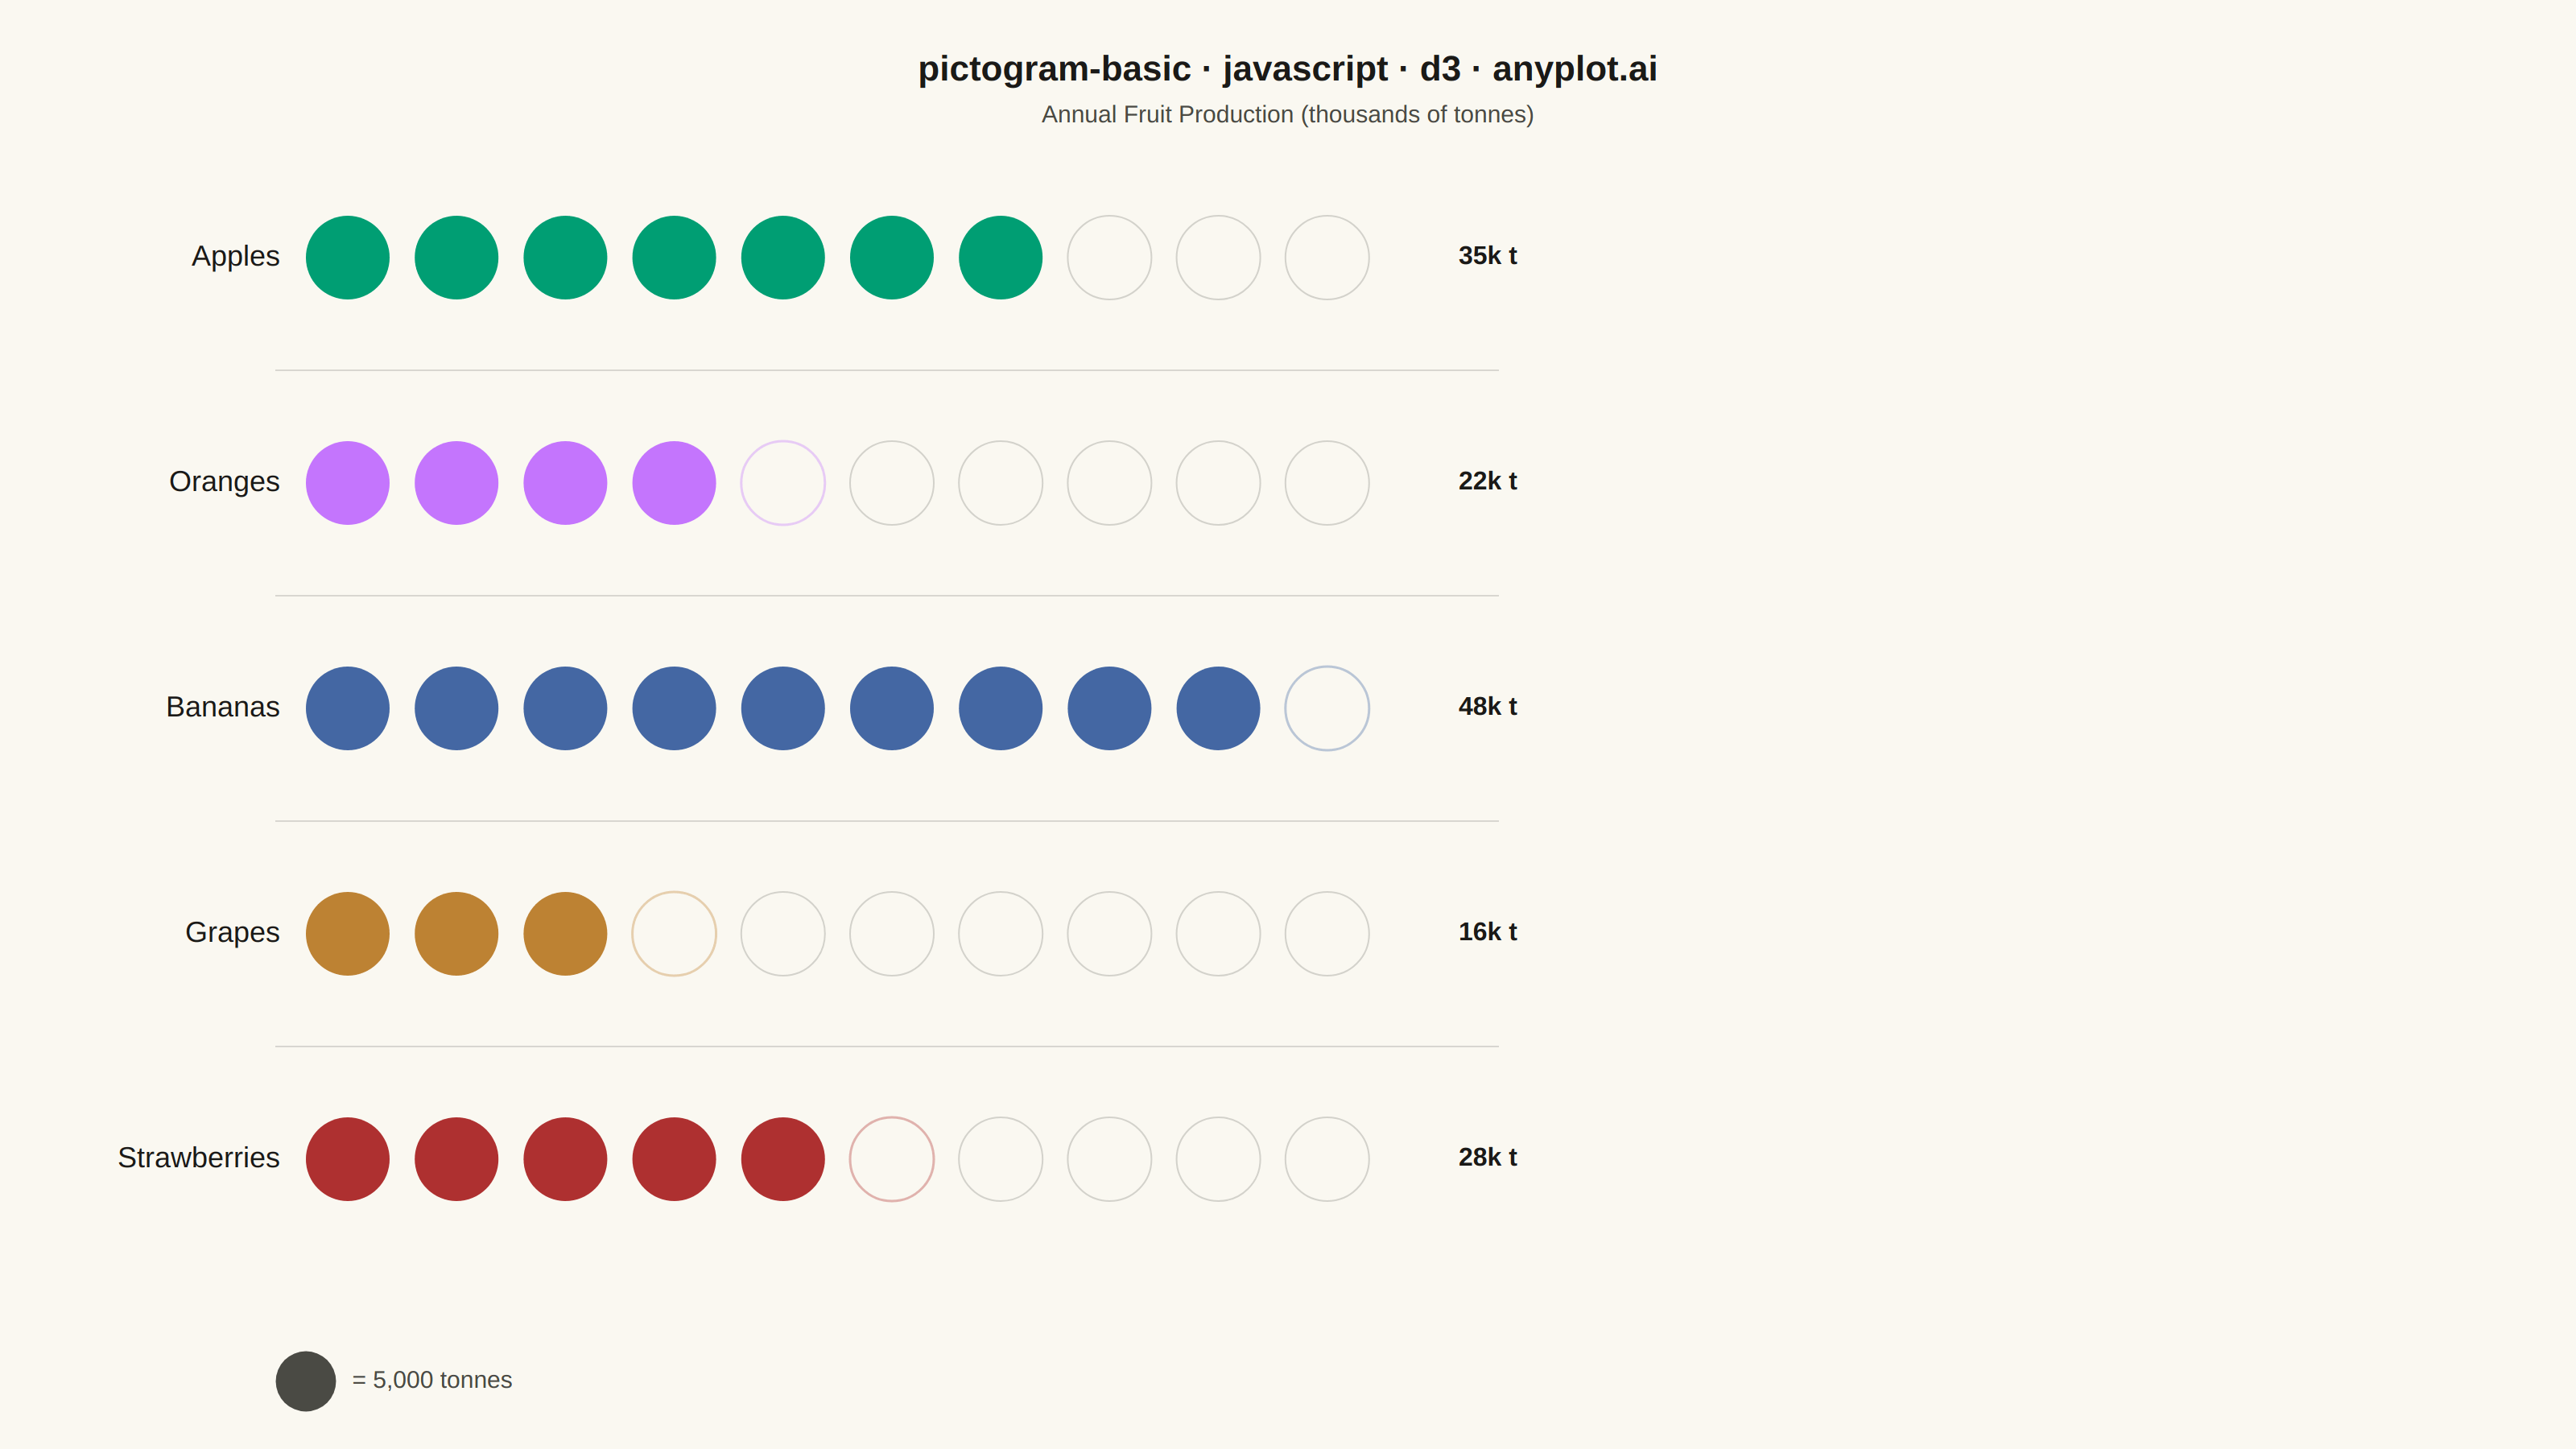
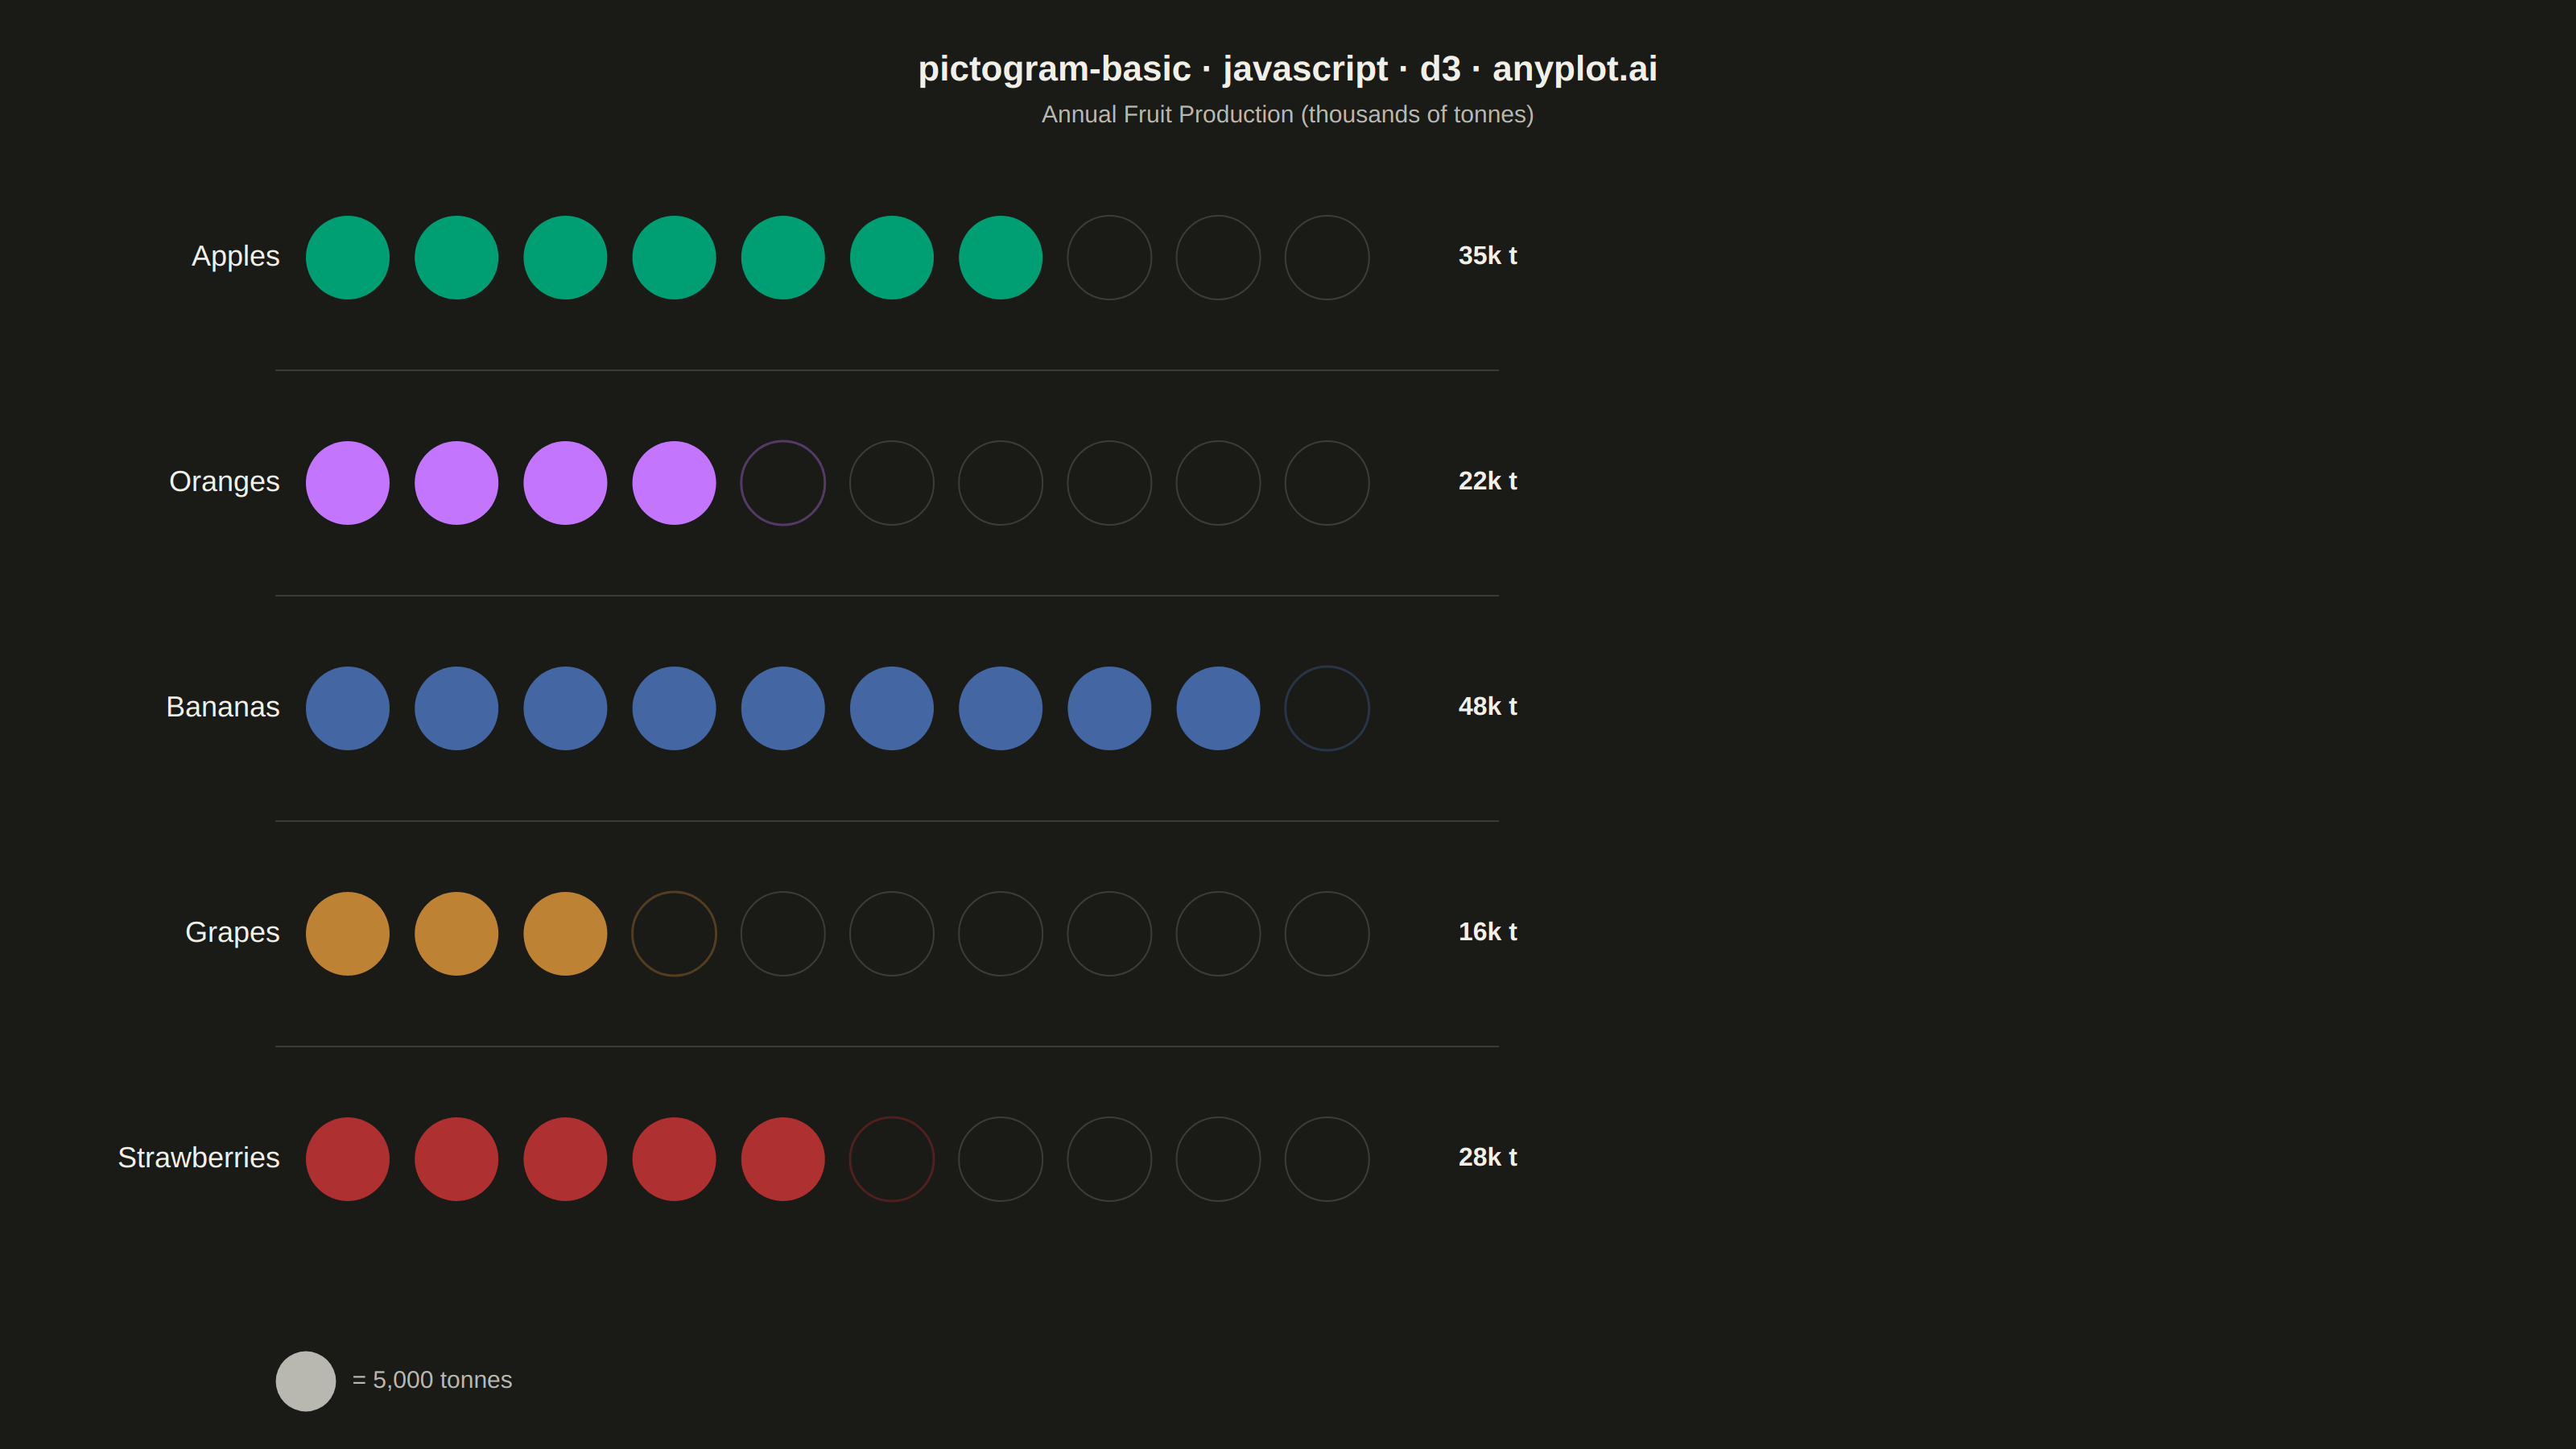
The same plot in 14 other libraries — JavaScript: Chart.js, Apache ECharts, Highcharts, MUI X Charts; Python: Altair, Bokeh, lets-plot, Matplotlib, Plotly, plotnine, Pygal, Seaborn; R: ggplot2; Julia: Makie.jl. Compare all 15 side by side: Pictogram Chart (Isotype Visualization) in Python, R, Julia and JavaScript.
A pictogram chart represents quantities using repeated icons or symbols, where each icon stands for a fixed number of units. Inspired by Otto Neurath's ISOTYPE system, this visualization makes numerical comparisons more intuitive and engaging than plain bar charts. It is especially effective for public-facing data communication and infographics where visual appeal and immediate comprehension are important.
// anyplot.ai
// pictogram-basic: Pictogram Chart (Isotype Visualization)
// Library: d3 7.9.0 | JavaScript 22.22.3
// Quality: 92/100 | Created: 2026-06-03

const t = window.ANYPLOT_TOKENS;
const { width, height } = window.ANYPLOT_SIZE;

const UNIT = 5; // each icon represents 5,000 tonnes

const data = [
  { label: "Apples",       value: 35 },
  { label: "Oranges",      value: 22 },
  { label: "Bananas",      value: 48 },
  { label: "Grapes",       value: 16 },
  { label: "Strawberries", value: 28 },
];

const margin = { top: 90, right: 70, bottom: 110, left: 190 };
const iw = width - margin.left - margin.right;
const ih = height - margin.top - margin.bottom;

const svg = d3.select("#container").append("svg")
  .attr("width", width).attr("height", height);

const defs = svg.append("defs");
const g = svg.append("g").attr("transform", `translate(${margin.left},${margin.top})`);

// Layout
const rowH = ih / data.length;
const iconR = Math.min(rowH * 0.26, 26);
const iconSpacing = iconR * 2.6;
const maxIcons = Math.ceil(d3.max(data, (d) => d.value) / UNIT);

// Row separators (subtle)
for (let i = 1; i < data.length; i++) {
  g.append("line")
    .attr("x1", -margin.left * 0.1).attr("y1", i * rowH)
    .attr("x2", maxIcons * iconSpacing + iconR * 2.5).attr("y2", i * rowH)
    .attr("stroke", t.grid).attr("stroke-width", 1);
}

// Draw each category row
data.forEach((d, i) => {
  const fullIcons = Math.floor(d.value / UNIT);
  const frac = (d.value % UNIT) / UNIT;
  const totalIcons = fullIcons + (frac > 0 ? 1 : 0);
  const color = t.palette[i % t.palette.length];
  const cy = i * rowH + rowH / 2;

  // Category label
  g.append("text")
    .attr("x", -16)
    .attr("y", cy)
    .attr("text-anchor", "end")
    .attr("dominant-baseline", "middle")
    .attr("fill", t.ink)
    .style("font-size", "18px")
    .style("font-weight", "500")
    .text(d.label);

  // Draw icons
  for (let j = 0; j < maxIcons; j++) {
    const cx = j * iconSpacing + iconR;

    if (j < fullIcons) {
      // Full filled icon
      g.append("circle")
        .attr("cx", cx).attr("cy", cy).attr("r", iconR)
        .attr("fill", color);
    } else if (j === fullIcons && frac > 0) {
      // Partial icon using clipPath (coordinates in SVG root space)
      const clipId = `clip-${i}-${j}`;
      defs.append("clipPath").attr("id", clipId)
        .append("rect")
        .attr("x", margin.left + cx - iconR)
        .attr("y", margin.top + cy - iconR)
        .attr("width", iconR * 2 * frac)
        .attr("height", iconR * 2);

      // Empty circle outline for the partial slot
      g.append("circle")
        .attr("cx", cx).attr("cy", cy).attr("r", iconR)
        .attr("fill", "none")
        .attr("stroke", color).attr("stroke-width", 1.5)
        .attr("opacity", 0.35);

      // Filled portion via clip
      g.append("circle")
        .attr("cx", cx).attr("cy", cy).attr("r", iconR)
        .attr("fill", color)
        .attr("clip-path", `url(#${clipId})`);
    } else {
      // Empty slot — shows the maximum scale context
      g.append("circle")
        .attr("cx", cx).attr("cy", cy).attr("r", iconR)
        .attr("fill", "none")
        .attr("stroke", t.inkSoft)
        .attr("stroke-width", 1)
        .attr("opacity", 0.22);
    }
  }

  // Value label after icon row
  const labelX = maxIcons * iconSpacing + iconR + 14;
  g.append("text")
    .attr("x", labelX)
    .attr("y", cy)
    .attr("dominant-baseline", "middle")
    .attr("fill", t.ink)
    .style("font-size", "16px")
    .style("font-weight", "600")
    .text(`${d.value}k t`);
});

// Legend at bottom
const legendY = ih + 68;
const legendR = iconR * 0.72;

g.append("circle")
  .attr("cx", 0).attr("cy", legendY)
  .attr("r", legendR)
  .attr("fill", t.inkSoft);

g.append("text")
  .attr("x", legendR + 10).attr("y", legendY)
  .attr("dominant-baseline", "middle")
  .attr("fill", t.inkSoft)
  .style("font-size", "15px")
  .text(`= ${UNIT},000 tonnes`);

// Subtitle
svg.append("text")
  .attr("x", width / 2).attr("y", margin.top - 14)
  .attr("text-anchor", "middle")
  .attr("fill", t.inkSoft)
  .style("font-size", "15px")
  .text("Annual Fruit Production (thousands of tonnes)");

// Title
svg.append("text")
  .attr("x", width / 2).attr("y", 50)
  .attr("text-anchor", "middle")
  .attr("fill", t.ink)
  .style("font-size", "22px")
  .style("font-weight", "600")
  .text("pictogram-basic · javascript · d3 · anyplot.ai");
Runnable source as JSON, for any HTTP client: https://api.anyplot.ai/specs/pictogram-basic/d3/code. Any spec id and library id listed in llms-full.txt fit the same URL shape; every URL below is complete and callable.
{
  "spec_id": "pictogram-basic",
  "language": "javascript",
  "library": "d3",
  "page": "https://anyplot.ai/pictogram-basic/javascript/d3",
  "hub": "https://anyplot.ai/pictogram-basic",
  "code_json": "https://api.anyplot.ai/specs/pictogram-basic/d3/code",
  "spec_json": "https://api.anyplot.ai/specs/pictogram-basic",
  "render_light_png": "https://storage.googleapis.com/anyplot-images/plots/pictogram-basic/javascript/d3/plot-light.png",
  "render_dark_png": "https://storage.googleapis.com/anyplot-images/plots/pictogram-basic/javascript/d3/plot-dark.png",
  "interactive_light_html": "https://storage.googleapis.com/anyplot-images/plots/pictogram-basic/javascript/d3/plot-light.html",
  "interactive_dark_html": "https://storage.googleapis.com/anyplot-images/plots/pictogram-basic/javascript/d3/plot-dark.html",
  "quality_score": 92.0,
  "license": "MIT",
  "guide": "https://anyplot.ai/llms.txt"
}
Part of Pictogram Chart (Isotype Visualization) on anyplot.ai.