The same plot in 14 other libraries — Python: Altair, Bokeh, lets-plot, Plotly, plotnine, Pygal, Seaborn; R: ggplot2; Julia: Makie.jl; JavaScript: Chart.js, D3.js, Apache ECharts, Highcharts, MUI X Charts. Compare all 15 side by side: Pictogram Chart (Isotype Visualization) in Python, R, Julia and JavaScript.
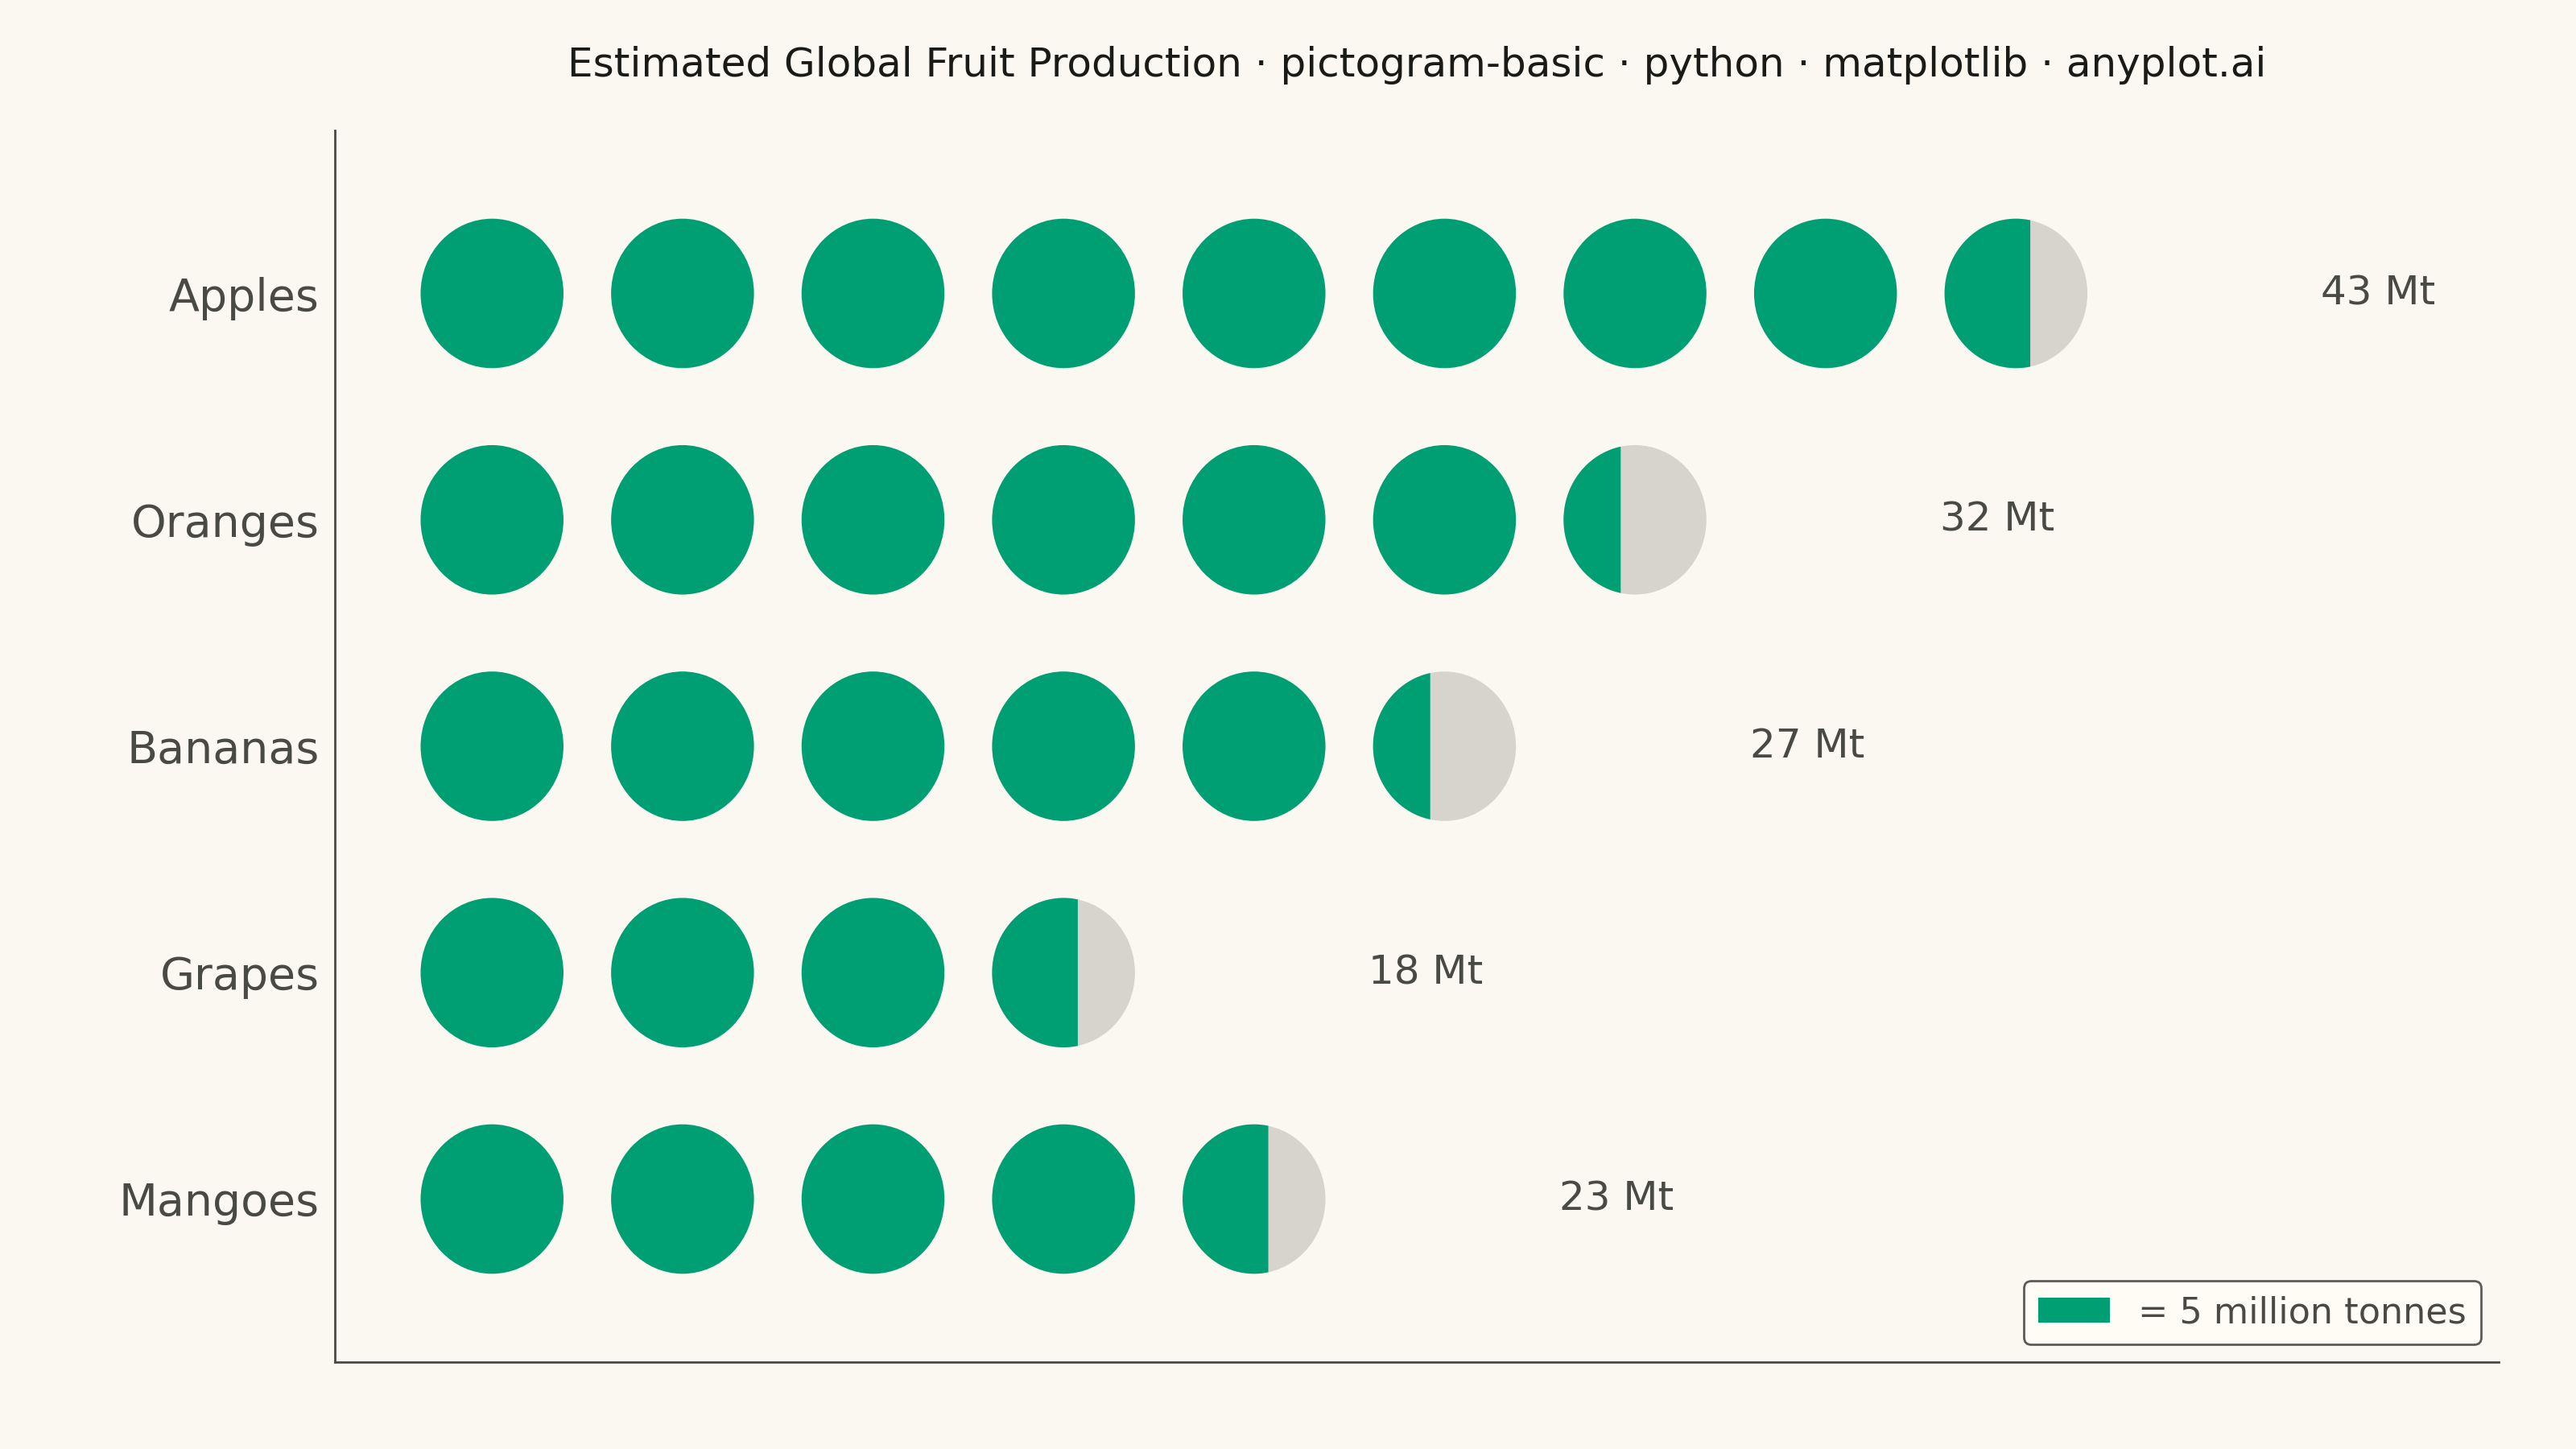
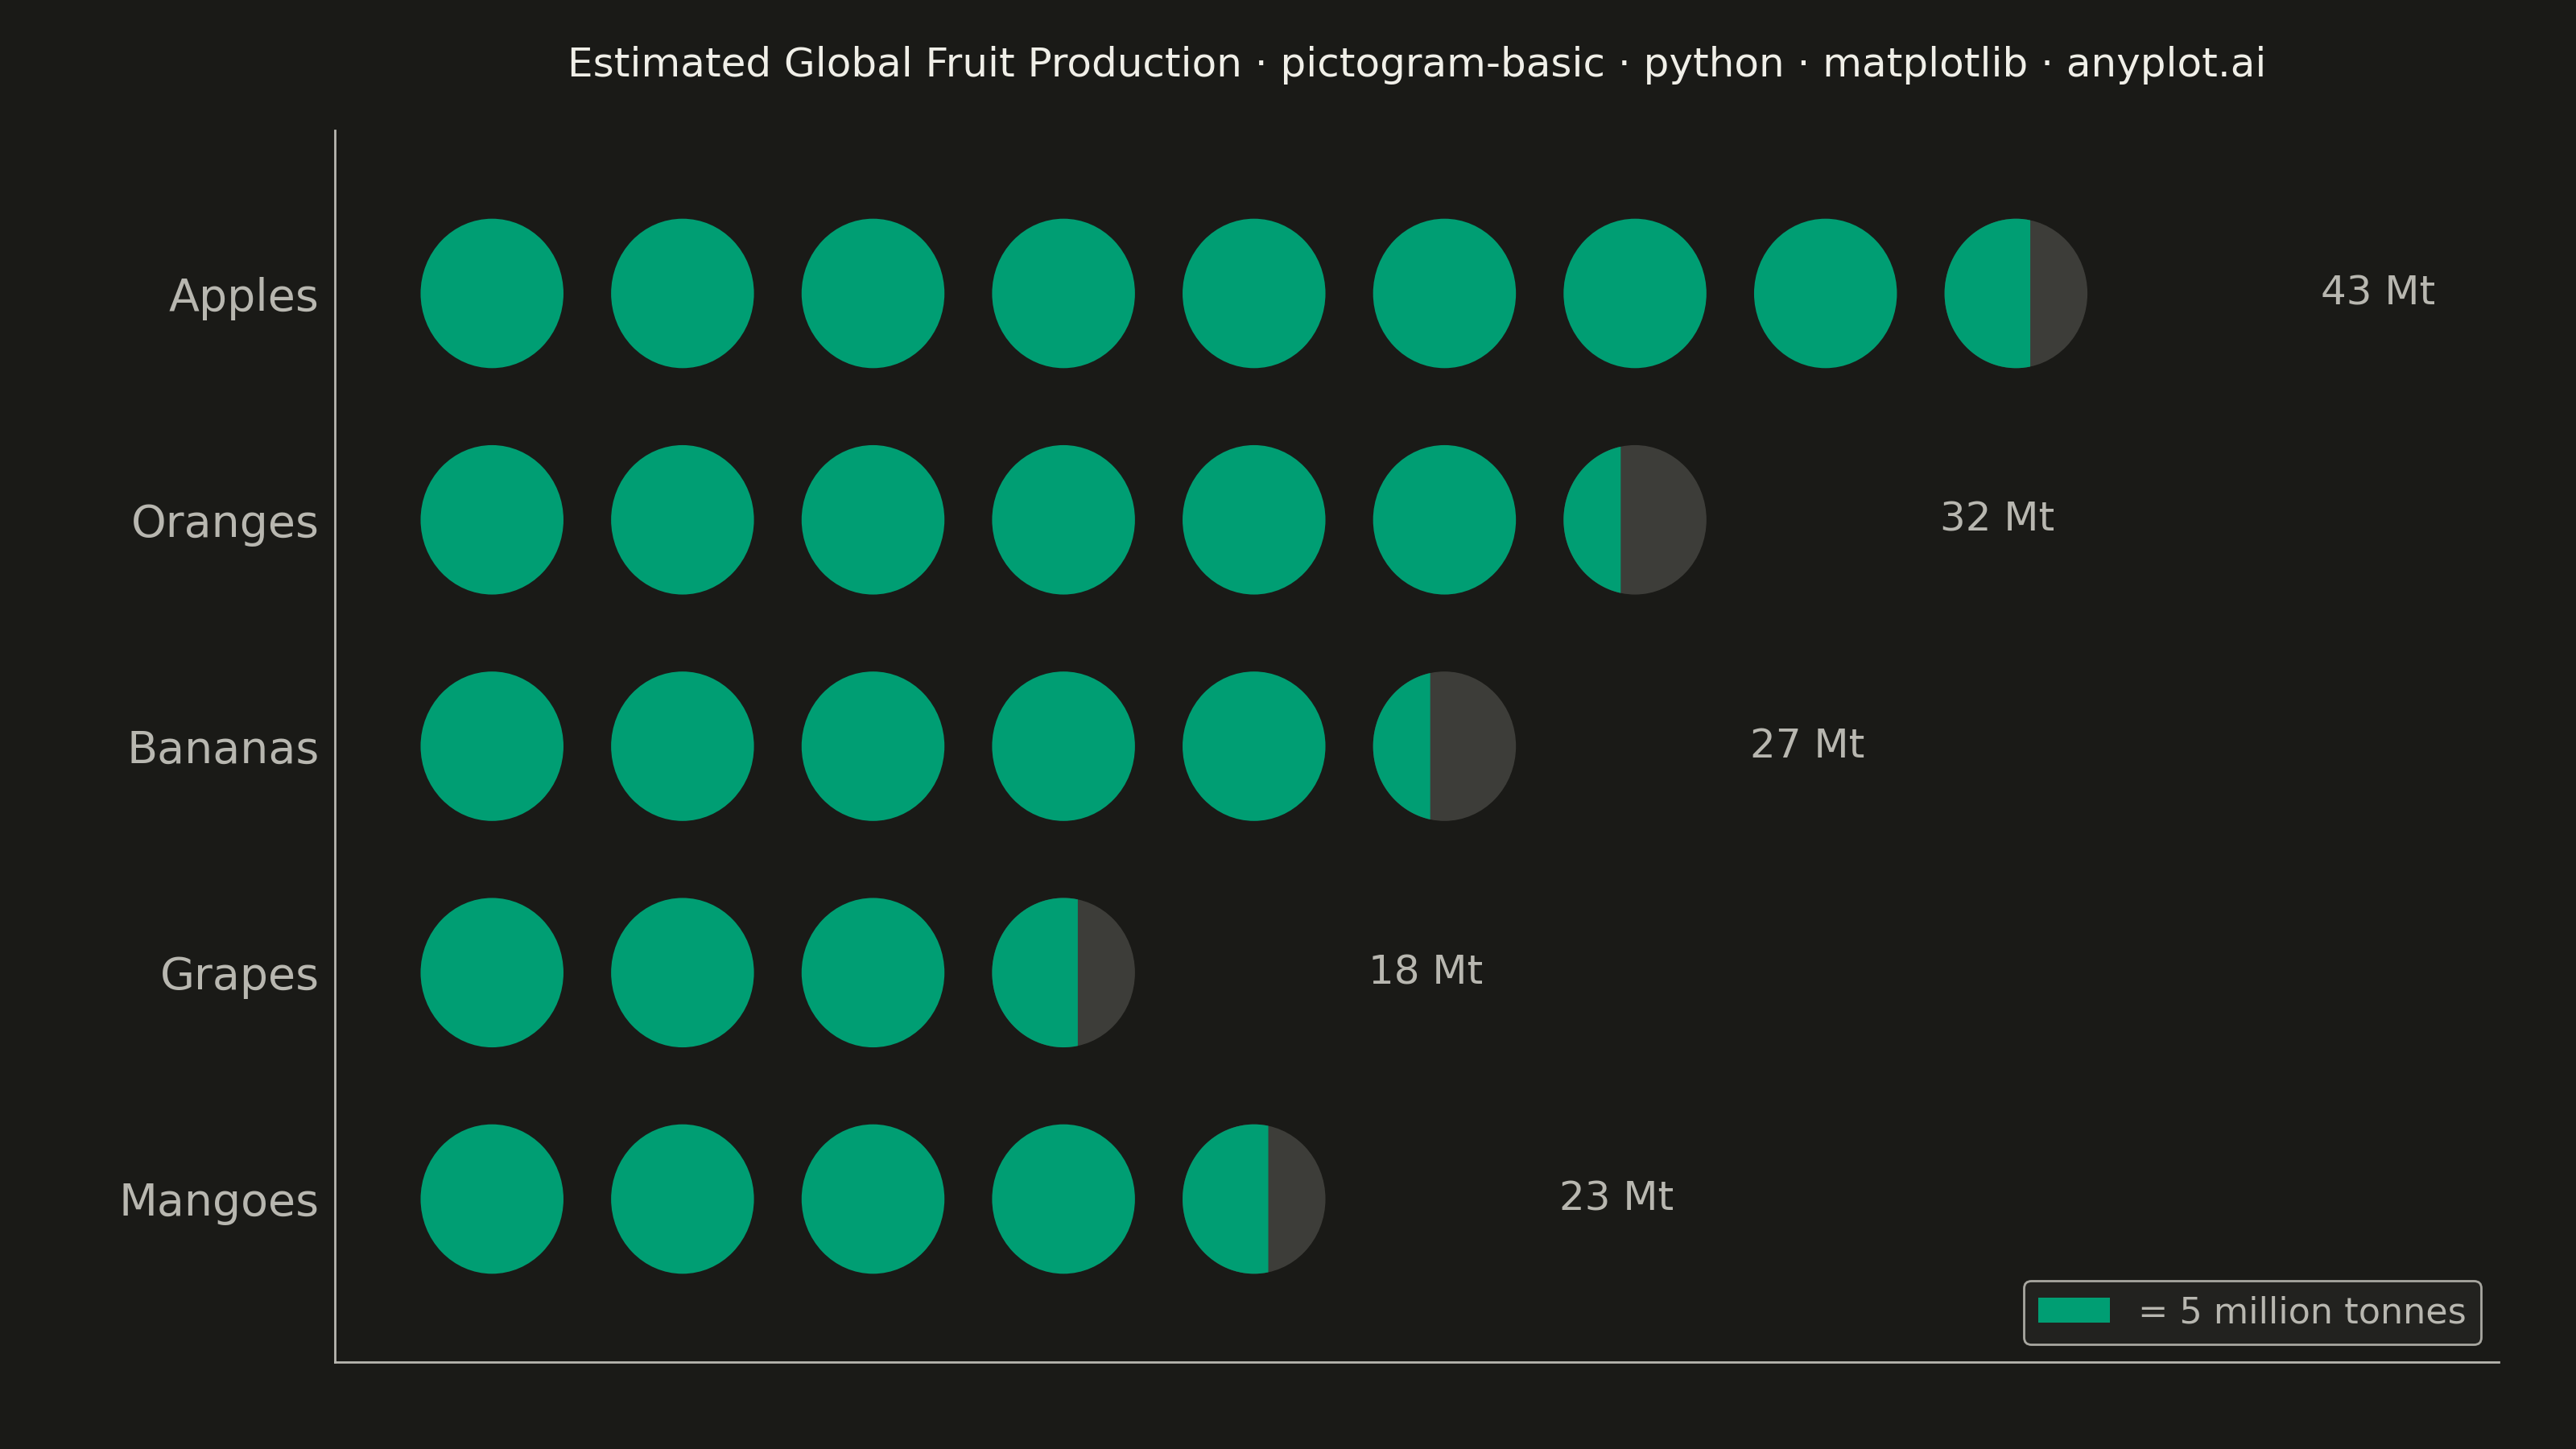
A pictogram chart represents quantities using repeated icons or symbols, where each icon stands for a fixed number of units. Inspired by Otto Neurath's ISOTYPE system, this visualization makes numerical comparisons more intuitive and engaging than plain bar charts. It is especially effective for public-facing data communication and infographics where visual appeal and immediate comprehension are important.
""" anyplot.ai
pictogram-basic: Pictogram Chart (Isotype Visualization)
Library: matplotlib 3.10.9 | Python 3.13.13
Quality: 88/100 | Created: 2026-06-03
"""

import os

import matplotlib.patches as mpatches
import matplotlib.pyplot as plt
import numpy as np
from matplotlib.patches import Polygon


# Theme tokens — Imprint palette chrome
THEME = os.getenv("ANYPLOT_THEME", "light")
PAGE_BG = "#FAF8F1" if THEME == "light" else "#1A1A17"
ELEVATED_BG = "#FFFDF6" if THEME == "light" else "#242420"
INK = "#1A1A17" if THEME == "light" else "#F0EFE8"
INK_SOFT = "#4A4A44" if THEME == "light" else "#B8B7B0"
INK_MUTED = "#6B6A63" if THEME == "light" else "#A8A79F"

BRAND = "#009E73"  # Imprint palette position 1 — always first series

# Data — estimated global fruit production (million tonnes), 1 icon = 5 Mt
categories = ["Apples", "Oranges", "Bananas", "Grapes", "Mangoes"]
values = [43, 32, 27, 18, 23]
icon_unit = 5

n_cats = len(categories)
full_icons = [v // icon_unit for v in values]
partials = [(v % icon_unit) / icon_unit for v in values]
max_icons = max(full_icons) + 1  # 9 (8 full + 1 partial for Apples)

# Layout parameters
icon_r = 0.33  # icon radius in data units
x_step = 0.88  # center-to-center horizontal spacing
y_rows = list(range(n_cats - 1, -1, -1))  # [4, 3, 2, 1, 0] top → bottom

# Figure
fig, ax = plt.subplots(figsize=(8, 4.5), dpi=400, facecolor=PAGE_BG)
ax.set_facecolor(PAGE_BG)

# Draw icons row by row
for row_idx, (n_full, frac) in enumerate(zip(full_icons, partials, strict=True)):
    y = y_rows[row_idx]

    # Full filled icons
    for i in range(n_full):
        ax.add_patch(
            mpatches.Circle(
                (i * x_step, y), icon_r, facecolor=BRAND, edgecolor="none", transform=ax.transData, zorder=3
            )
        )

    # Partial icon: muted background + left-filled arc polygon
    if frac > 0:
        x_p = n_full * x_step
        ax.add_patch(
            mpatches.Circle(
                (x_p, y), icon_r, facecolor=INK_MUTED, alpha=0.25, edgecolor="none", transform=ax.transData, zorder=2
            )
        )
        # Build a filled polygon for the left `frac` of the circle
        # The vertical chord is at x = x_p + icon_r*(2*frac - 1)
        theta_chord = np.arccos(np.clip(2 * frac - 1, -1.0, 1.0))
        n_arc = 64
        theta_arc = np.linspace(theta_chord, 2 * np.pi - theta_chord, n_arc)
        arc_verts = np.column_stack([x_p + icon_r * np.cos(theta_arc), y + icon_r * np.sin(theta_arc)])
        # Close with the vertical chord (last arc point back to first)
        poly_verts = np.vstack([arc_verts, arc_verts[[0]]])
        ax.add_patch(
            Polygon(poly_verts, closed=True, facecolor=BRAND, edgecolor="none", transform=ax.transData, zorder=3)
        )

    # Value annotation at row end
    x_end = (n_full + (1 if frac > 0 else 0)) * x_step + icon_r + 0.20
    ax.text(x_end, y, f"{values[row_idx]} Mt", fontsize=9, color=INK_SOFT, va="center", ha="left")

# Axes bounds
ax.set_xlim(-icon_r * 2.2, (max_icons - 1) * x_step + icon_r + 1.9)
ax.set_ylim(-0.72, n_cats - 0.28)

# Category labels on left axis
ax.set_yticks(y_rows)
ax.set_yticklabels(categories, fontsize=10, color=INK_SOFT)
ax.tick_params(axis="y", length=0, labelcolor=INK_SOFT)
ax.set_xticks([])

# Spine styling — L-frame (left + bottom) for row anchoring
ax.spines["top"].set_visible(False)
ax.spines["right"].set_visible(False)
ax.spines["bottom"].set_color(INK_SOFT)
ax.spines["bottom"].set_linewidth(0.5)
ax.spines["left"].set_color(INK_SOFT)
ax.spines["left"].set_linewidth(0.5)

# Title
title = "Estimated Global Fruit Production · pictogram-basic · python · matplotlib · anyplot.ai"
n_t = len(title)
title_fs = max(8, round(12 * 67 / n_t)) if n_t > 67 else 12
ax.set_title(title, fontsize=title_fs, fontweight="medium", color=INK, pad=12)

# Legend: unit key
leg = ax.legend(
    handles=[mpatches.Patch(facecolor=BRAND, label="= 5 million tonnes")],
    fontsize=8,
    loc="lower right",
    facecolor=ELEVATED_BG,
    edgecolor=INK_SOFT,
    framealpha=0.9,
)
leg.get_frame().set_linewidth(0.5)
plt.setp(leg.get_texts(), color=INK_SOFT)

fig.subplots_adjust(left=0.13, right=0.97, top=0.91, bottom=0.06)

plt.savefig(f"plot-{THEME}.png", dpi=400, facecolor=PAGE_BG)
plt.close()
Runnable source as JSON, for any HTTP client: https://api.anyplot.ai/specs/pictogram-basic/matplotlib/code. Any spec id and library id listed in llms-full.txt fit the same URL shape; every URL below is complete and callable.
{
  "spec_id": "pictogram-basic",
  "language": "python",
  "library": "matplotlib",
  "page": "https://anyplot.ai/pictogram-basic/python/matplotlib",
  "hub": "https://anyplot.ai/pictogram-basic",
  "code_json": "https://api.anyplot.ai/specs/pictogram-basic/matplotlib/code",
  "spec_json": "https://api.anyplot.ai/specs/pictogram-basic",
  "render_light_png": "https://storage.googleapis.com/anyplot-images/plots/pictogram-basic/python/matplotlib/plot-light.png",
  "render_dark_png": "https://storage.googleapis.com/anyplot-images/plots/pictogram-basic/python/matplotlib/plot-dark.png",
  "quality_score": 88.0,
  "license": "MIT",
  "guide": "https://anyplot.ai/llms.txt"
}
Part of Pictogram Chart (Isotype Visualization) on anyplot.ai.