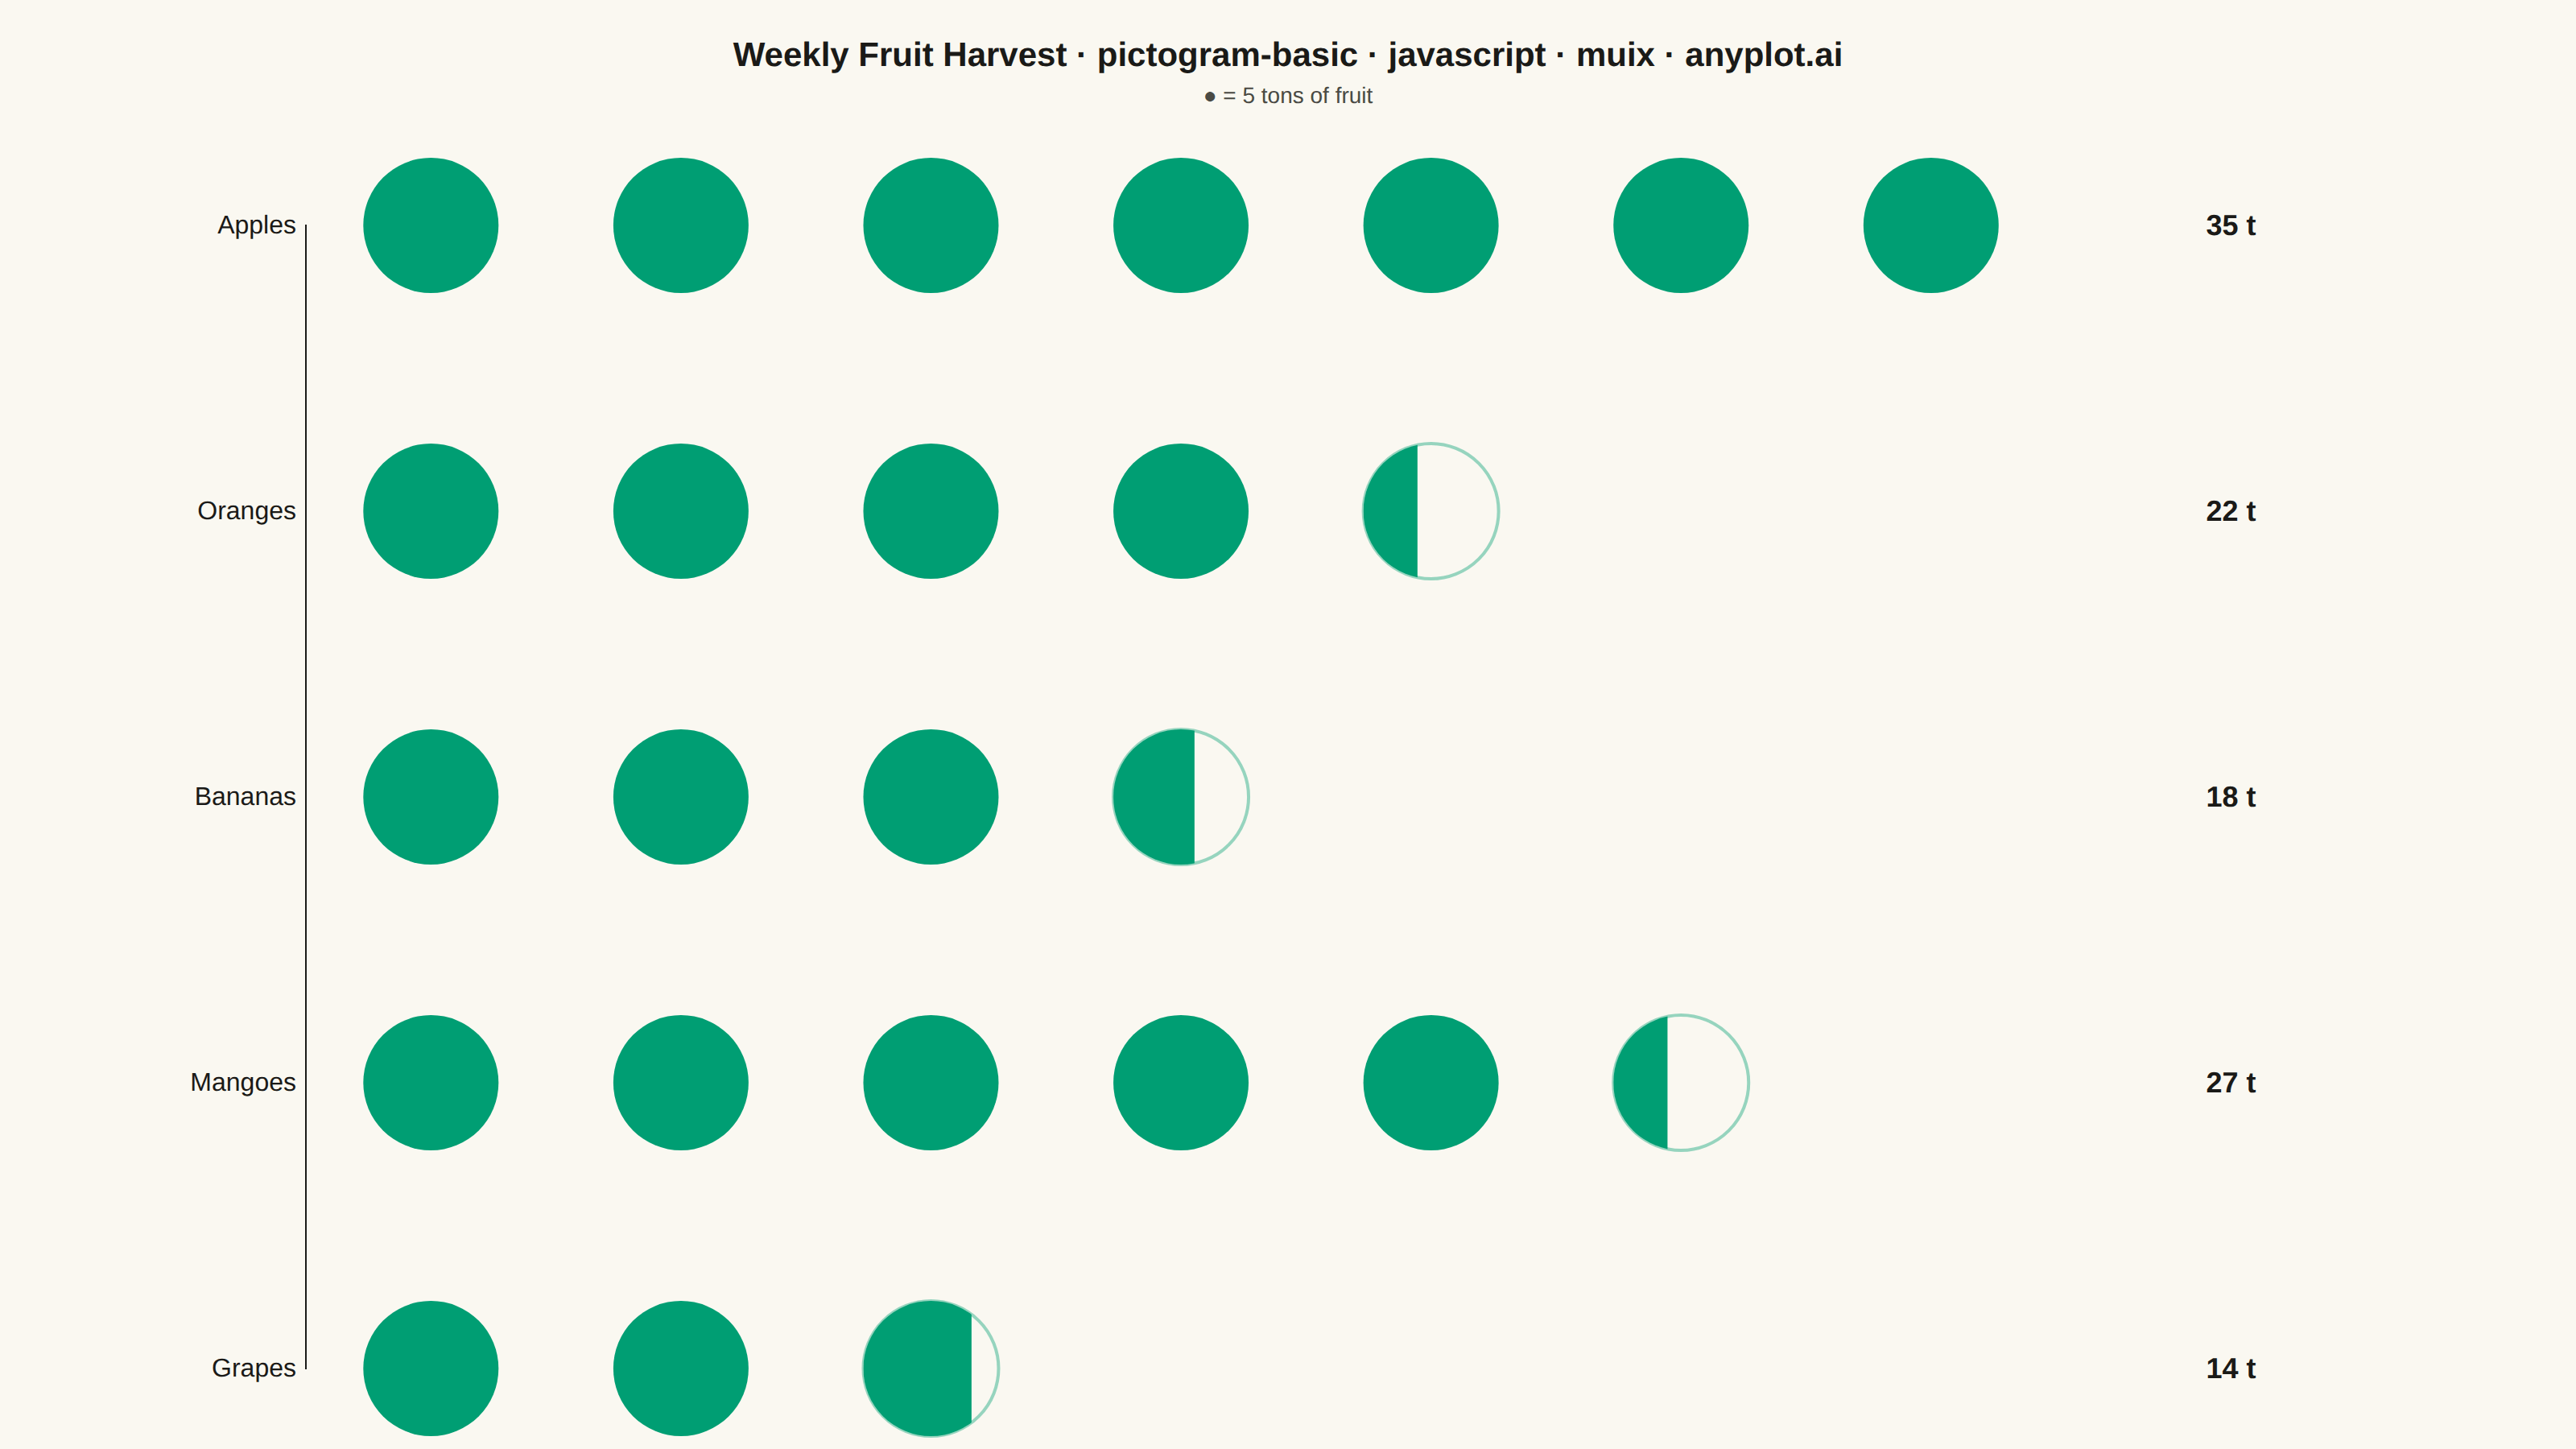
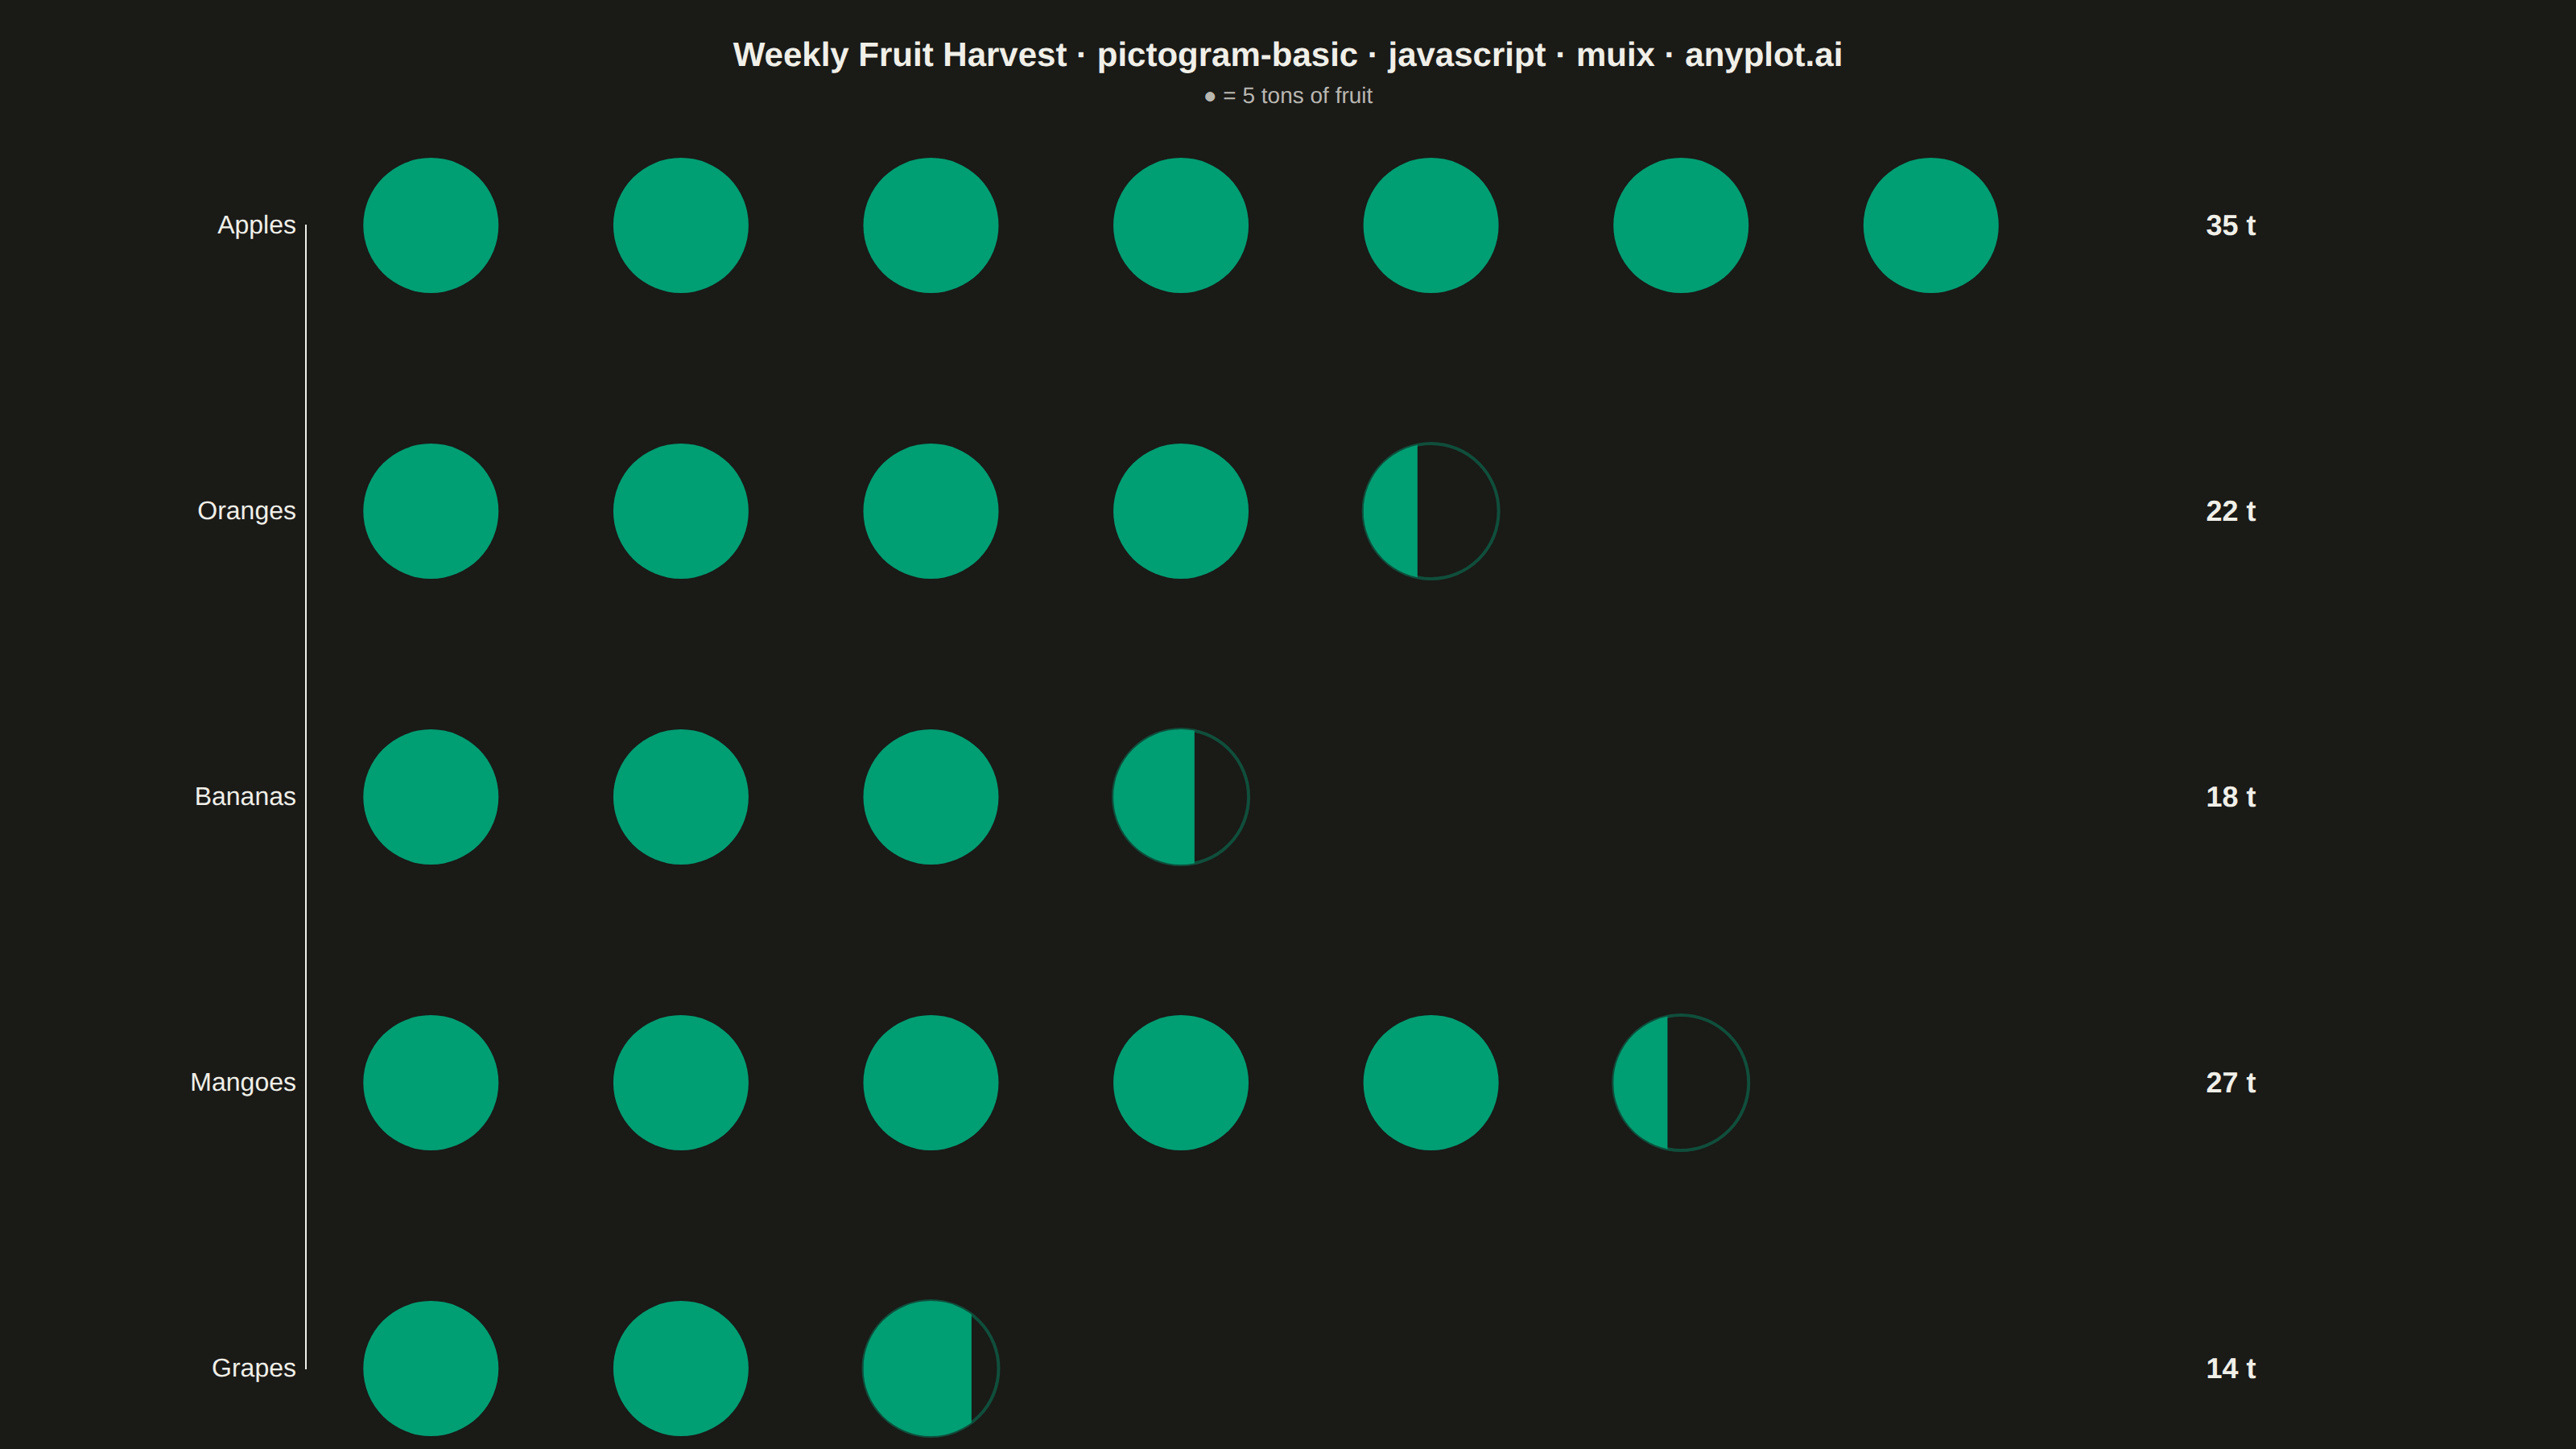
The same plot in 14 other libraries — JavaScript: Chart.js, D3.js, Apache ECharts, Highcharts; Python: Altair, Bokeh, lets-plot, Matplotlib, Plotly, plotnine, Pygal, Seaborn; R: ggplot2; Julia: Makie.jl. Compare all 15 side by side: Pictogram Chart (Isotype Visualization) in Python, R, Julia and JavaScript.
A pictogram chart represents quantities using repeated icons or symbols, where each icon stands for a fixed number of units. Inspired by Otto Neurath's ISOTYPE system, this visualization makes numerical comparisons more intuitive and engaging than plain bar charts. It is especially effective for public-facing data communication and infographics where visual appeal and immediate comprehension are important.
// anyplot.ai
// pictogram-basic: Pictogram Chart (Isotype Visualization)
// Library: muix 7.29.1 | JavaScript 22.23.2
// Quality: 91/100 | Created: 2026-08-20
//# anyplot-orientation: landscape
// anyplot.ai
// pictogram-basic: Pictogram Chart (Isotype Visualization)
// Library: MUI X Charts | React | Node 22
// License: @mui/x-charts — MIT (community). Pro/Premium are out of scope.
// Quality: pending | Created: 2026-08-20
import { ScatterChart } from "@mui/x-charts/ScatterChart";
import Box from "@mui/material/Box";
import Typography from "@mui/material/Typography";

const t = window.ANYPLOT_TOKENS;
const SIZE = window.ANYPLOT_SIZE;
const BRAND = t.palette[0];

// --- Data (in-memory, deterministic) ----------------------------------------
// Weekly harvest volume for a small farm co-op, in tons.
const categories = ["Apples", "Oranges", "Bananas", "Mangoes", "Grapes"];
const harvestTons = [35, 22, 18, 27, 14];
const tonsPerIcon = 5;

const iconCounts = harvestTons.map((tons) => tons / tonsPerIcon);
const maxIconCount = Math.max(...iconCounts);
const labelX = Math.ceil(maxIconCount) + 0.6;
const xMax = labelX + 0.9;

// One data point per full icon, plus one clipped point for the remainder,
// plus a trailing "label" point carrying the exact harvested tonnage.
const points = [];
categories.forEach((_, row) => {
  const count = iconCounts[row];
  const fullIcons = Math.floor(count + 1e-9);
  for (let i = 0; i < fullIcons; i += 1) {
    points.push({ id: `icon-${row}-${i}`, kind: "icon", x: i + 0.5, y: row, frac: 1 });
  }
  const remainder = count - fullIcons;
  if (remainder > 0.02) {
    points.push({ id: `icon-${row}-${fullIcons}`, kind: "icon", x: fullIcons + 0.5, y: row, frac: remainder });
  }
  points.push({ id: `label-${row}`, kind: "label", x: labelX, y: row, text: `${harvestTons[row]} t` });
});

const ICON_RADIUS = 42;

// Custom scatter renderer: draws each unit as a circle icon (fully filled,
// or clipped to its fractional remainder), plus the row's exact-value label —
// the pictogram encoding itself, using the real xScale/yScale MUI X computes.
function PictogramMarks({ series, xScale, yScale, color }) {
  return (
    <g>
      {series.data.map((d) => {
        const cx = xScale(d.x);
        const cy = yScale(d.y);
        if (d.kind === "label") {
          return (
            <text
              key={d.id}
              x={cx}
              y={cy}
              fill={t.ink}
              fontSize={18}
              fontWeight={600}
              textAnchor="start"
              dominantBaseline="central"
            >
              {d.text}
            </text>
          );
        }
        if (d.frac >= 1) {
          return <circle key={d.id} cx={cx} cy={cy} r={ICON_RADIUS} fill={color} />;
        }
        const clipId = `pictogram-clip-${d.id}`;
        return (
          <g key={d.id}>
            <circle cx={cx} cy={cy} r={ICON_RADIUS} fill="none" stroke={color} strokeWidth={2} strokeOpacity={0.4} />
            <clipPath id={clipId}>
              <rect x={cx - ICON_RADIUS} y={cy - ICON_RADIUS} width={2 * ICON_RADIUS * d.frac} height={2 * ICON_RADIUS} />
            </clipPath>
            <circle cx={cx} cy={cy} r={ICON_RADIUS} fill={color} clipPath={`url(#${clipId})`} />
          </g>
        );
      })}
    </g>
  );
}

const title = `Weekly Fruit Harvest · pictogram-basic · javascript · muix · anyplot.ai`;
const titleFontSize = title.length > 67 ? Math.round(22 * (67 / title.length)) : 22;

const HEADER_HEIGHT = 90;

// --- Chart (default-exported component — the harness mounts it) ------------
export default function Chart() {
  return (
    <Box
      sx={{
        width: SIZE.width,
        height: SIZE.height,
        display: "flex",
        flexDirection: "column",
        alignItems: "center",
        fontFamily: "Roboto, Helvetica, Arial, sans-serif",
      }}
    >
      <Box
        sx={{
          height: HEADER_HEIGHT,
          display: "flex",
          flexDirection: "column",
          justifyContent: "center",
          alignItems: "center",
        }}
      >
        <Typography sx={{ color: t.ink, fontSize: titleFontSize, fontWeight: 600, lineHeight: 1.2 }}>
          {title}
        </Typography>
        <Typography sx={{ color: t.inkSoft, fontSize: 14, lineHeight: 1.2, pt: 0.5 }}>
          ● = {tonsPerIcon} tons of fruit
        </Typography>
      </Box>
      <ScatterChart
        width={SIZE.width}
        height={SIZE.height - HEADER_HEIGHT}
        margin={{ top: 50, right: 90, bottom: 50, left: 190 }}
        colors={[BRAND]}
        disableVoronoi
        tooltip={{ trigger: "none" }}
        series={[{ id: "harvest", data: points }]}
        xAxis={[{ id: "icons", min: 0, max: xMax, scaleType: "linear" }]}
        yAxis={[
          {
            id: "categories",
            scaleType: "point",
            data: categories.map((_, i) => i),
            valueFormatter: (i) => categories[i],
            disableTicks: true,
            tickLabelStyle: { fontSize: 16 },
          },
        ]}
        bottomAxis={null}
        slots={{ scatter: PictogramMarks }}
      />
    </Box>
  );
}
Runnable source as JSON, for any HTTP client: https://api.anyplot.ai/specs/pictogram-basic/muix/code. Any spec id and library id listed in llms-full.txt fit the same URL shape; every URL below is complete and callable.
{
  "spec_id": "pictogram-basic",
  "language": "javascript",
  "library": "muix",
  "page": "https://anyplot.ai/pictogram-basic/javascript/muix",
  "hub": "https://anyplot.ai/pictogram-basic",
  "code_json": "https://api.anyplot.ai/specs/pictogram-basic/muix/code",
  "spec_json": "https://api.anyplot.ai/specs/pictogram-basic",
  "render_light_png": "https://storage.googleapis.com/anyplot-images/plots/pictogram-basic/javascript/muix/plot-light.png",
  "render_dark_png": "https://storage.googleapis.com/anyplot-images/plots/pictogram-basic/javascript/muix/plot-dark.png",
  "interactive_light_html": "https://storage.googleapis.com/anyplot-images/plots/pictogram-basic/javascript/muix/plot-light.html",
  "interactive_dark_html": "https://storage.googleapis.com/anyplot-images/plots/pictogram-basic/javascript/muix/plot-dark.html",
  "quality_score": 91.0,
  "license": "MIT",
  "guide": "https://anyplot.ai/llms.txt"
}
Part of Pictogram Chart (Isotype Visualization) on anyplot.ai.