The same plot in 14 other libraries — JavaScript: D3.js, Apache ECharts, Highcharts, MUI X Charts; Python: Altair, Bokeh, lets-plot, Matplotlib, Plotly, plotnine, Pygal, Seaborn; R: ggplot2; Julia: Makie.jl. Compare all 15 side by side: Pictogram Chart (Isotype Visualization) in Python, R, Julia and JavaScript.
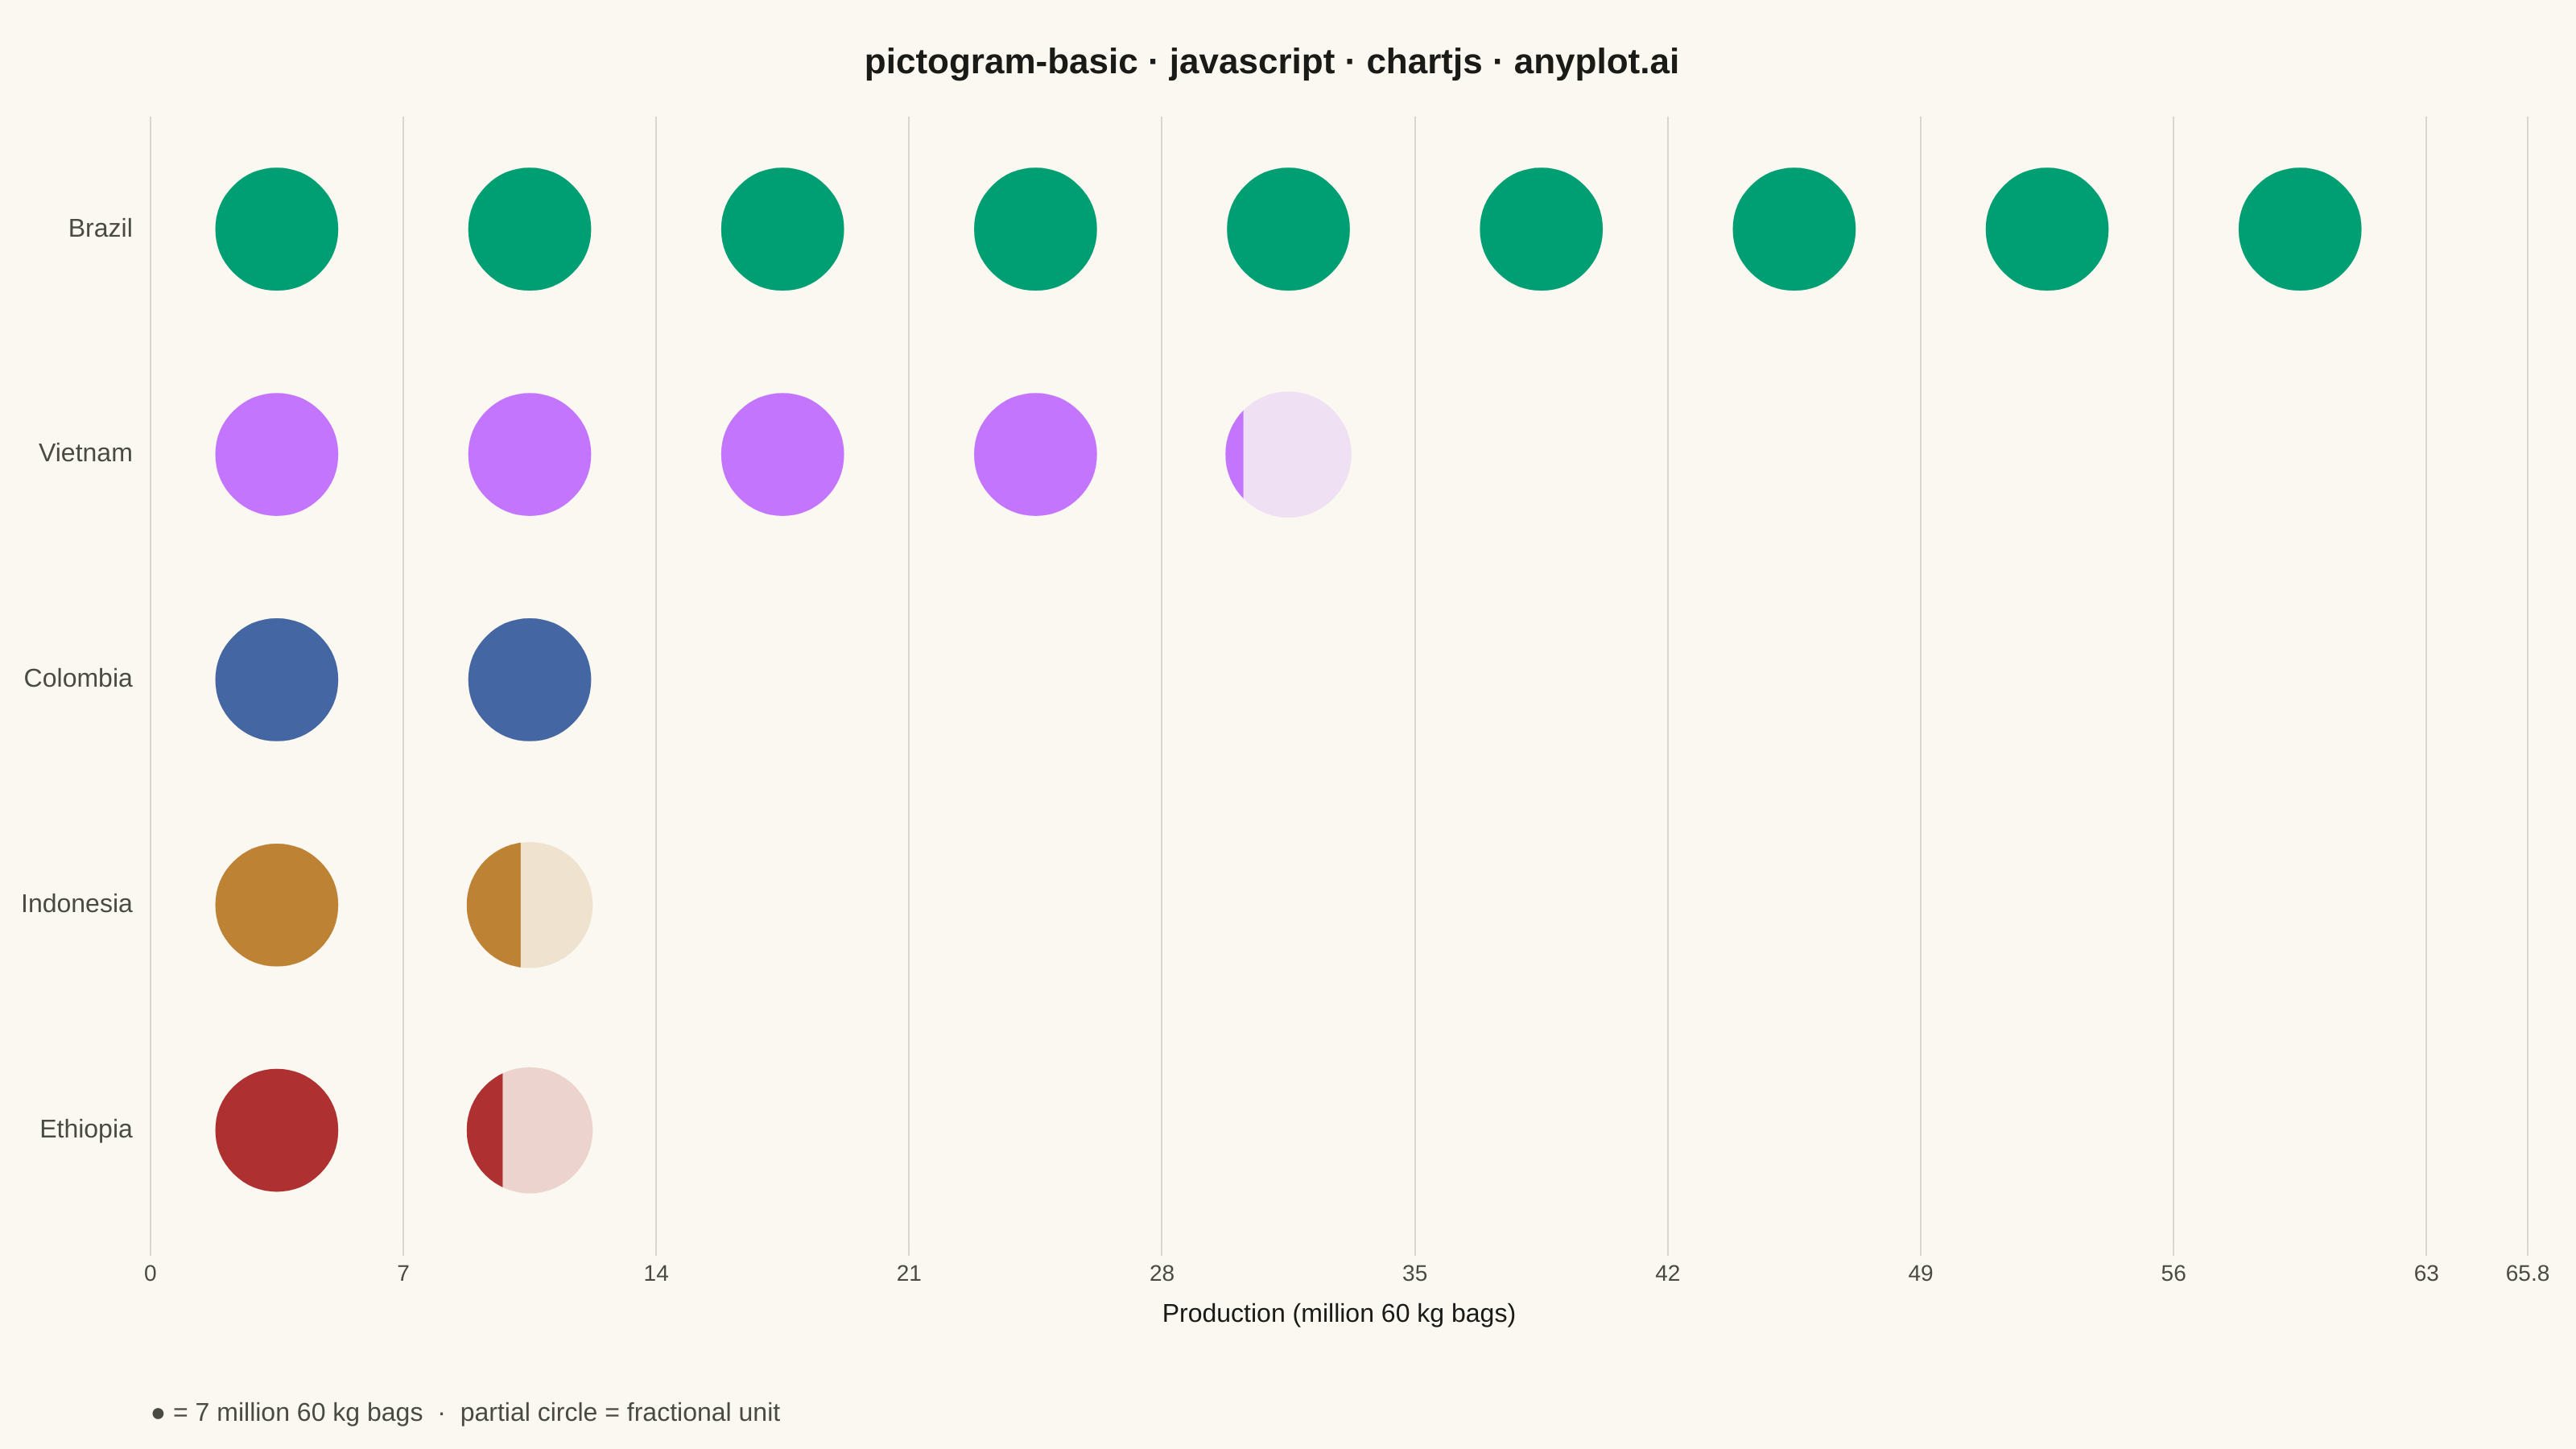
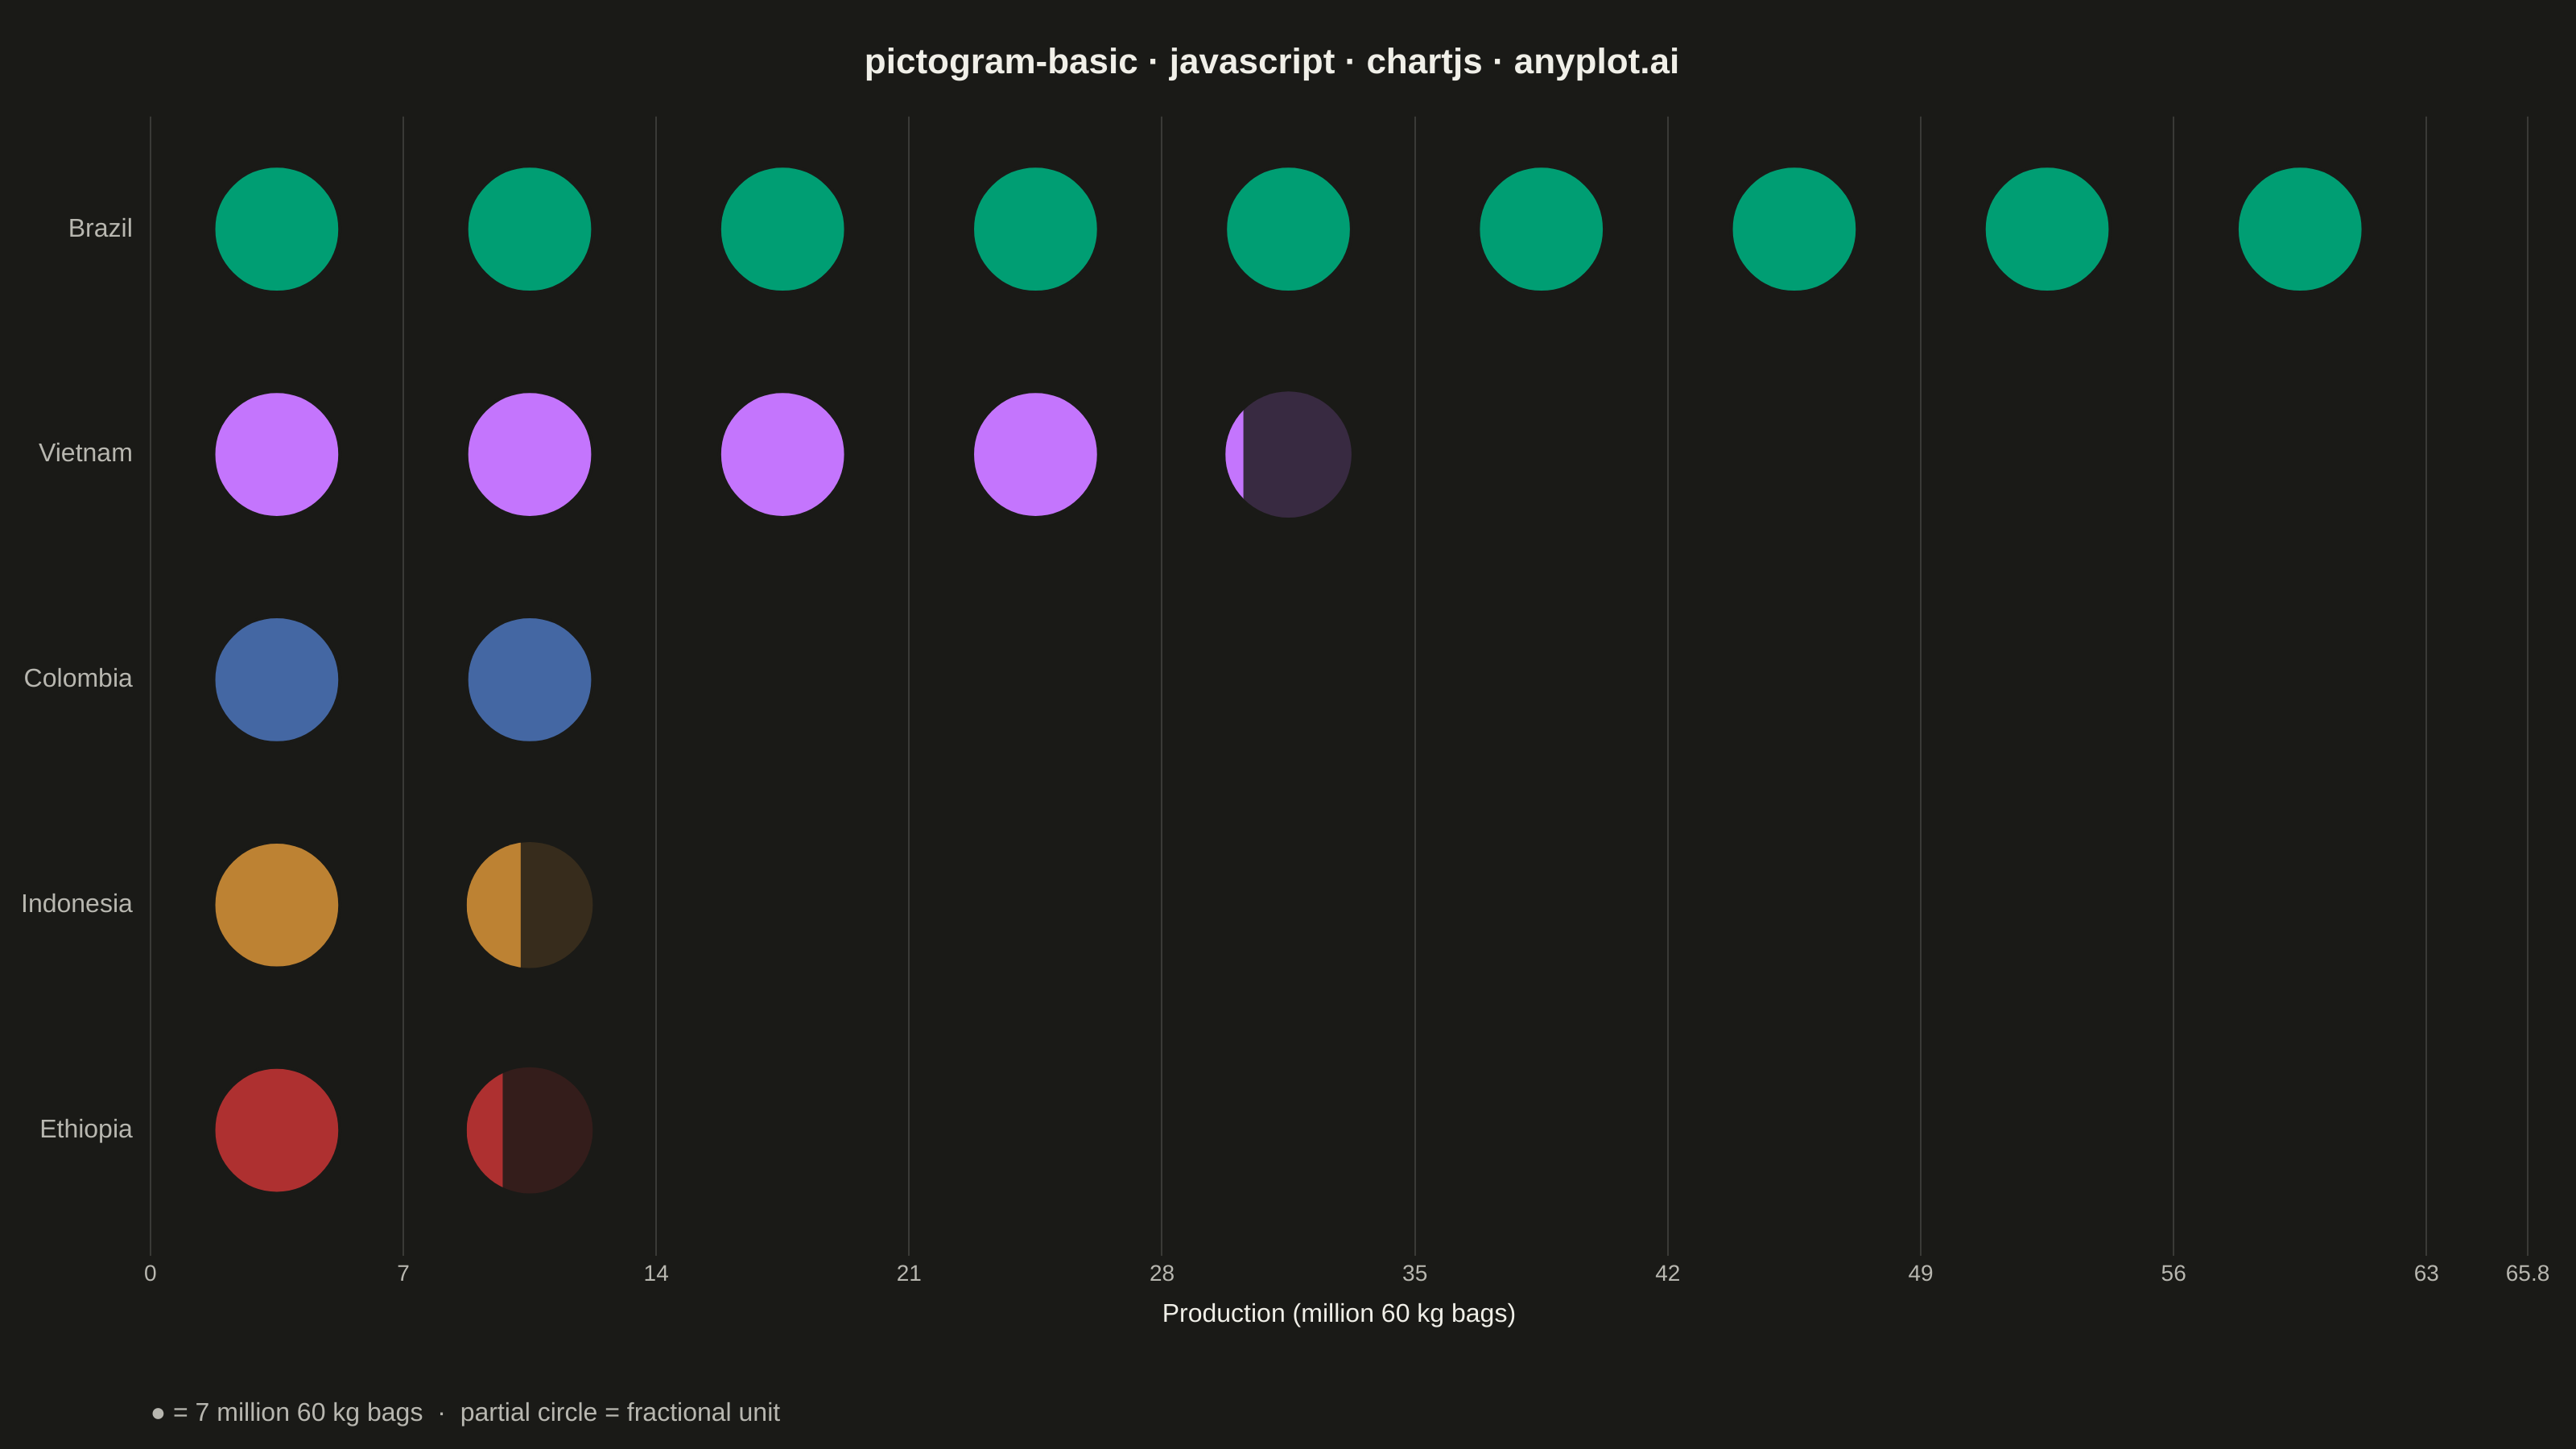
A pictogram chart represents quantities using repeated icons or symbols, where each icon stands for a fixed number of units. Inspired by Otto Neurath's ISOTYPE system, this visualization makes numerical comparisons more intuitive and engaging than plain bar charts. It is especially effective for public-facing data communication and infographics where visual appeal and immediate comprehension are important.
// anyplot.ai
// pictogram-basic: Pictogram Chart (Isotype Visualization)
// Library: chartjs 4.4.7 | JavaScript 22.22.3
// Quality: 89/100 | Created: 2026-06-03

//# anyplot-orientation: landscape

const t = window.ANYPLOT_TOKENS;

// Data: Top coffee-producing countries (million 60 kg bags per year, approx.)
const categories = ["Brazil", "Vietnam", "Colombia", "Indonesia", "Ethiopia"];
const values = [63, 29, 14, 10, 9];
const ICON_VALUE = 7; // one icon = 7 million 60 kg bags

const maxCols = Math.ceil(Math.max(...values) / ICON_VALUE);

// Mount
const canvas = document.createElement("canvas");
document.getElementById("container").appendChild(canvas);

// Draw a fully filled circle icon
function filledCircle(ctx, cx, cy, r, color) {
  ctx.beginPath();
  ctx.arc(cx, cy, r, 0, Math.PI * 2);
  ctx.fillStyle = color;
  ctx.fill();
}

// Draw a partially filled circle (left-to-right fill) with dim ghost behind it
function partialCircle(ctx, cx, cy, r, color, fraction) {
  ctx.save();
  ctx.globalAlpha = 0.18;
  filledCircle(ctx, cx, cy, r, color);
  ctx.restore();
  ctx.save();
  ctx.beginPath();
  ctx.rect(cx - r, cy - r - 1, r * 2 * fraction, r * 2 + 2);
  ctx.clip();
  filledCircle(ctx, cx, cy, r, color);
  ctx.restore();
}

// Fill entire canvas with the page background before Chart.js renders
const bgPlugin = {
  id: "bg",
  beforeDraw(chart) {
    const { ctx, width, height } = chart;
    ctx.save();
    ctx.fillStyle = t.pageBg;
    ctx.fillRect(0, 0, width, height);
    ctx.restore();
  },
};

// Draw pictogram icons and footnote after Chart.js axes are rendered
const pictogramPlugin = {
  id: "pictogram",
  afterDraw(chart) {
    const { ctx, scales, chartArea } = chart;
    const meta = chart.getDatasetMeta(0);
    const rowH = chartArea.height / categories.length;
    const unitPx = scales.x.getPixelForValue(ICON_VALUE) - scales.x.getPixelForValue(0);
    const r = Math.min(rowH * 0.28, unitPx * 0.38);

    categories.forEach((_, i) => {
      const cy = meta.data[i].y;
      const color = t.palette[i % t.palette.length];
      const full = Math.floor(values[i] / ICON_VALUE);
      const frac = (values[i] % ICON_VALUE) / ICON_VALUE;

      for (let j = 0; j < full; j++) {
        const cx = scales.x.getPixelForValue((j + 0.5) * ICON_VALUE);
        filledCircle(ctx, cx, cy, r, color);
        ctx.beginPath();
        ctx.arc(cx, cy, r, 0, Math.PI * 2);
        ctx.strokeStyle = t.pageBg;
        ctx.lineWidth = 2;
        ctx.stroke();
      }

      if (frac > 0.01) {
        const cx = scales.x.getPixelForValue((full + 0.5) * ICON_VALUE);
        partialCircle(ctx, cx, cy, r, color, frac);
      }
    });

    // Footnote explaining icon value and partial icons
    ctx.save();
    ctx.font = `16px sans-serif`;
    ctx.fillStyle = t.inkSoft;
    ctx.textAlign = "left";
    ctx.textBaseline = "bottom";
    ctx.fillText(
      "● = " + ICON_VALUE + " million 60 kg bags  ·  partial circle = fractional unit",
      chartArea.left,
      chart.height - 14
    );
    ctx.restore();
  },
};

new Chart(canvas, {
  type: "bar",
  plugins: [bgPlugin, pictogramPlugin],
  data: {
    labels: categories,
    datasets: [
      {
        data: values.map(() => 0),
        backgroundColor: "transparent",
        borderWidth: 0,
        hoverBackgroundColor: "transparent",
      },
    ],
  },
  options: {
    indexAxis: "y",
    responsive: true,
    maintainAspectRatio: false,
    animation: false,
    plugins: {
      title: {
        display: true,
        text: "pictogram-basic · javascript · chartjs · anyplot.ai",
        color: t.ink,
        font: { size: 22, weight: "bold" },
        padding: { top: 16, bottom: 20 },
      },
      legend: { display: false },
      tooltip: { enabled: false },
    },
    scales: {
      y: {
        ticks: { color: t.inkSoft, font: { size: 16 } },
        grid: { display: false },
        border: { display: false },
      },
      x: {
        min: 0,
        max: maxCols * ICON_VALUE + ICON_VALUE * 0.4,
        ticks: {
          color: t.inkSoft,
          font: { size: 14 },
          stepSize: ICON_VALUE,
        },
        grid: { color: t.grid },
        border: { display: false },
        title: {
          display: true,
          text: "Production (million 60 kg bags)",
          color: t.ink,
          font: { size: 16 },
        },
      },
    },
    layout: {
      padding: { top: 10, bottom: 70, left: 10, right: 30 },
    },
  },
});
Runnable source as JSON, for any HTTP client: https://api.anyplot.ai/specs/pictogram-basic/chartjs/code. Any spec id and library id listed in llms-full.txt fit the same URL shape; every URL below is complete and callable.
{
  "spec_id": "pictogram-basic",
  "language": "javascript",
  "library": "chartjs",
  "page": "https://anyplot.ai/pictogram-basic/javascript/chartjs",
  "hub": "https://anyplot.ai/pictogram-basic",
  "code_json": "https://api.anyplot.ai/specs/pictogram-basic/chartjs/code",
  "spec_json": "https://api.anyplot.ai/specs/pictogram-basic",
  "render_light_png": "https://storage.googleapis.com/anyplot-images/plots/pictogram-basic/javascript/chartjs/plot-light.png",
  "render_dark_png": "https://storage.googleapis.com/anyplot-images/plots/pictogram-basic/javascript/chartjs/plot-dark.png",
  "interactive_light_html": "https://storage.googleapis.com/anyplot-images/plots/pictogram-basic/javascript/chartjs/plot-light.html",
  "interactive_dark_html": "https://storage.googleapis.com/anyplot-images/plots/pictogram-basic/javascript/chartjs/plot-dark.html",
  "quality_score": 89.0,
  "license": "MIT",
  "guide": "https://anyplot.ai/llms.txt"
}
Part of Pictogram Chart (Isotype Visualization) on anyplot.ai.