The same plot in 14 other libraries — JavaScript: D3.js, Apache ECharts, Highcharts, MUI X Charts; Python: Altair, Bokeh, lets-plot, Matplotlib, Plotly, plotnine, Pygal, Seaborn; R: ggplot2; Julia: Makie.jl. Compare all 15 side by side: Basic Pie Chart in Python, R, Julia and JavaScript.
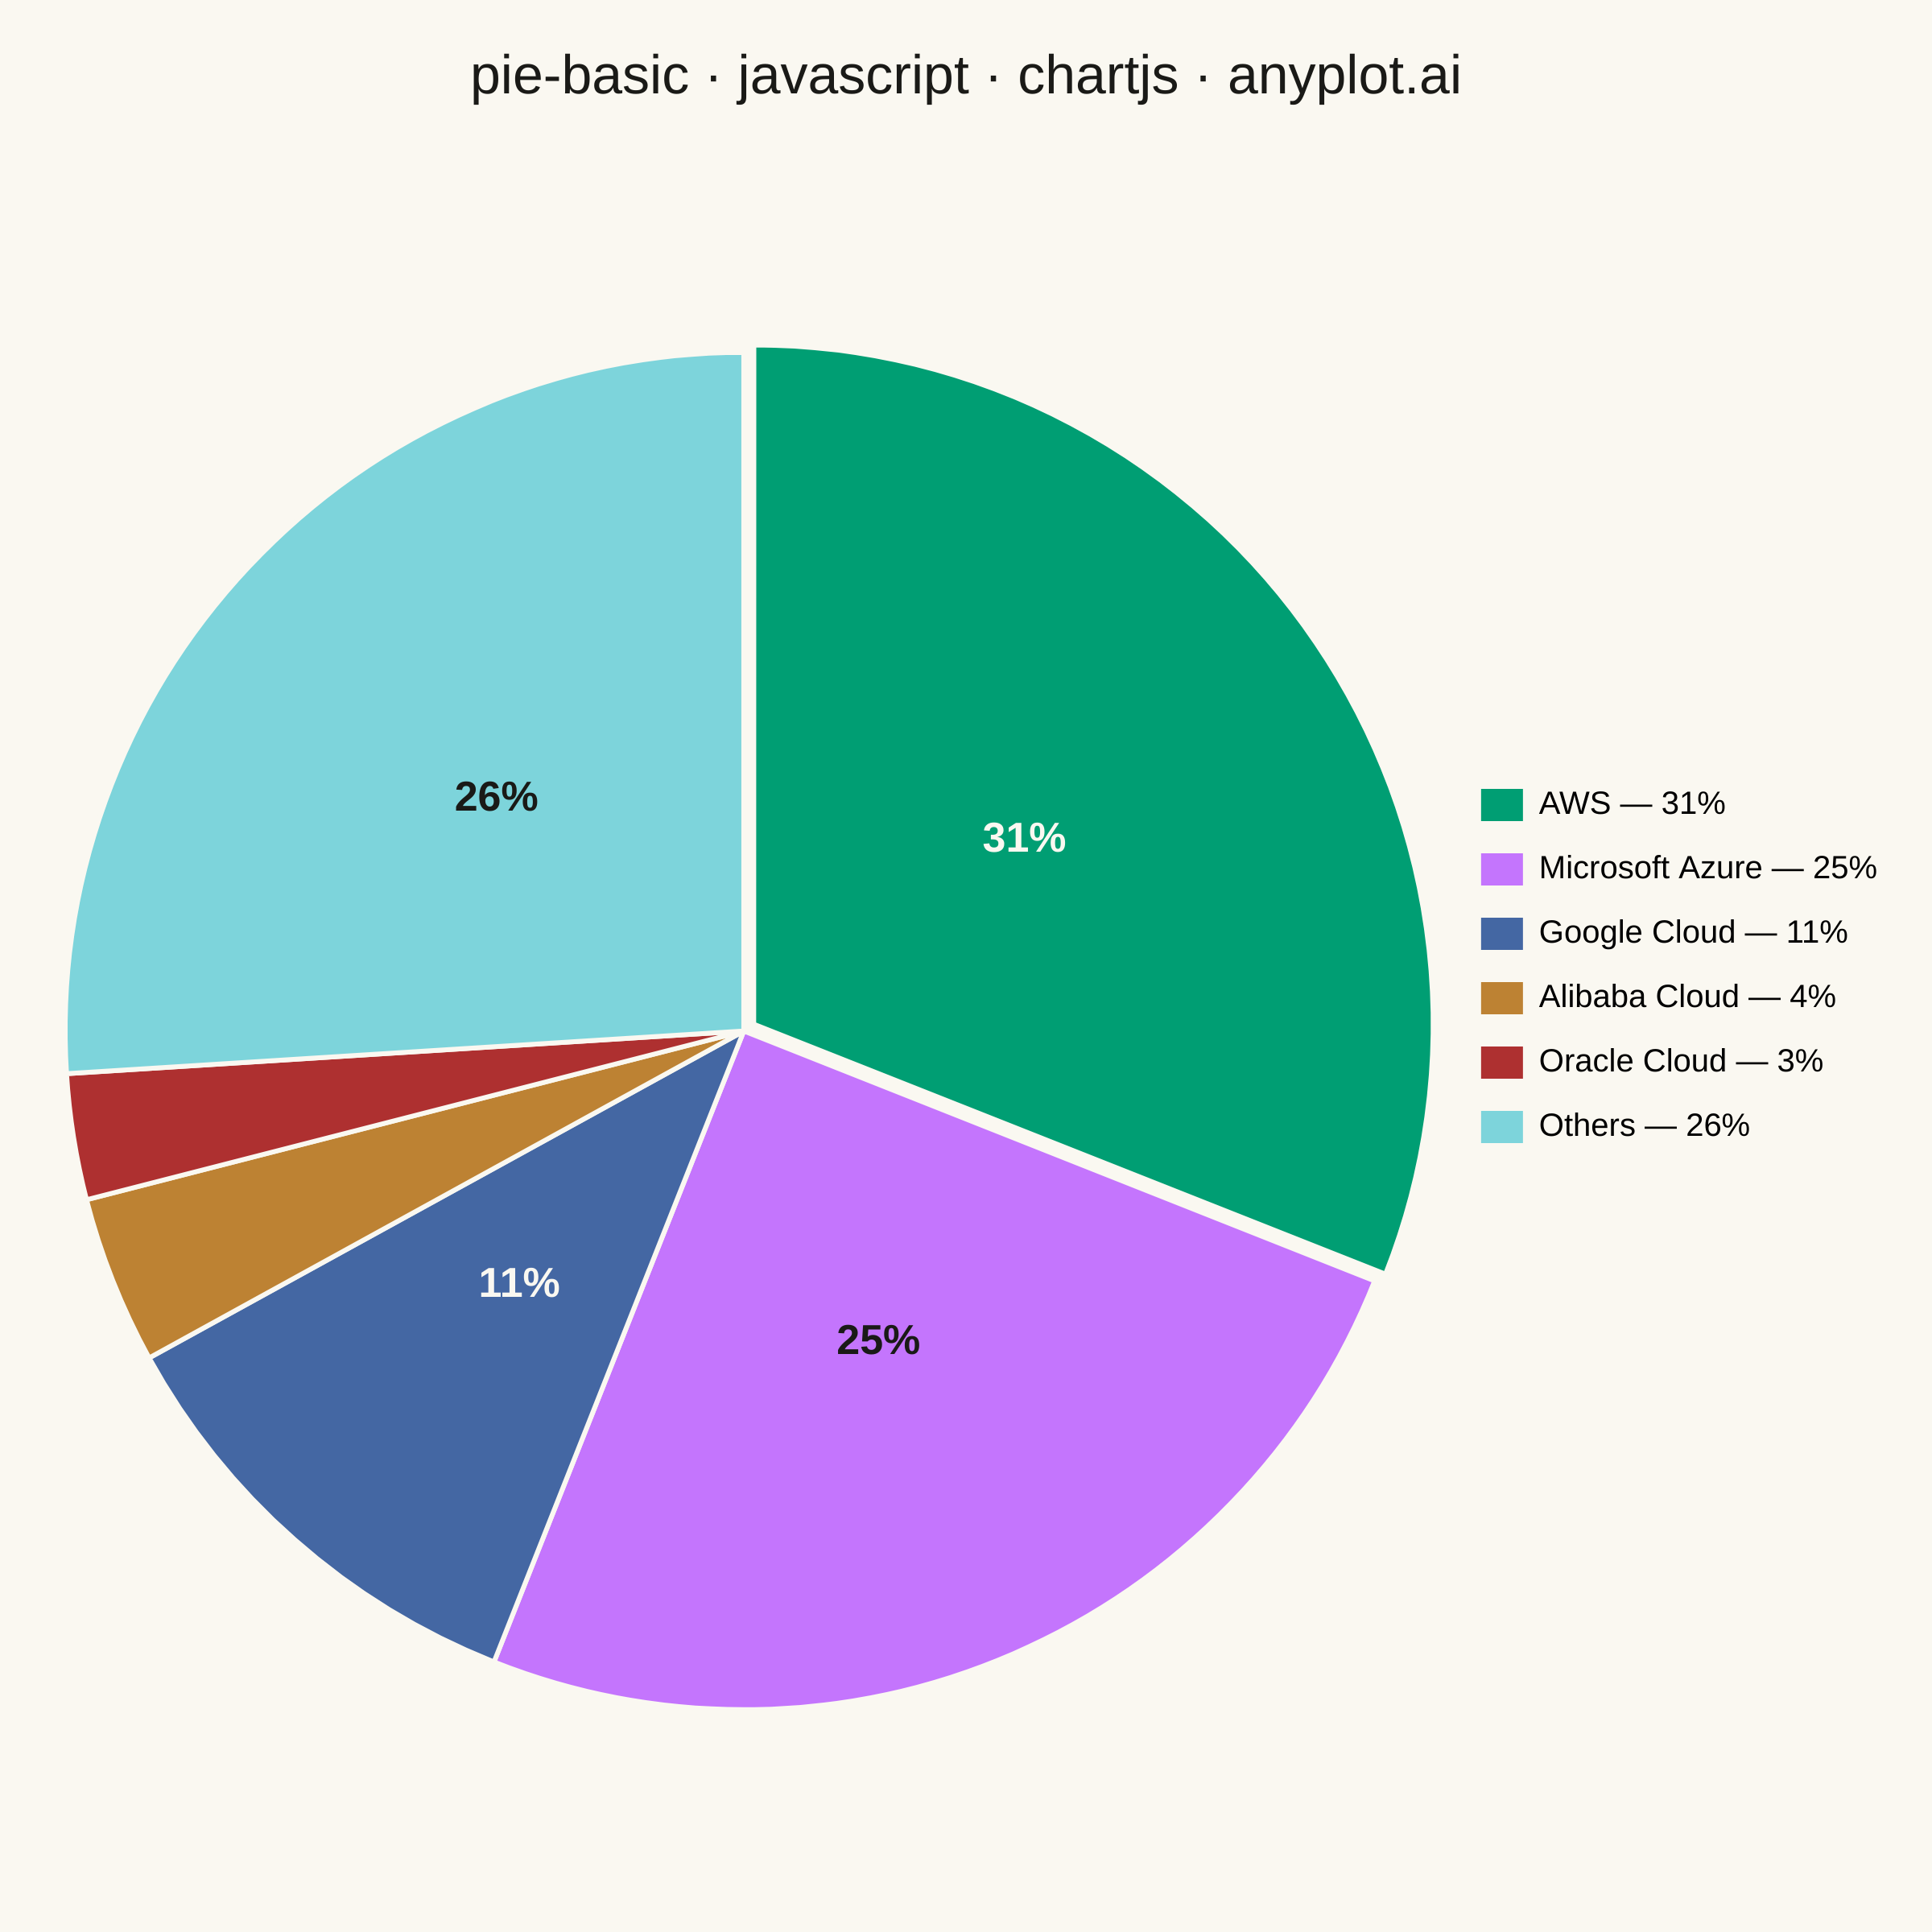
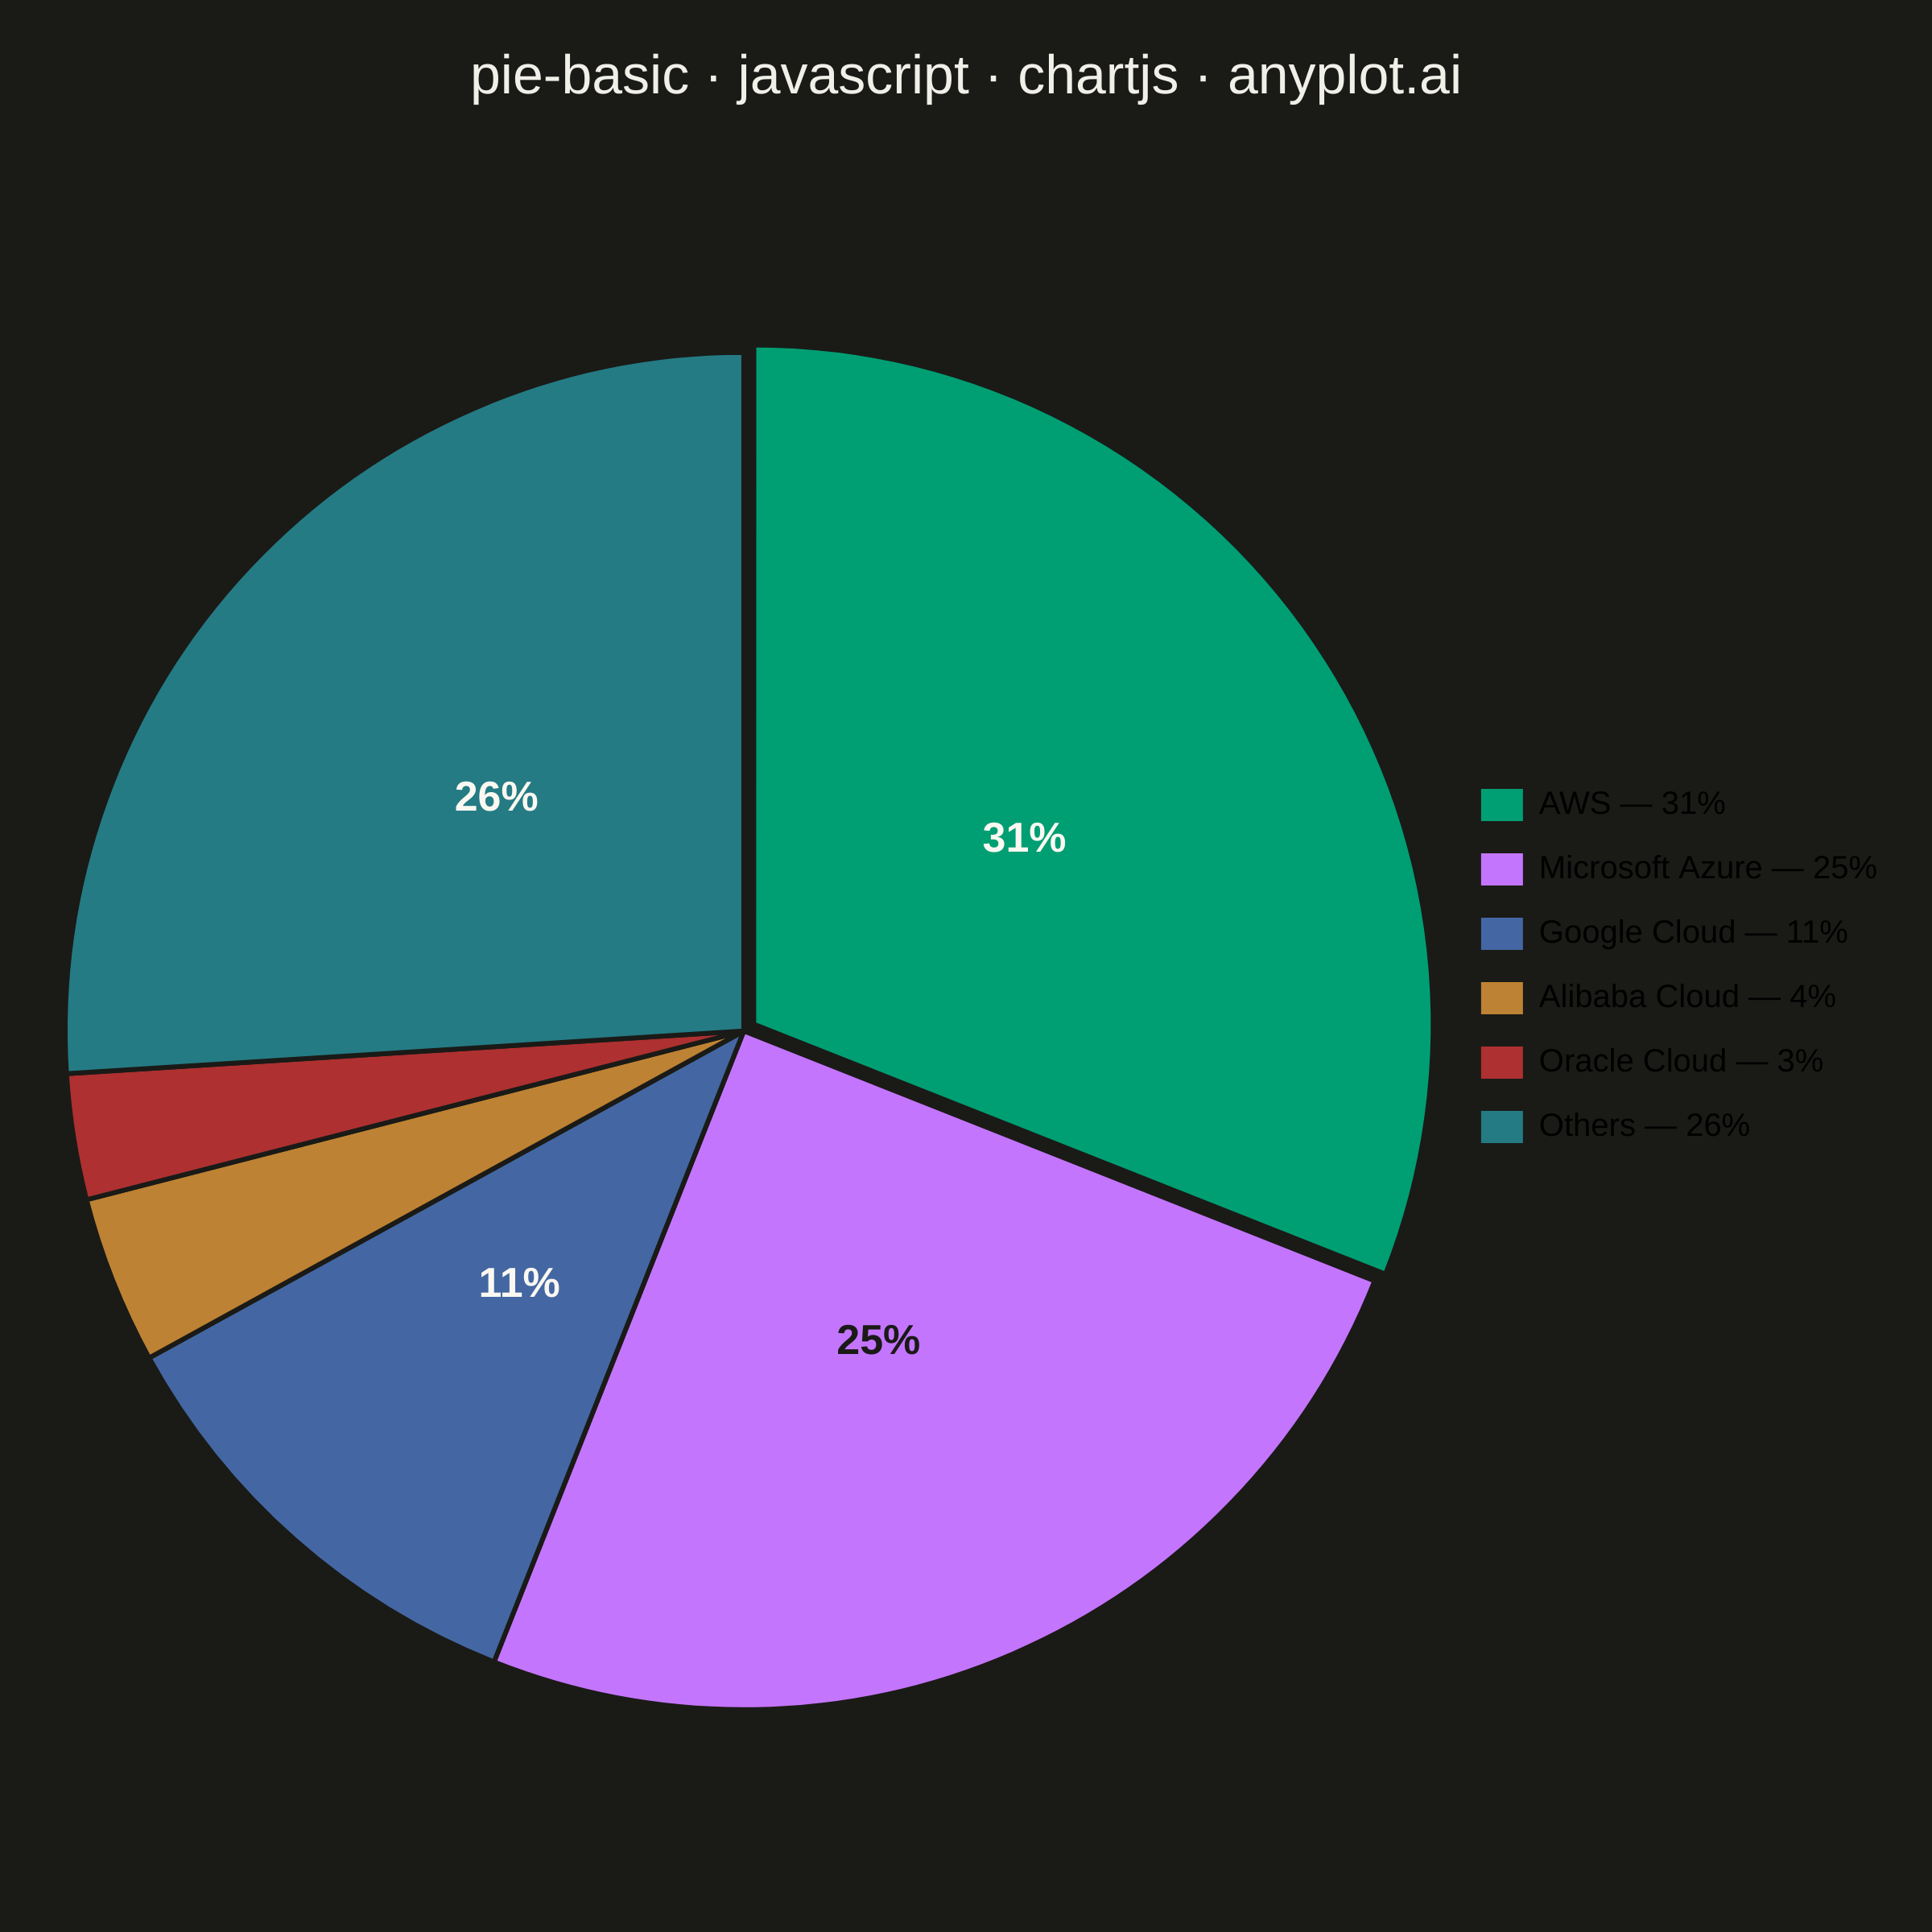
A pie chart showing proportions of categorical data as slices of a circle. Each slice represents a category's contribution to the whole, with the angle proportional to its value. Essential for visualizing parts-to-whole relationships in a simple, intuitive format.
// anyplot.ai
// pie-basic: Basic Pie Chart
// Library: chartjs 4.4.7 | JavaScript 22.22.3
// Quality: 88/100 | Created: 2026-06-02
//# anyplot-orientation: square

const t = window.ANYPLOT_TOKENS;

// Data — global cloud-infrastructure market share (illustrative 2025 figures).
// Real categories in descending share, "Others" pinned at the end as the
// catch-all bucket.
const labels = [
  "AWS",
  "Microsoft Azure",
  "Google Cloud",
  "Alibaba Cloud",
  "Oracle Cloud",
  "Others",
];
const shares = [31, 25, 11, 4, 3, 26];

// --- Color helpers ----------------------------------------------------------
const hexToRgb = (h) => [
  parseInt(h.slice(1, 3), 16),
  parseInt(h.slice(3, 5), 16),
  parseInt(h.slice(5, 7), 16),
];
const blendRgb = (hex, bgHex, w) => {
  const [r, g, b] = hexToRgb(hex);
  const [br, bg, bb] = hexToRgb(bgHex);
  return [
    Math.round(r * w + br * (1 - w)),
    Math.round(g * w + bg * (1 - w)),
    Math.round(b * w + bb * (1 - w)),
  ];
};
const relLuminance = ([r, g, b]) => {
  const norm = [r, g, b].map((c) => {
    const s = c / 255;
    return s <= 0.03928 ? s / 12.92 : Math.pow((s + 0.055) / 1.055, 2.4);
  });
  return 0.2126 * norm[0] + 0.7152 * norm[1] + 0.0722 * norm[2];
};

// Imprint palette positions 1→6 — first slice (the AWS leader) is brand green.
// The "Others" bucket is blended 60% toward the page background so it reads as
// "rest", letting the named categories carry the narrative.
const sliceRgb = shares.map((_, i) => {
  const hex = t.palette[i % t.palette.length];
  return labels[i] === "Others" ? blendRgb(hex, t.pageBg, 0.6) : hexToRgb(hex);
});
const sliceColors = sliceRgb.map(([r, g, b]) => `rgb(${r}, ${g}, ${b})`);

// Per-slice label color: white on dark wedges, dark ink on light wedges.
// Threshold 0.3 routes lavender + cyan (and the bg-blended Others in light
// theme) to dark ink — the borderline white-on-light-slice contrast called out
// in the previous review.
const labelColors = sliceRgb.map((rgb) =>
  relLuminance(rgb) > 0.3 ? "#1A1A17" : "#FAF8F1",
);

// Spec invites a slight explode on the largest (or smallest) slice. Pulling
// the leader out by a constant pixel offset draws the eye without distorting
// angle.
const maxIdx = shares.indexOf(Math.max(...shares));
const sliceOffsets = shares.map((_, i) => (i === maxIdx ? 30 : 0));

const total = shares.reduce((a, b) => a + b, 0);

// Custom plugin — percent label at each slice's geometric midpoint. Slivers
// (< 5%) defer to the legend, which spells out the percentage anyway, so the
// narrow 3% / 4% wedges don't have to crowd their own digits.
const percentLabels = {
  id: "percentLabels",
  afterDatasetsDraw(chart) {
    const { ctx } = chart;
    const meta = chart.getDatasetMeta(0);
    ctx.save();
    ctx.textAlign = "center";
    ctx.textBaseline = "middle";
    ctx.font =
      '600 26px -apple-system, BlinkMacSystemFont, "Segoe UI", Roboto, Helvetica, Arial, sans-serif';
    meta.data.forEach((arc, i) => {
      const pct = (shares[i] / total) * 100;
      if (pct < 5) return;
      const mid = (arc.startAngle + arc.endAngle) / 2;
      const r = (arc.innerRadius + arc.outerRadius) / 2;
      const x = arc.x + Math.cos(mid) * r;
      const y = arc.y + Math.sin(mid) * r;
      ctx.fillStyle = labelColors[i];
      ctx.fillText(`${pct.toFixed(0)}%`, x, y);
    });
    ctx.restore();
  },
};

// Mount
const canvas = document.createElement("canvas");
document.getElementById("container").appendChild(canvas);

new Chart(canvas, {
  type: "pie",
  data: {
    labels,
    datasets: [
      {
        label: "Market share",
        data: shares,
        backgroundColor: sliceColors,
        borderColor: t.pageBg,
        borderWidth: 3,
        offset: sliceOffsets,
        hoverOffset: 14,
      },
    ],
  },
  options: {
    responsive: true,
    maintainAspectRatio: false,
    animation: false,
    layout: { padding: { top: 24, right: 24, bottom: 24, left: 24 } },
    plugins: {
      title: {
        display: true,
        text: "pie-basic · javascript · chartjs · anyplot.ai",
        color: t.ink,
        font: { size: 34, weight: "500" },
        padding: { top: 4, bottom: 36 },
      },
      legend: {
        position: "right",
        align: "center",
        labels: {
          color: t.ink,
          font: { size: 20 },
          boxWidth: 26,
          boxHeight: 20,
          padding: 20,
          generateLabels: (chart) => {
            const data = chart.data;
            const arr = data.datasets[0].data;
            return data.labels.map((label, i) => ({
              text: `${label} — ${arr[i]}%`,
              fillStyle: data.datasets[0].backgroundColor[i],
              strokeStyle: data.datasets[0].backgroundColor[i],
              lineWidth: 0,
              index: i,
            }));
          },
        },
      },
      tooltip: {
        backgroundColor: t.elevatedBg,
        titleColor: t.ink,
        bodyColor: t.inkSoft,
        borderColor: t.grid,
        borderWidth: 1,
        padding: 12,
        titleFont: { size: 14, weight: "600" },
        bodyFont: { size: 13 },
        displayColors: false,
        callbacks: {
          label: (ctx) => `${ctx.parsed}% of global spend`,
        },
      },
    },
  },
  plugins: [percentLabels],
});
Runnable source as JSON, for any HTTP client: https://api.anyplot.ai/specs/pie-basic/chartjs/code. Any spec id and library id listed in llms-full.txt fit the same URL shape; every URL below is complete and callable.
{
  "spec_id": "pie-basic",
  "language": "javascript",
  "library": "chartjs",
  "page": "https://anyplot.ai/pie-basic/javascript/chartjs",
  "hub": "https://anyplot.ai/pie-basic",
  "code_json": "https://api.anyplot.ai/specs/pie-basic/chartjs/code",
  "spec_json": "https://api.anyplot.ai/specs/pie-basic",
  "render_light_png": "https://storage.googleapis.com/anyplot-images/plots/pie-basic/javascript/chartjs/plot-light.png",
  "render_dark_png": "https://storage.googleapis.com/anyplot-images/plots/pie-basic/javascript/chartjs/plot-dark.png",
  "interactive_light_html": "https://storage.googleapis.com/anyplot-images/plots/pie-basic/javascript/chartjs/plot-light.html",
  "interactive_dark_html": "https://storage.googleapis.com/anyplot-images/plots/pie-basic/javascript/chartjs/plot-dark.html",
  "quality_score": 88.0,
  "license": "MIT",
  "guide": "https://anyplot.ai/llms.txt"
}
Part of Basic Pie Chart on anyplot.ai.