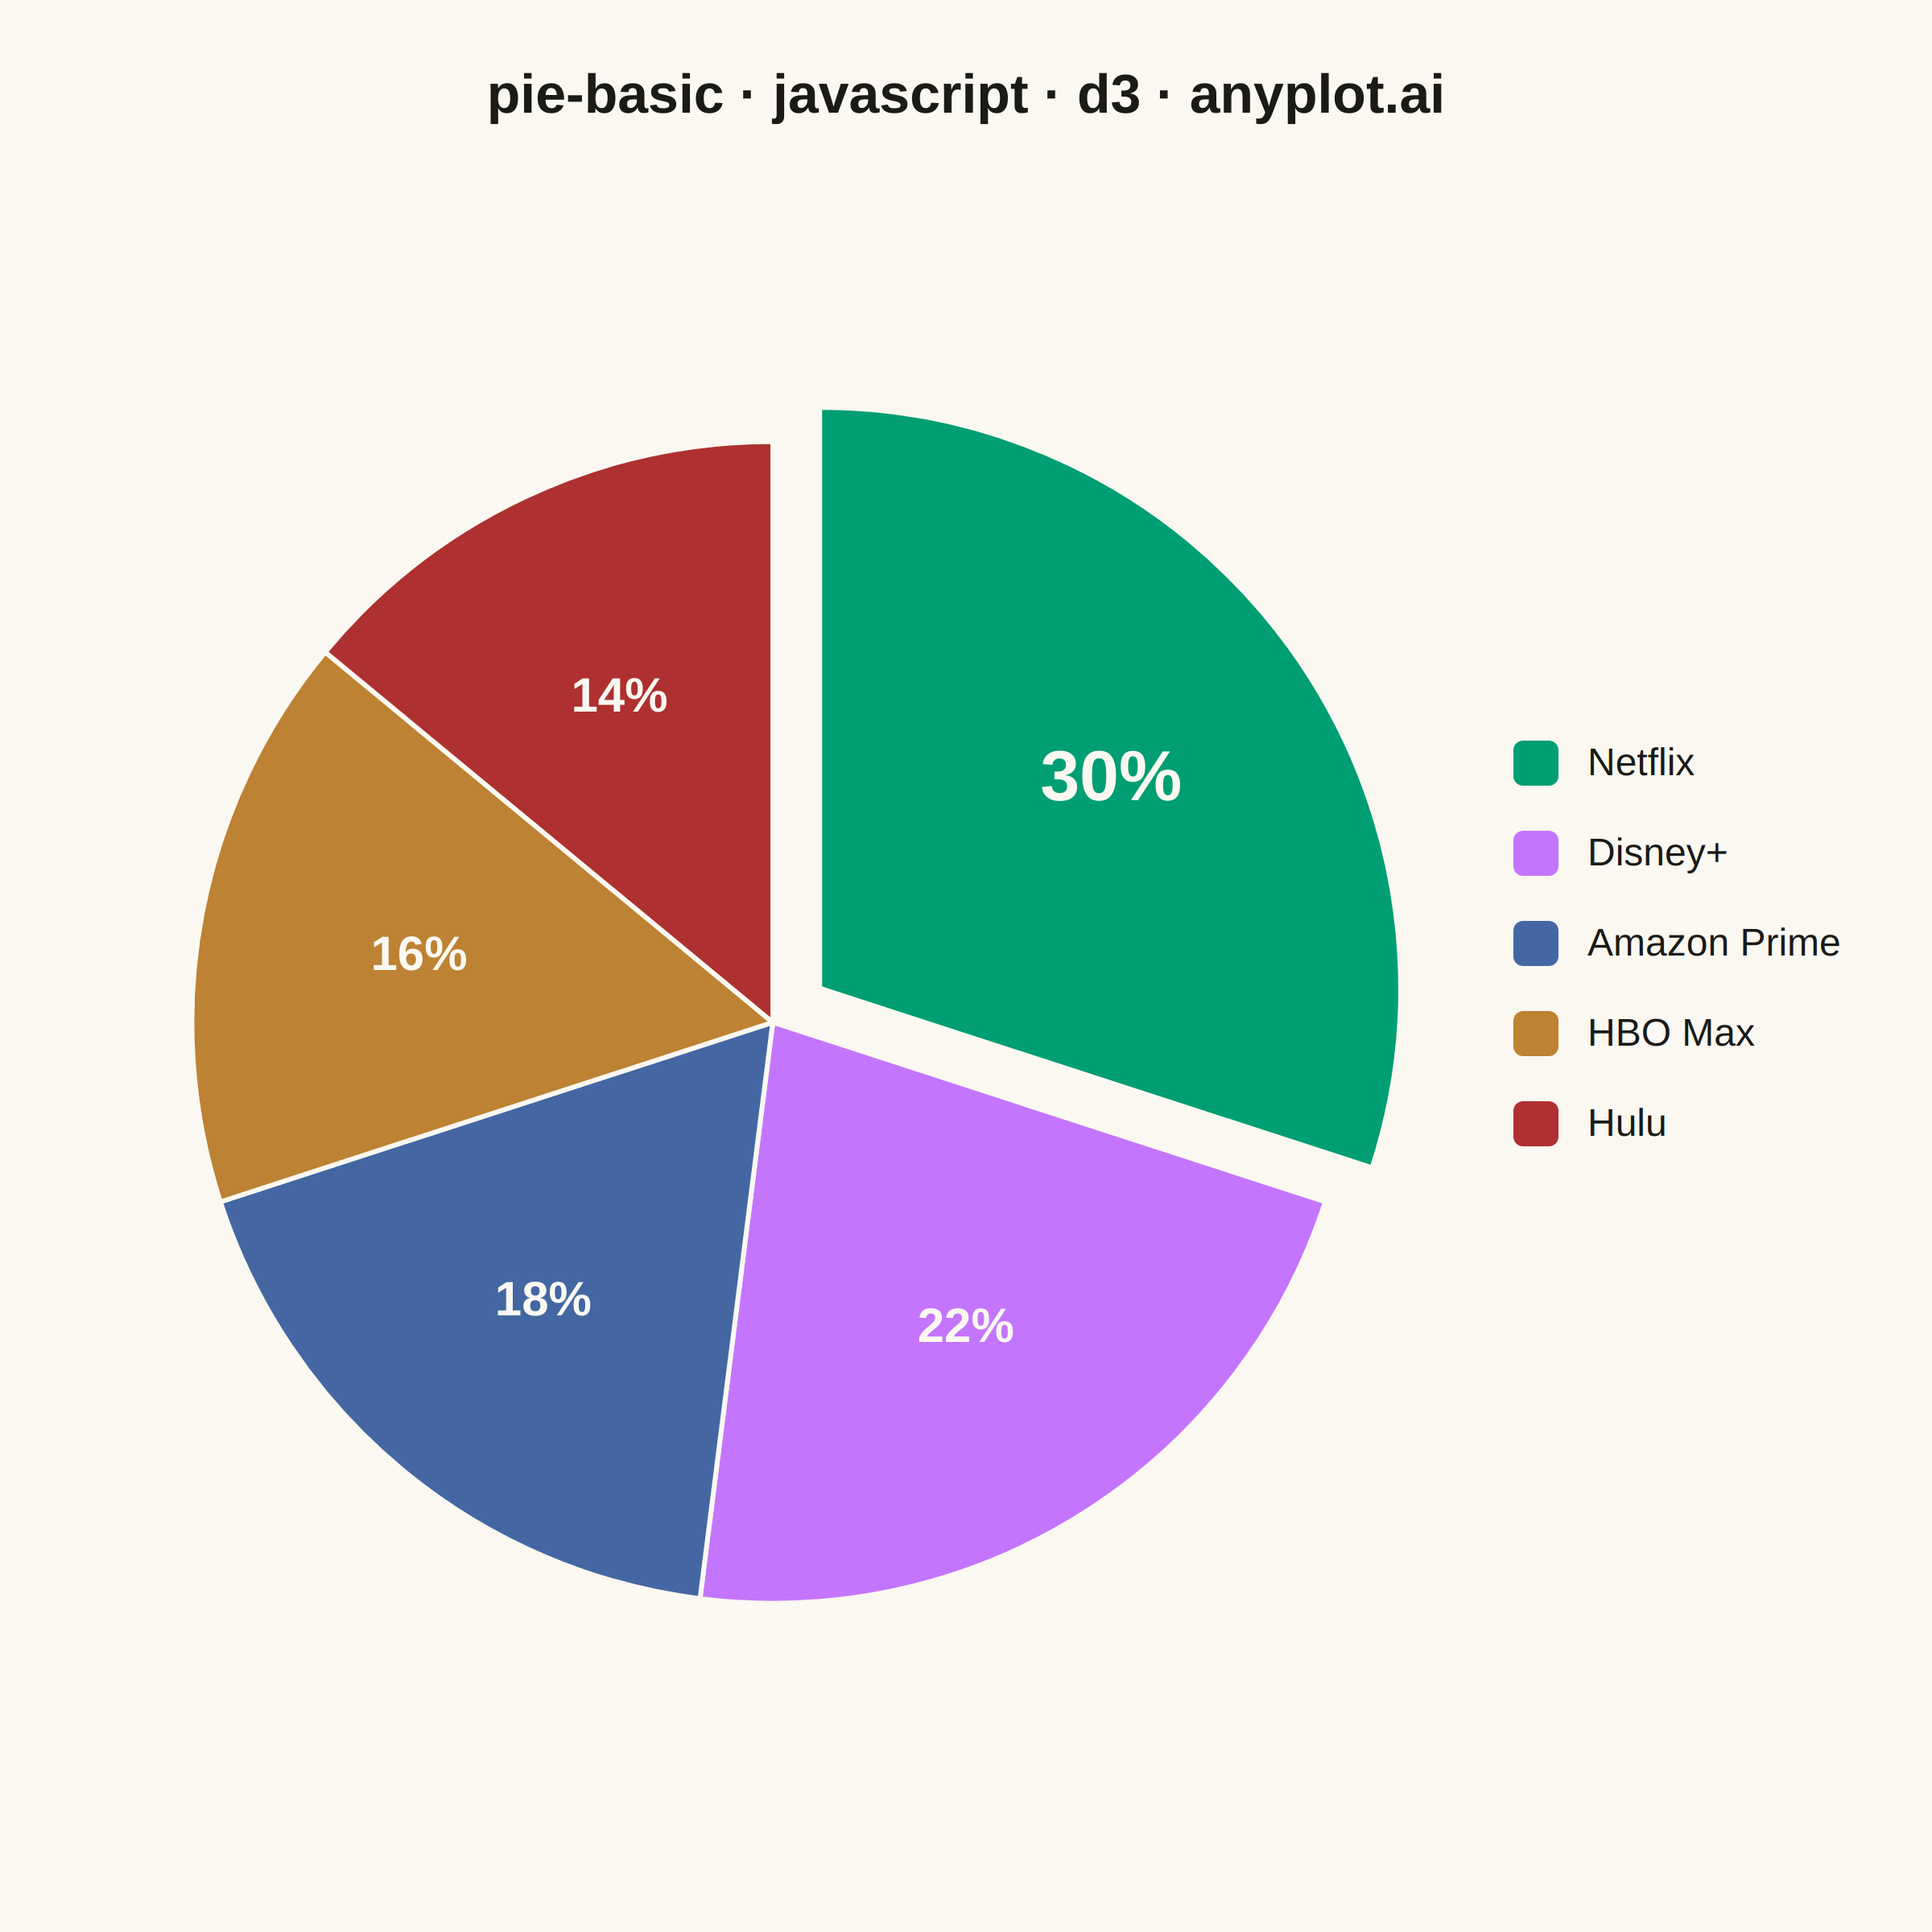
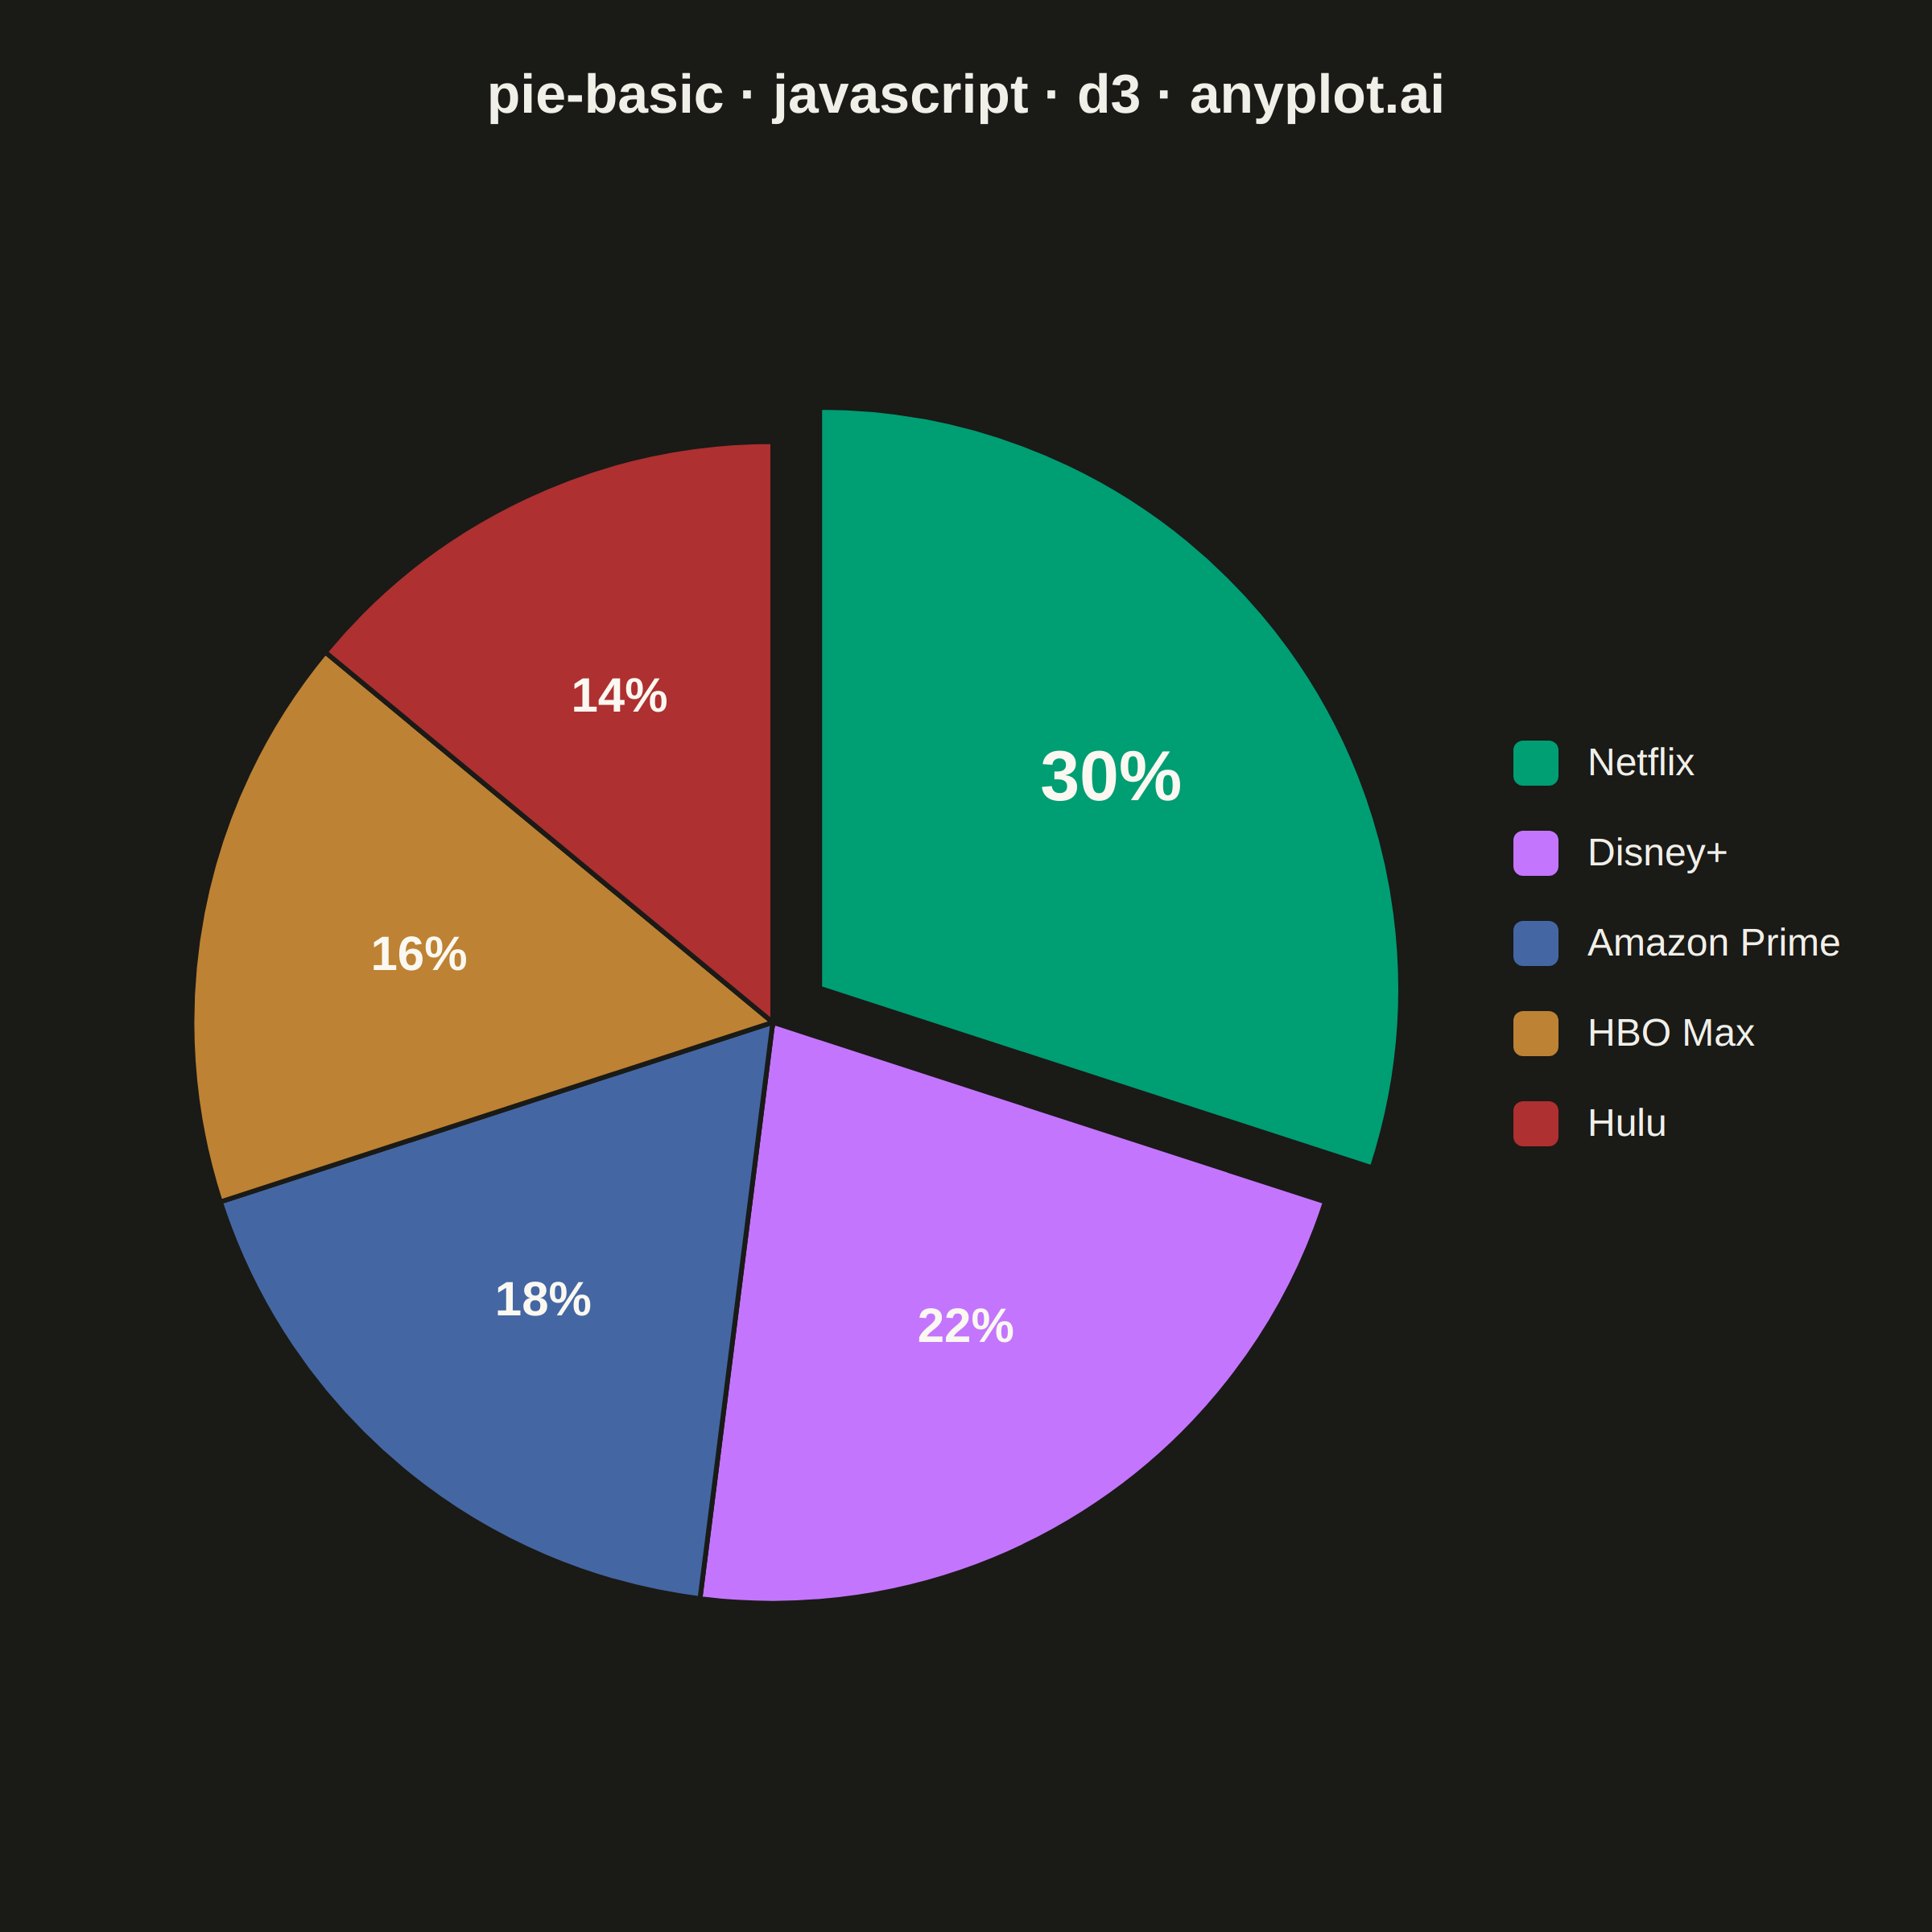
The same plot in 14 other libraries — JavaScript: Chart.js, Apache ECharts, Highcharts, MUI X Charts; Python: Altair, Bokeh, lets-plot, Matplotlib, Plotly, plotnine, Pygal, Seaborn; R: ggplot2; Julia: Makie.jl. Compare all 15 side by side: Basic Pie Chart in Python, R, Julia and JavaScript.
A pie chart showing proportions of categorical data as slices of a circle. Each slice represents a category's contribution to the whole, with the angle proportional to its value. Essential for visualizing parts-to-whole relationships in a simple, intuitive format.
// anyplot.ai
// pie-basic: Basic Pie Chart
// Library: d3 7.9.0 | JavaScript 22.22.3
// Quality: 87/100 | Created: 2026-06-02
//# anyplot-orientation: square

const t = window.ANYPLOT_TOKENS;
const { width, height } = window.ANYPLOT_SIZE;

// --- Data — Streaming subscriber share (illustrative, 2024) ------------------
const data = [
  { category: "Netflix", value: 30 },
  { category: "Disney+", value: 22 },
  { category: "Amazon Prime", value: 18 },
  { category: "HBO Max", value: 16 },
  { category: "Hulu", value: 14 },
];
const total = d3.sum(data, (d) => d.value);

// --- SVG mount ---------------------------------------------------------------
const svg = d3
  .select("#container")
  .append("svg")
  .attr("width", width)
  .attr("height", height);

// --- Layout — title on top, pie centered-left, legend on the right -----------
const titleY = 70;
const legendW = 280;
const pieAreaX0 = 40;
const pieAreaY0 = titleY + 60;
const pieAreaX1 = width - legendW;
const pieAreaY1 = height - 60;
const radius =
  (Math.min(pieAreaX1 - pieAreaX0, pieAreaY1 - pieAreaY0) / 2) * 0.82;
const cx = (pieAreaX0 + pieAreaX1) / 2;
const cy = (pieAreaY0 + pieAreaY1) / 2;

// --- Colors — Imprint palette positions 1..N in canonical order --------------
const color = d3
  .scaleOrdinal()
  .domain(data.map((d) => d.category))
  .range(t.palette);

// --- Pie + arc generators ----------------------------------------------------
const pieGen = d3
  .pie()
  .value((d) => d.value)
  .sort(null);
const arcs = pieGen(data);
const arc = d3.arc().innerRadius(0).outerRadius(radius);
const labelArc = d3
  .arc()
  .innerRadius(radius * 0.62)
  .outerRadius(radius * 0.62);

// Slightly explode the largest slice for emphasis (per spec)
const maxIdx = d3.maxIndex(data, (d) => d.value);
const explodeR = 36;

const g = svg.append("g").attr("transform", `translate(${cx},${cy})`);

// --- Slices ------------------------------------------------------------------
g.selectAll("path.slice")
  .data(arcs)
  .join("path")
  .attr("class", "slice")
  .attr("transform", (a) => {
    if (a.index !== maxIdx) return "translate(0,0)";
    const mid = (a.startAngle + a.endAngle) / 2 - Math.PI / 2;
    return `translate(${Math.cos(mid) * explodeR},${Math.sin(mid) * explodeR})`;
  })
  .attr("d", arc)
  .attr("fill", (a) => color(a.data.category))
  .attr("stroke", t.pageBg)
  .attr("stroke-width", 3);

// --- Percentage labels inside slices -----------------------------------------
// Leader slice (Netflix 30%) gets a larger/heavier label so the hierarchy
// reinforces the explosion focal point.
g.selectAll("text.pct")
  .data(arcs)
  .join("text")
  .attr("class", "pct")
  .attr("transform", (a) => {
    const [lx, ly] = labelArc.centroid(a);
    if (a.index !== maxIdx) return `translate(${lx},${ly})`;
    const mid = (a.startAngle + a.endAngle) / 2 - Math.PI / 2;
    return `translate(${lx + Math.cos(mid) * explodeR},${ly + Math.sin(mid) * explodeR})`;
  })
  .attr("text-anchor", "middle")
  .attr("dominant-baseline", "central")
  // Always-light label on saturated slices: dark theme's near-black `pageBg`
  // tanks contrast on the matte-red and blue slots. The Imprint cream reads
  // cleanly against every palette member in either theme.
  .attr("fill", "#FAF8F1")
  .style("font-size", (a) => (a.index === maxIdx ? "44px" : "30px"))
  .style("font-weight", (a) => (a.index === maxIdx ? "700" : "600"))
  .text((a) => `${Math.round((a.data.value / total) * 100)}%`);

// --- Title -------------------------------------------------------------------
svg
  .append("text")
  .attr("x", width / 2)
  .attr("y", titleY)
  .attr("text-anchor", "middle")
  .attr("fill", t.ink)
  .style("font-size", "34px")
  .style("font-weight", "600")
  .text("pie-basic · javascript · d3 · anyplot.ai");

// --- Legend ------------------------------------------------------------------
const legendX = width - legendW + 20;
const rowH = 56;
const legendH = data.length * rowH;
const legendY0 = (height - legendH) / 2;
const legend = svg
  .append("g")
  .attr("transform", `translate(${legendX},${legendY0})`);
const item = legend
  .selectAll("g.item")
  .data(data)
  .join("g")
  .attr("class", "item")
  .attr("transform", (_d, i) => `translate(0,${i * rowH})`);
item
  .append("rect")
  .attr("width", 28)
  .attr("height", 28)
  .attr("rx", 6)
  .attr("fill", (d) => color(d.category));
item
  .append("text")
  .attr("x", 46)
  .attr("y", 14)
  .attr("dominant-baseline", "central")
  .attr("fill", t.ink)
  .style("font-size", "24px")
  .text((d) => d.category);
Runnable source as JSON, for any HTTP client: https://api.anyplot.ai/specs/pie-basic/d3/code. Any spec id and library id listed in llms-full.txt fit the same URL shape; every URL below is complete and callable.
{
  "spec_id": "pie-basic",
  "language": "javascript",
  "library": "d3",
  "page": "https://anyplot.ai/pie-basic/javascript/d3",
  "hub": "https://anyplot.ai/pie-basic",
  "code_json": "https://api.anyplot.ai/specs/pie-basic/d3/code",
  "spec_json": "https://api.anyplot.ai/specs/pie-basic",
  "render_light_png": "https://storage.googleapis.com/anyplot-images/plots/pie-basic/javascript/d3/plot-light.png",
  "render_dark_png": "https://storage.googleapis.com/anyplot-images/plots/pie-basic/javascript/d3/plot-dark.png",
  "interactive_light_html": "https://storage.googleapis.com/anyplot-images/plots/pie-basic/javascript/d3/plot-light.html",
  "interactive_dark_html": "https://storage.googleapis.com/anyplot-images/plots/pie-basic/javascript/d3/plot-dark.html",
  "quality_score": 87.0,
  "license": "MIT",
  "guide": "https://anyplot.ai/llms.txt"
}
Part of Basic Pie Chart on anyplot.ai.