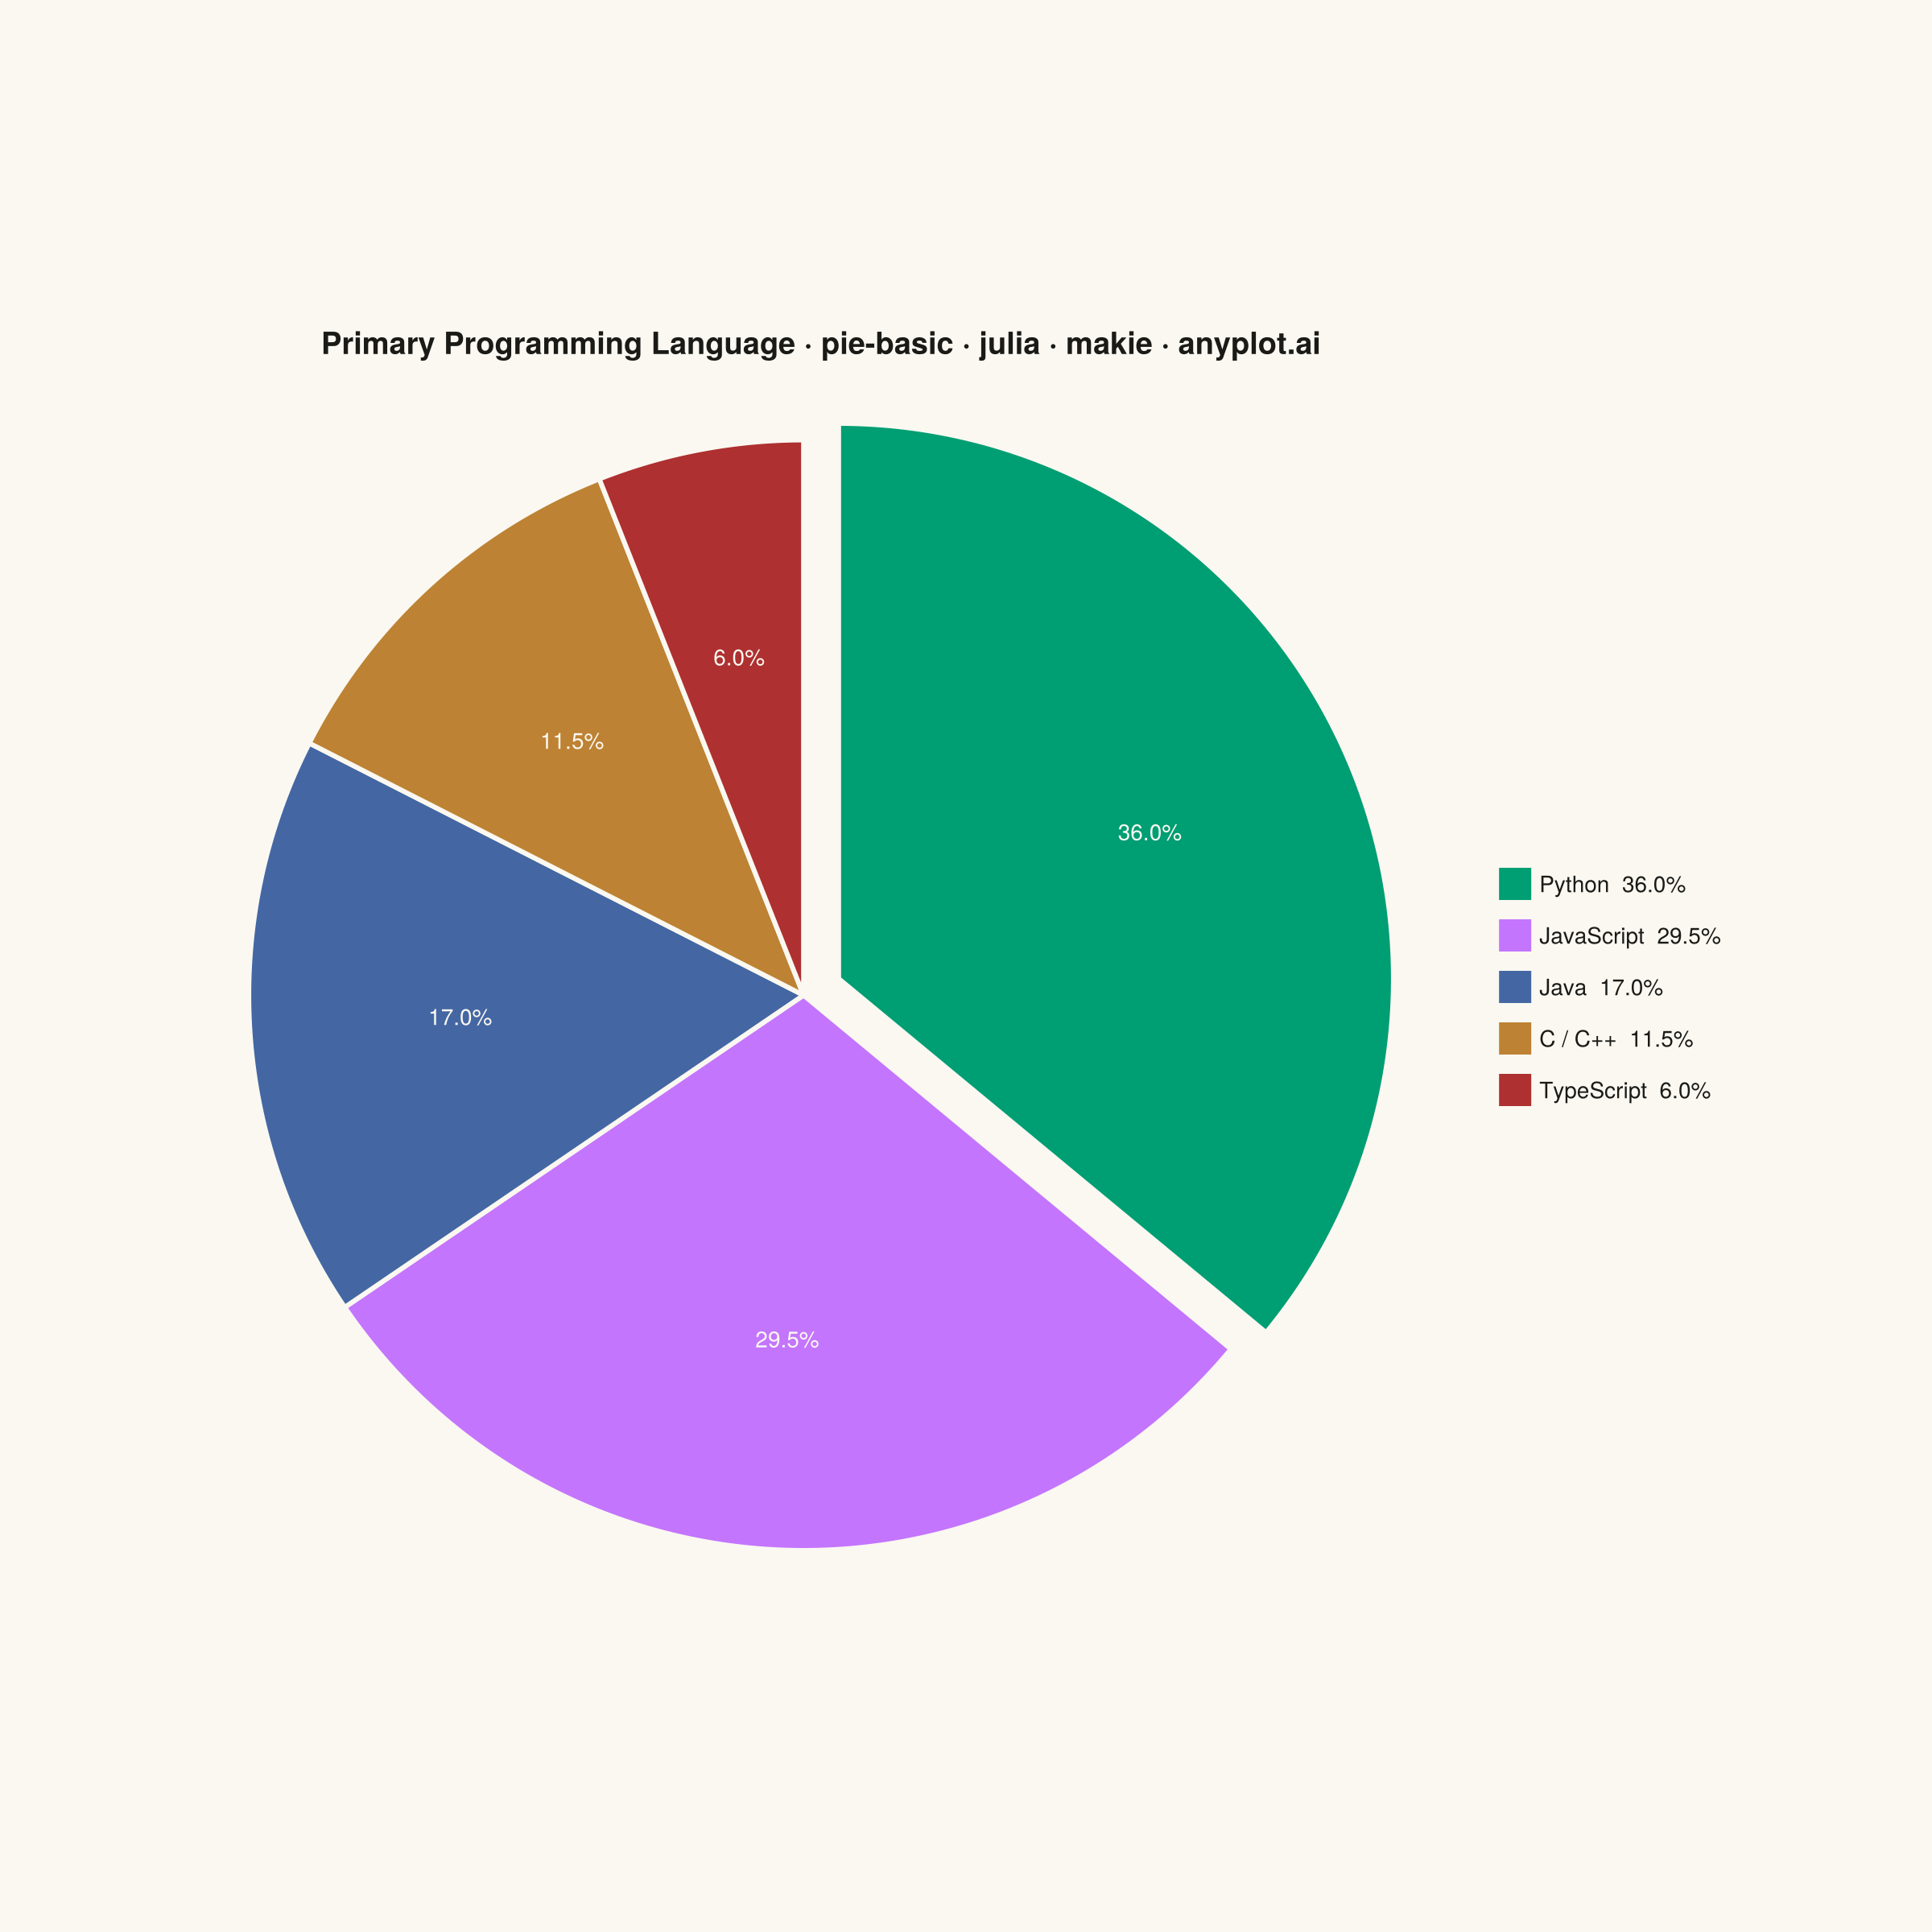
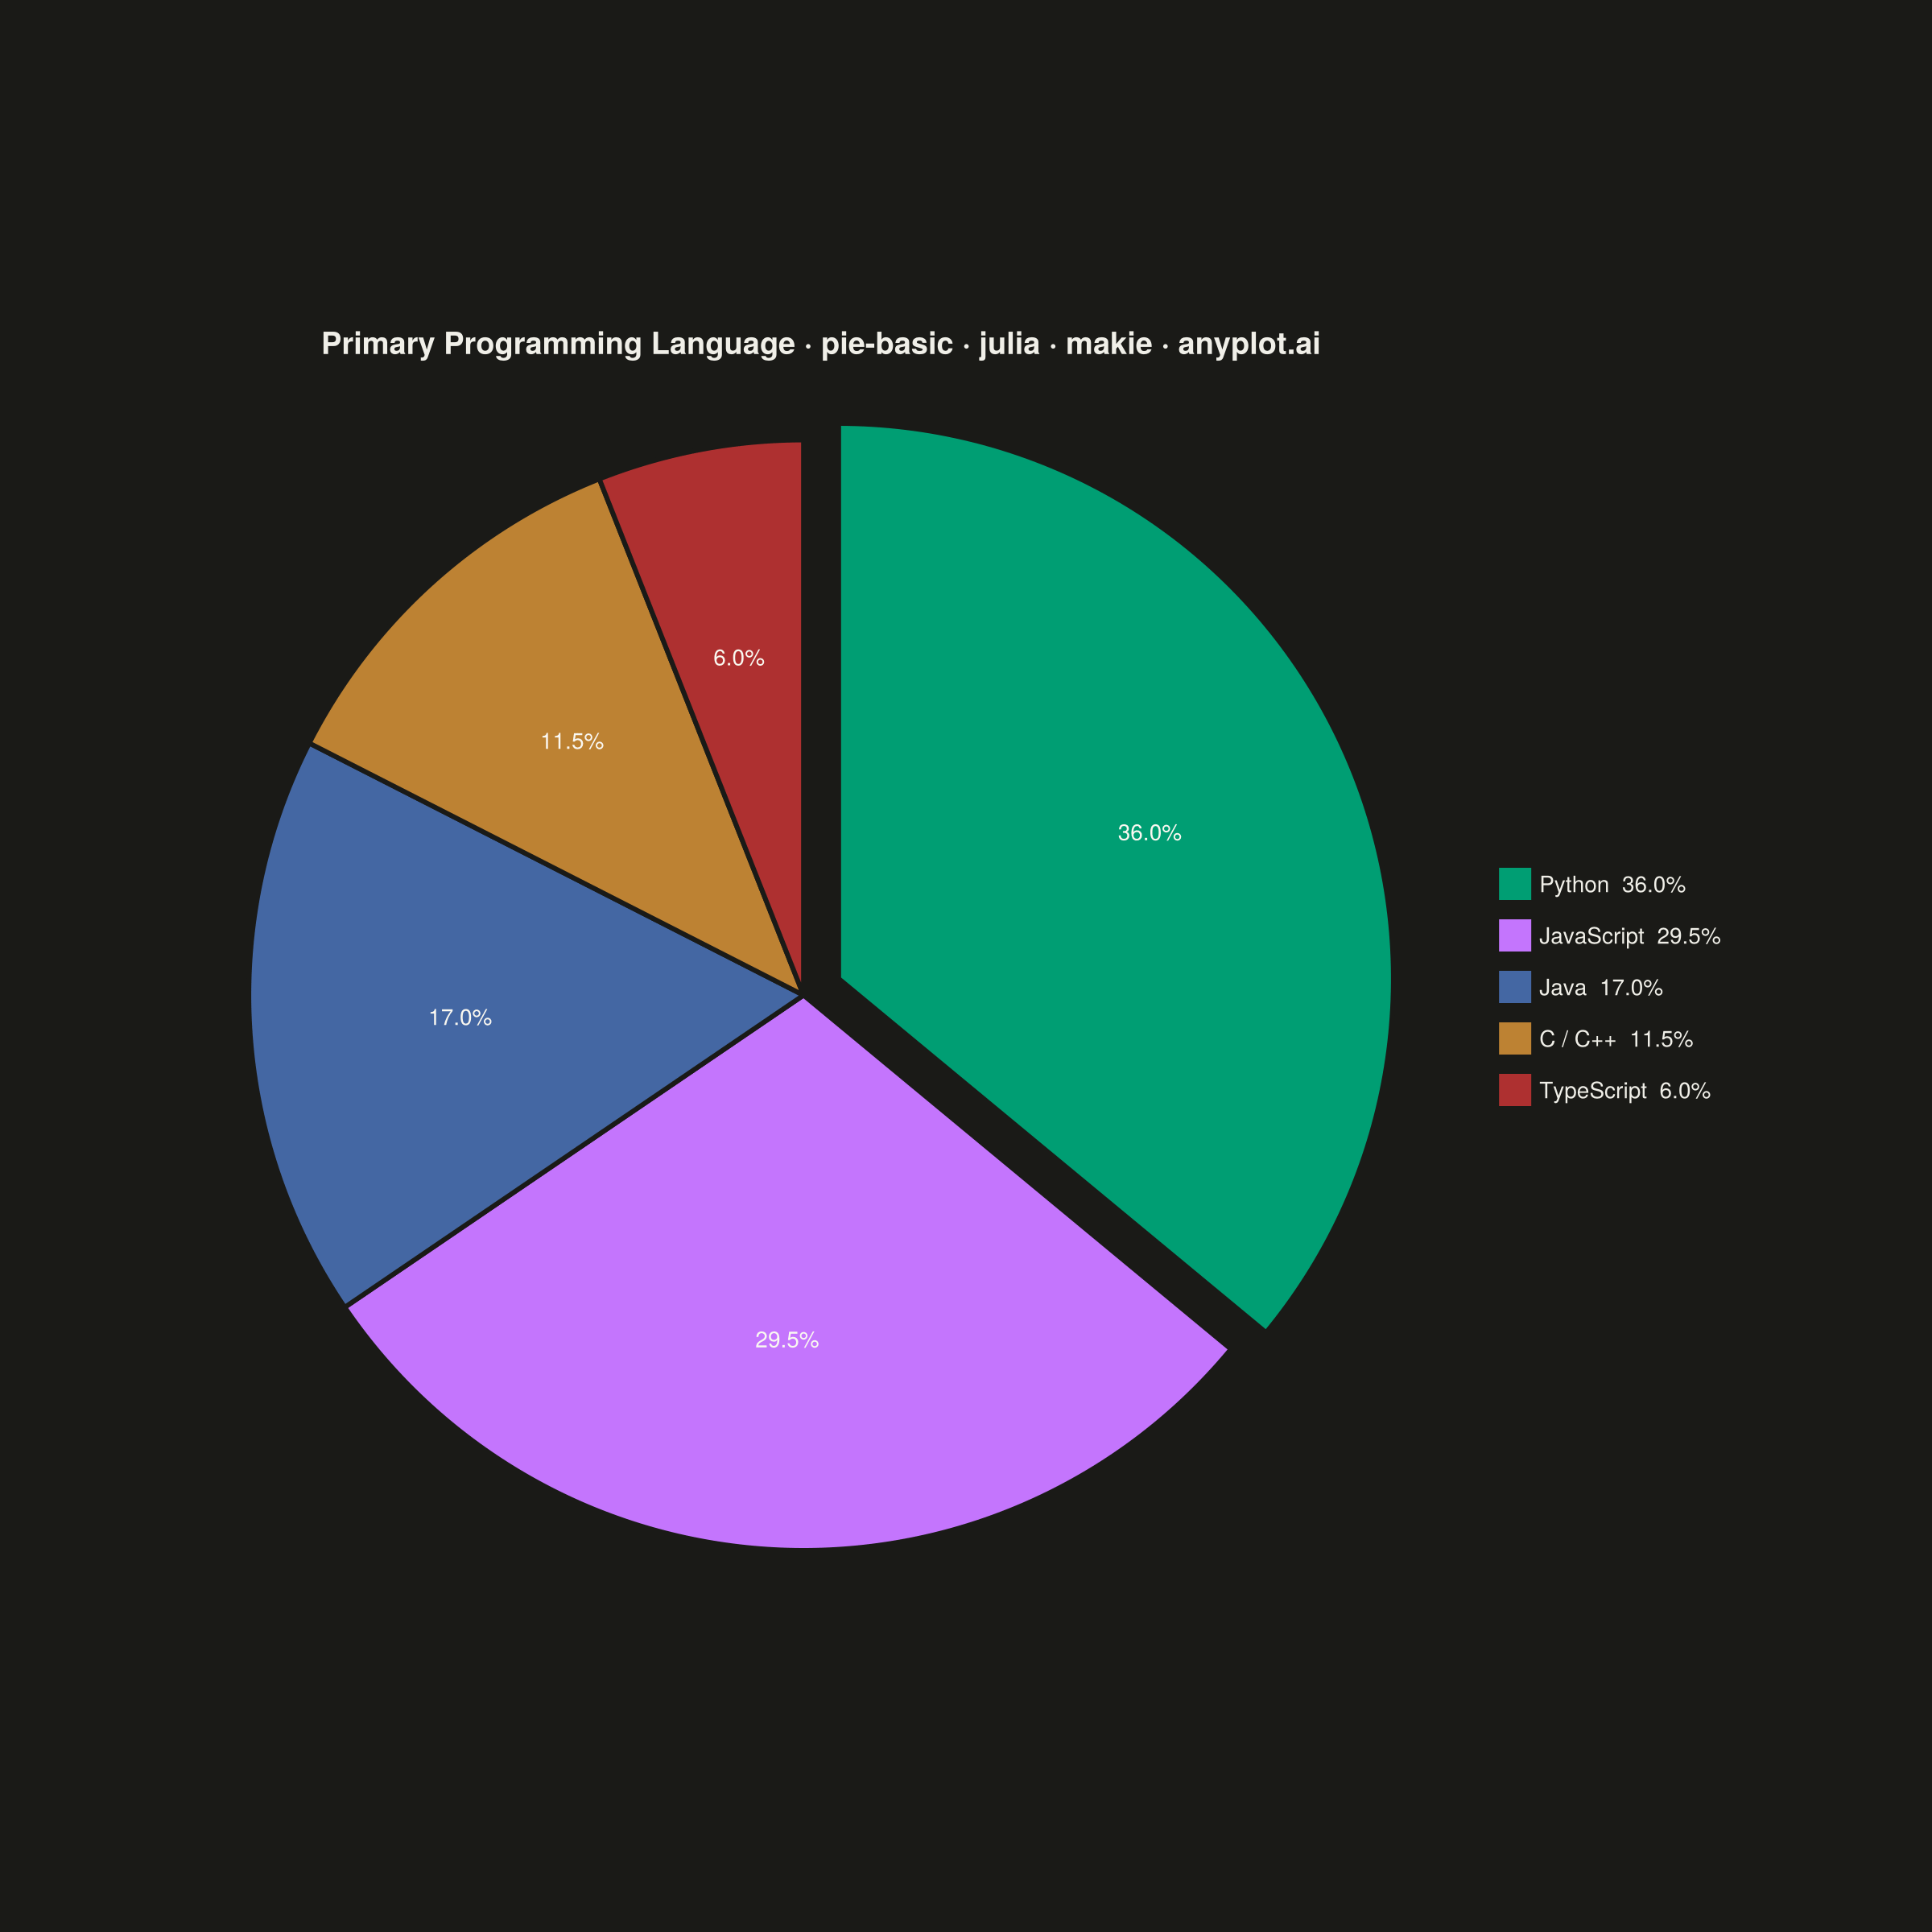
The same plot in 14 other libraries — Python: Altair, Bokeh, lets-plot, Matplotlib, Plotly, plotnine, Pygal, Seaborn; R: ggplot2; JavaScript: Chart.js, D3.js, Apache ECharts, Highcharts, MUI X Charts. Compare all 15 side by side: Basic Pie Chart in Python, R, Julia and JavaScript.
A pie chart showing proportions of categorical data as slices of a circle. Each slice represents a category's contribution to the whole, with the angle proportional to its value. Essential for visualizing parts-to-whole relationships in a simple, intuitive format.
# anyplot.ai
# pie-basic: Basic Pie Chart
# Library: makie 0.22.10 | Julia 1.11.9
# Quality: 90/100 | Created: 2026-05-28

using CairoMakie
using Colors
using Printf

const THEME       = get(ENV, "ANYPLOT_THEME", "light")
const PAGE_BG     = THEME == "light" ? colorant"#FAF8F1" : colorant"#1A1A17"
const ELEVATED_BG = THEME == "light" ? colorant"#FFFDF6" : colorant"#242420"
const INK         = THEME == "light" ? colorant"#1A1A17" : colorant"#F0EFE8"
const INK_SOFT    = THEME == "light" ? colorant"#4A4A44" : colorant"#B8B7B0"
const LABEL_FG    = colorant"#FFFFFF"

const IMPRINT_PALETTE = [
    colorant"#009E73",
    colorant"#C475FD",
    colorant"#4467A3",
    colorant"#BD8233",
    colorant"#AE3030",
]

const categories  = ["Python", "JavaScript", "Java", "C / C++", "TypeScript"]
const values      = [36.0, 29.5, 17.0, 11.5, 6.0]
const total       = sum(values)
const fracs       = values ./ total
const pct         = fracs .* 100

const explode_idx = argmax(values)
const explode_r   = 0.08

# Cumulative fractions for angle calculations (matches pie! counterclockwise convention)
const cum        = cumsum(vcat(0.0, fracs))
const PIE_OFFSET = Float64(π / 2)

const title_str = "Primary Programming Language · pie-basic · julia · makie · anyplot.ai"
const title_fs  = round(Int, 20 * min(1.0, 66.0 / length(title_str)))

fig = Figure(
    size            = (1200, 1200),
    fontsize        = 14,
    backgroundcolor = PAGE_BG,
    figure_padding  = 40,
)

ax = Axis(
    fig[1, 1];
    title              = title_str,
    titlesize          = title_fs,
    titlefont          = :bold,
    titlegap           = 24,
    titlecolor         = INK,
    aspect             = DataAspect(),
    backgroundcolor    = PAGE_BG,
    topspinevisible    = false,
    rightspinevisible  = false,
    leftspinevisible   = false,
    bottomspinevisible = false,
    xgridvisible       = false,
    ygridvisible       = false,
    xticksvisible      = false,
    yticksvisible      = false,
    xticklabelsvisible = false,
    yticklabelsvisible = false,
)

# High-level Makie pie! recipe — idiomatic slice rendering
p = pie!(
    ax, fracs;
    color       = IMPRINT_PALETTE[1:length(categories)],
    strokecolor = PAGE_BG,
    strokewidth = 3,
    offset      = PIE_OFFSET,
)

# Explode the dominant slice by translating its child polygon outward
let θ = PIE_OFFSET + (cum[explode_idx] + fracs[explode_idx] / 2) * 2π
    translate!(p.plots[explode_idx], Vec3f(explode_r * cos(θ), explode_r * sin(θ), 0))
end

# Percentage labels at arc midpoints; dominant slice gets bolder, larger label
for i in 1:length(values)
    θ  = PIE_OFFSET + (cum[i] + fracs[i] / 2) * 2π
    ex = i == explode_idx ? explode_r * cos(θ) : 0.0
    ey = i == explode_idx ? explode_r * sin(θ) : 0.0
    if i == explode_idx
        text!(ax, ex + 0.62 * cos(θ), ey + 0.62 * sin(θ);
              text     = @sprintf("%.1f%%", pct[i]),
              align    = (:center, :center),
              fontsize = 17,
              font     = :bold,
              color    = LABEL_FG,
        )
    else
        text!(ax, ex + 0.62 * cos(θ), ey + 0.62 * sin(θ);
              text     = @sprintf("%.1f%%", pct[i]),
              align    = (:center, :center),
              fontsize = 13,
              color    = LABEL_FG,
        )
    end
end

# Explicit limits so the translated slice stays fully in view
limits!(ax, -1.2, 1.2, -1.2, 1.2)

legend_entries = [PolyElement(color = IMPRINT_PALETTE[i], strokecolor = :transparent) for i in 1:length(categories)]
legend_labels  = [@sprintf("%s  %.1f%%", categories[i], pct[i]) for i in 1:length(categories)]

Legend(
    fig[1, 2],
    legend_entries,
    legend_labels;
    framevisible    = false,
    backgroundcolor = ELEVATED_BG,
    labelcolor      = INK,
    labelsize       = 14,
    rowgap          = 14,
    halign          = :left,
    valign          = :center,
    padding         = (16, 16, 16, 16),
)

colsize!(fig.layout, 1, Relative(0.68))
colgap!(fig.layout, 1, 20)

save("plot-$(THEME).png", fig; px_per_unit = 2)
Runnable source as JSON, for any HTTP client: https://api.anyplot.ai/specs/pie-basic/makie/code. Any spec id and library id listed in llms-full.txt fit the same URL shape; every URL below is complete and callable.
{
  "spec_id": "pie-basic",
  "language": "julia",
  "library": "makie",
  "page": "https://anyplot.ai/pie-basic/julia/makie",
  "hub": "https://anyplot.ai/pie-basic",
  "code_json": "https://api.anyplot.ai/specs/pie-basic/makie/code",
  "spec_json": "https://api.anyplot.ai/specs/pie-basic",
  "render_light_png": "https://storage.googleapis.com/anyplot-images/plots/pie-basic/julia/makie/plot-light.png",
  "render_dark_png": "https://storage.googleapis.com/anyplot-images/plots/pie-basic/julia/makie/plot-dark.png",
  "quality_score": 90.0,
  "license": "MIT",
  "guide": "https://anyplot.ai/llms.txt"
}
Part of Basic Pie Chart on anyplot.ai.