The same plot in 14 other libraries — JavaScript: Chart.js, D3.js, Highcharts, MUI X Charts; Python: Altair, Bokeh, lets-plot, Matplotlib, Plotly, plotnine, Pygal, Seaborn; R: ggplot2; Julia: Makie.jl. Compare all 15 side by side: Basic Pie Chart in Python, R, Julia and JavaScript.
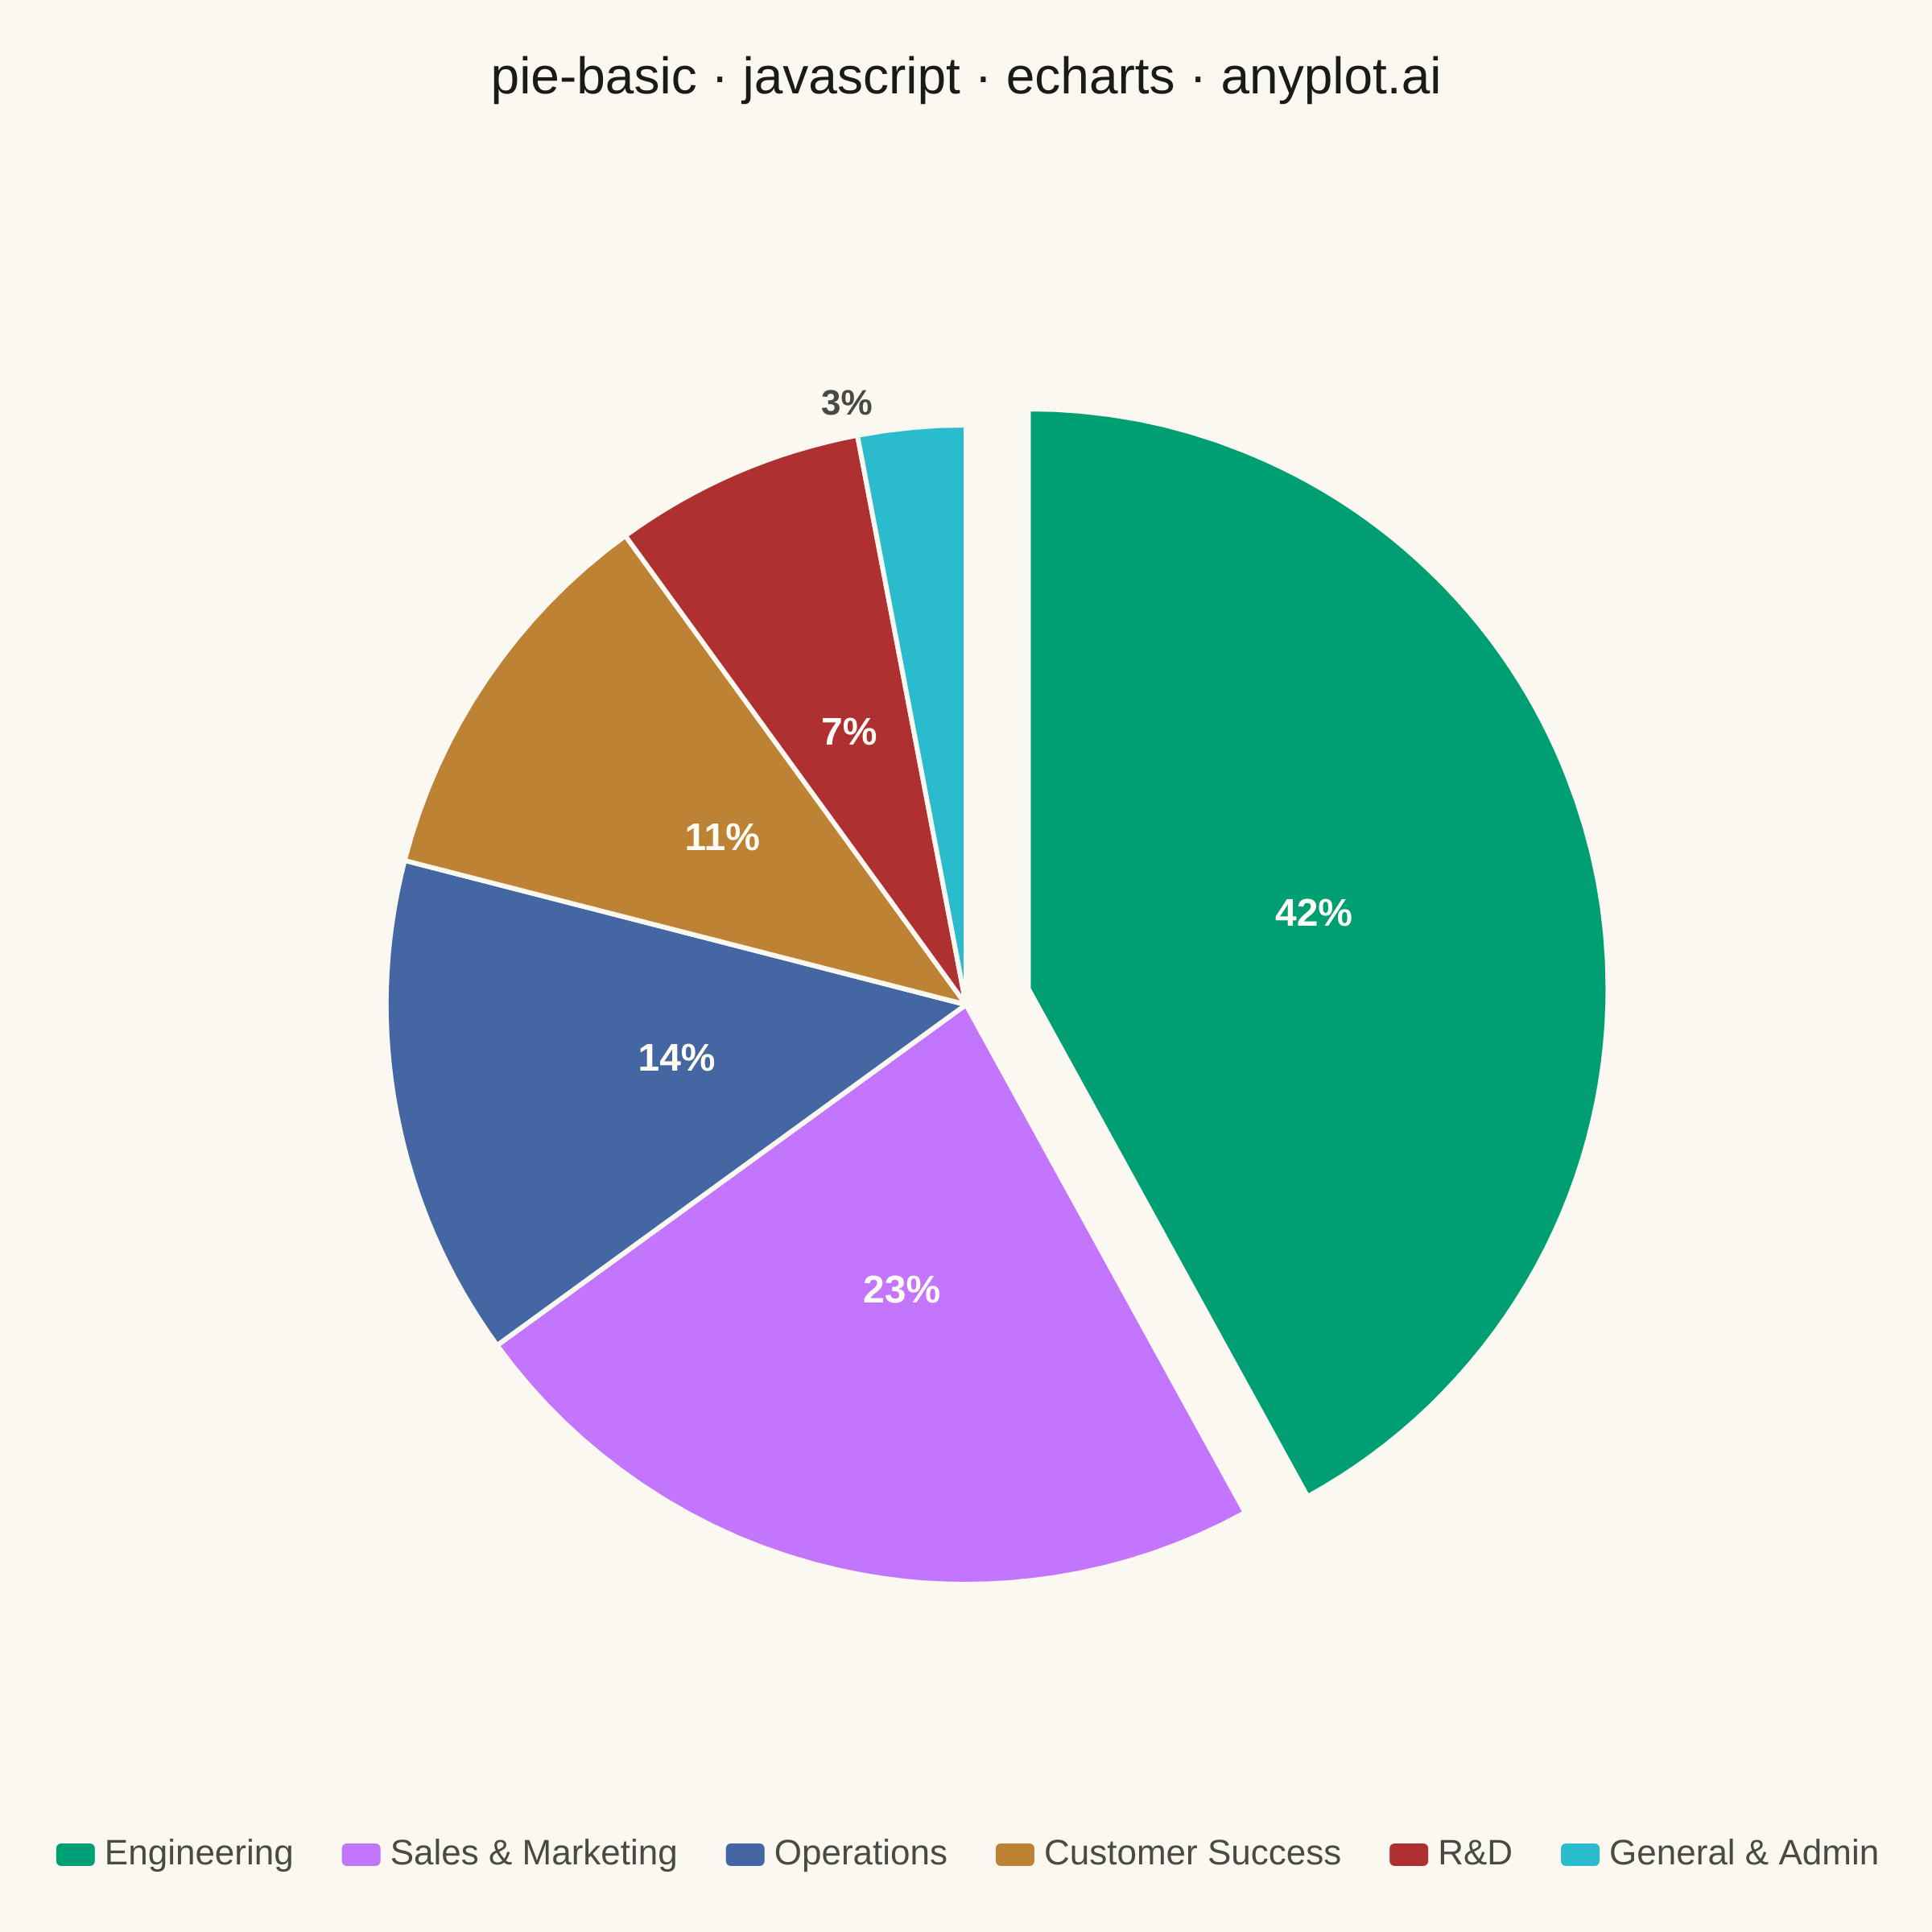
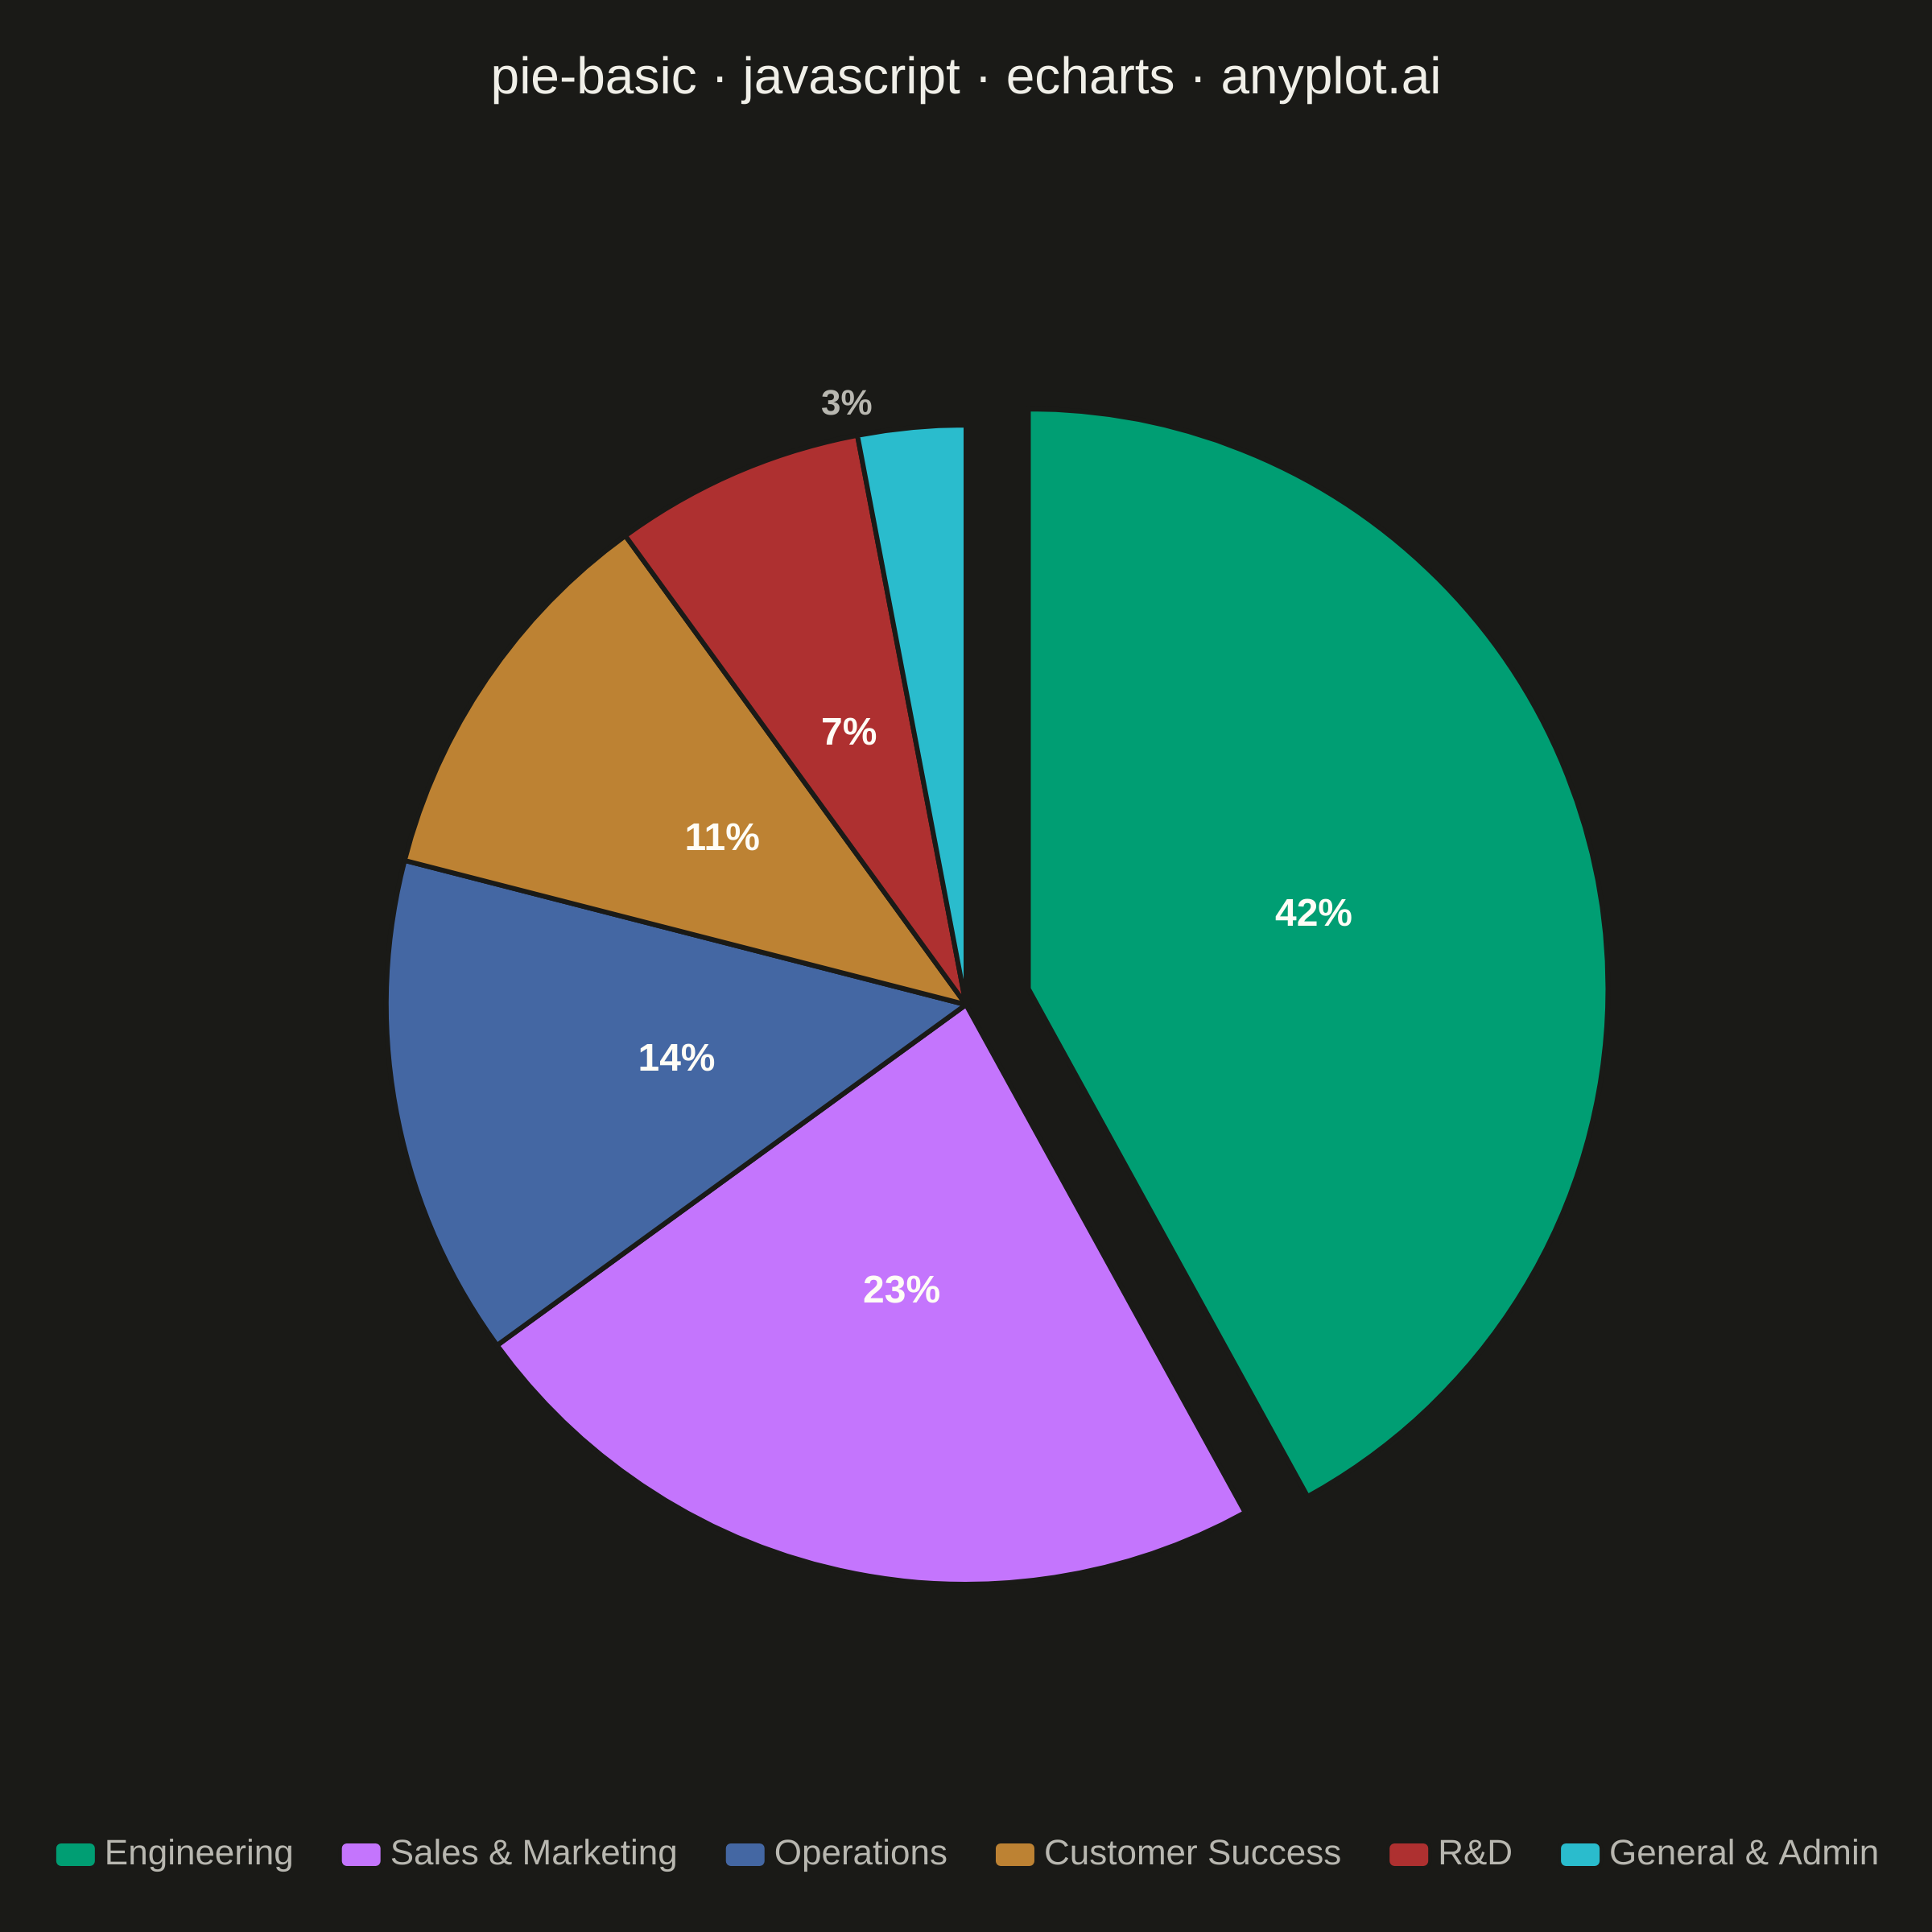
A pie chart showing proportions of categorical data as slices of a circle. Each slice represents a category's contribution to the whole, with the angle proportional to its value. Essential for visualizing parts-to-whole relationships in a simple, intuitive format.
// anyplot.ai
// pie-basic: Basic Pie Chart
// Library: echarts 5.5.1 | JavaScript 22.22.3
// Quality: 93/100 | Created: 2026-06-02
//# anyplot-orientation: square

const t = window.ANYPLOT_TOKENS;

// Data — FY25 operating budget allocation by department, % of total.
const allocation = [
  { name: "Engineering",       value: 42 },
  { name: "Sales & Marketing", value: 23 },
  { name: "Operations",        value: 14 },
  { name: "Customer Success",  value: 11 },
  { name: "R&D",               value: 7  },
  { name: "General & Admin",   value: 3  },
];

// Pull out the largest slice for emphasis (per the spec).
let largestIndex = 0;
for (let i = 1; i < allocation.length; i++) {
  if (allocation[i].value > allocation[largestIndex].value) largestIndex = i;
}

// Per-slice overrides: tiny wedges (<5%) get outside labels with a leader line
// so the percentage doesn't get squeezed against the slice border.
const SMALL_SLICE_THRESHOLD = 5;
const data = allocation.map((d, i) => {
  const item = { ...d, selected: i === largestIndex };
  if (d.value < SMALL_SLICE_THRESHOLD) {
    item.label = {
      position: "outside",
      color: t.inkSoft,
      fontSize: 22,
      fontWeight: 600,
      formatter: "{d}%",
    };
    item.labelLine = {
      show: true,
      length: 14,
      length2: 18,
      lineStyle: { color: t.inkSoft, width: 1.5 },
    };
  }
  return item;
});

// Init — fill the pre-sized #container; the harness handles size + DPR.
const chart = echarts.init(document.getElementById("container"));

chart.setOption({
  animation: false,
  color: t.palette,
  backgroundColor: "transparent",
  title: {
    text: "pie-basic · javascript · echarts · anyplot.ai",
    left: "center",
    top: 28,
    textStyle: { color: t.ink, fontSize: 32, fontWeight: 500 },
  },
  legend: {
    orient: "horizontal",
    bottom: 32,
    left: "center",
    icon: "roundRect",
    itemWidth: 26,
    itemHeight: 16,
    itemGap: 28,
    textStyle: { color: t.inkSoft, fontSize: 22 },
  },
  tooltip: {
    trigger: "item",
    formatter: "{b}: {d}%",
    backgroundColor: t.elevatedBg,
    borderColor: t.grid,
    textStyle: { color: t.ink, fontSize: 18 },
  },
  series: [
    {
      name: "Budget allocation",
      type: "pie",
      radius: ["0%", "60%"],
      center: ["50%", "52%"],
      startAngle: 90,
      selectedMode: "single",
      selectedOffset: 40,
      avoidLabelOverlap: true,
      data,
      label: {
        position: "inside",
        color: "#FFFDF6",
        fontSize: 24,
        fontWeight: 600,
        formatter: "{d}%",
      },
      labelLine: { show: false },
      itemStyle: {
        borderColor: t.pageBg,
        borderWidth: 3,
      },
      emphasis: { disabled: true },
    },
  ],
});

// Signal render-complete to the harness so the screenshot is taken
// only after ECharts finishes drawing.
window.__anyplotReady = false;
chart.on("finished", () => { window.__anyplotReady = true; });
Runnable source as JSON, for any HTTP client: https://api.anyplot.ai/specs/pie-basic/echarts/code. Any spec id and library id listed in llms-full.txt fit the same URL shape; every URL below is complete and callable.
{
  "spec_id": "pie-basic",
  "language": "javascript",
  "library": "echarts",
  "page": "https://anyplot.ai/pie-basic/javascript/echarts",
  "hub": "https://anyplot.ai/pie-basic",
  "code_json": "https://api.anyplot.ai/specs/pie-basic/echarts/code",
  "spec_json": "https://api.anyplot.ai/specs/pie-basic",
  "render_light_png": "https://storage.googleapis.com/anyplot-images/plots/pie-basic/javascript/echarts/plot-light.png",
  "render_dark_png": "https://storage.googleapis.com/anyplot-images/plots/pie-basic/javascript/echarts/plot-dark.png",
  "interactive_light_html": "https://storage.googleapis.com/anyplot-images/plots/pie-basic/javascript/echarts/plot-light.html",
  "interactive_dark_html": "https://storage.googleapis.com/anyplot-images/plots/pie-basic/javascript/echarts/plot-dark.html",
  "quality_score": 93.0,
  "license": "MIT",
  "guide": "https://anyplot.ai/llms.txt"
}
Part of Basic Pie Chart on anyplot.ai.