The same plot in 14 other libraries — JavaScript: Chart.js, D3.js, Apache ECharts, Highcharts; Python: Altair, Bokeh, lets-plot, Matplotlib, Plotly, plotnine, Pygal, Seaborn; R: ggplot2; Julia: Makie.jl. Compare all 15 side by side: Basic Pie Chart in Python, R, Julia and JavaScript.
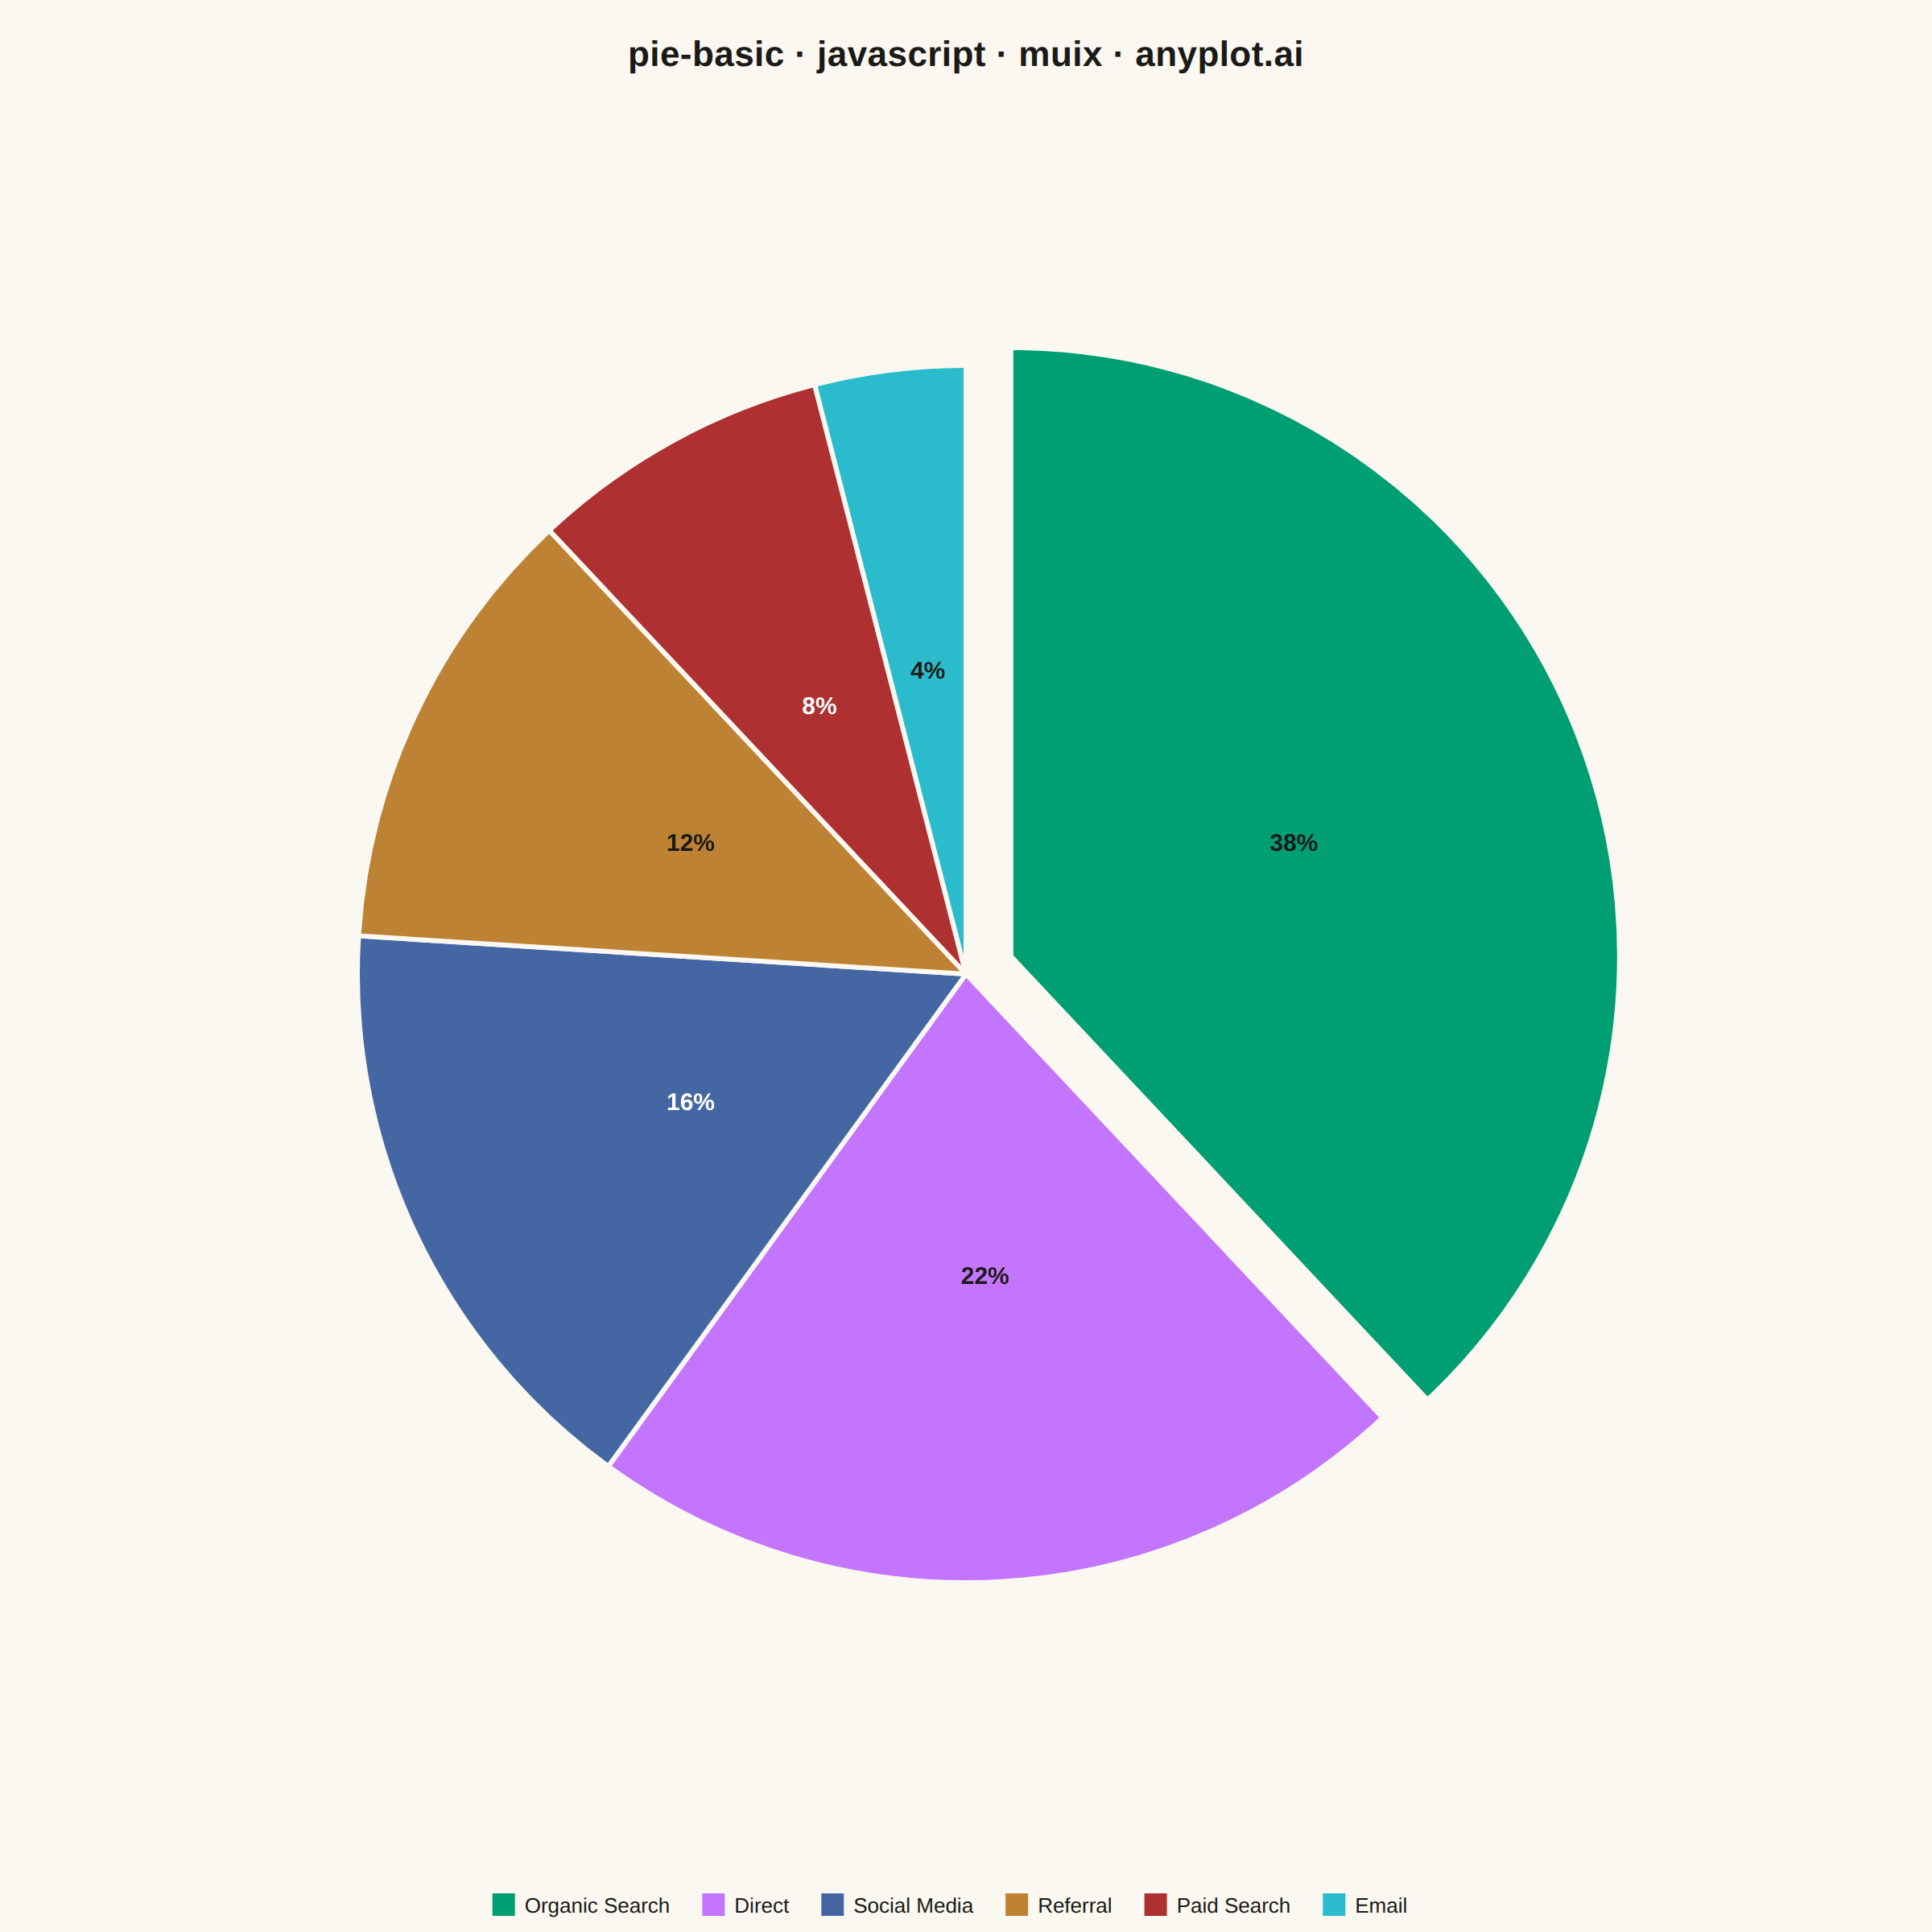
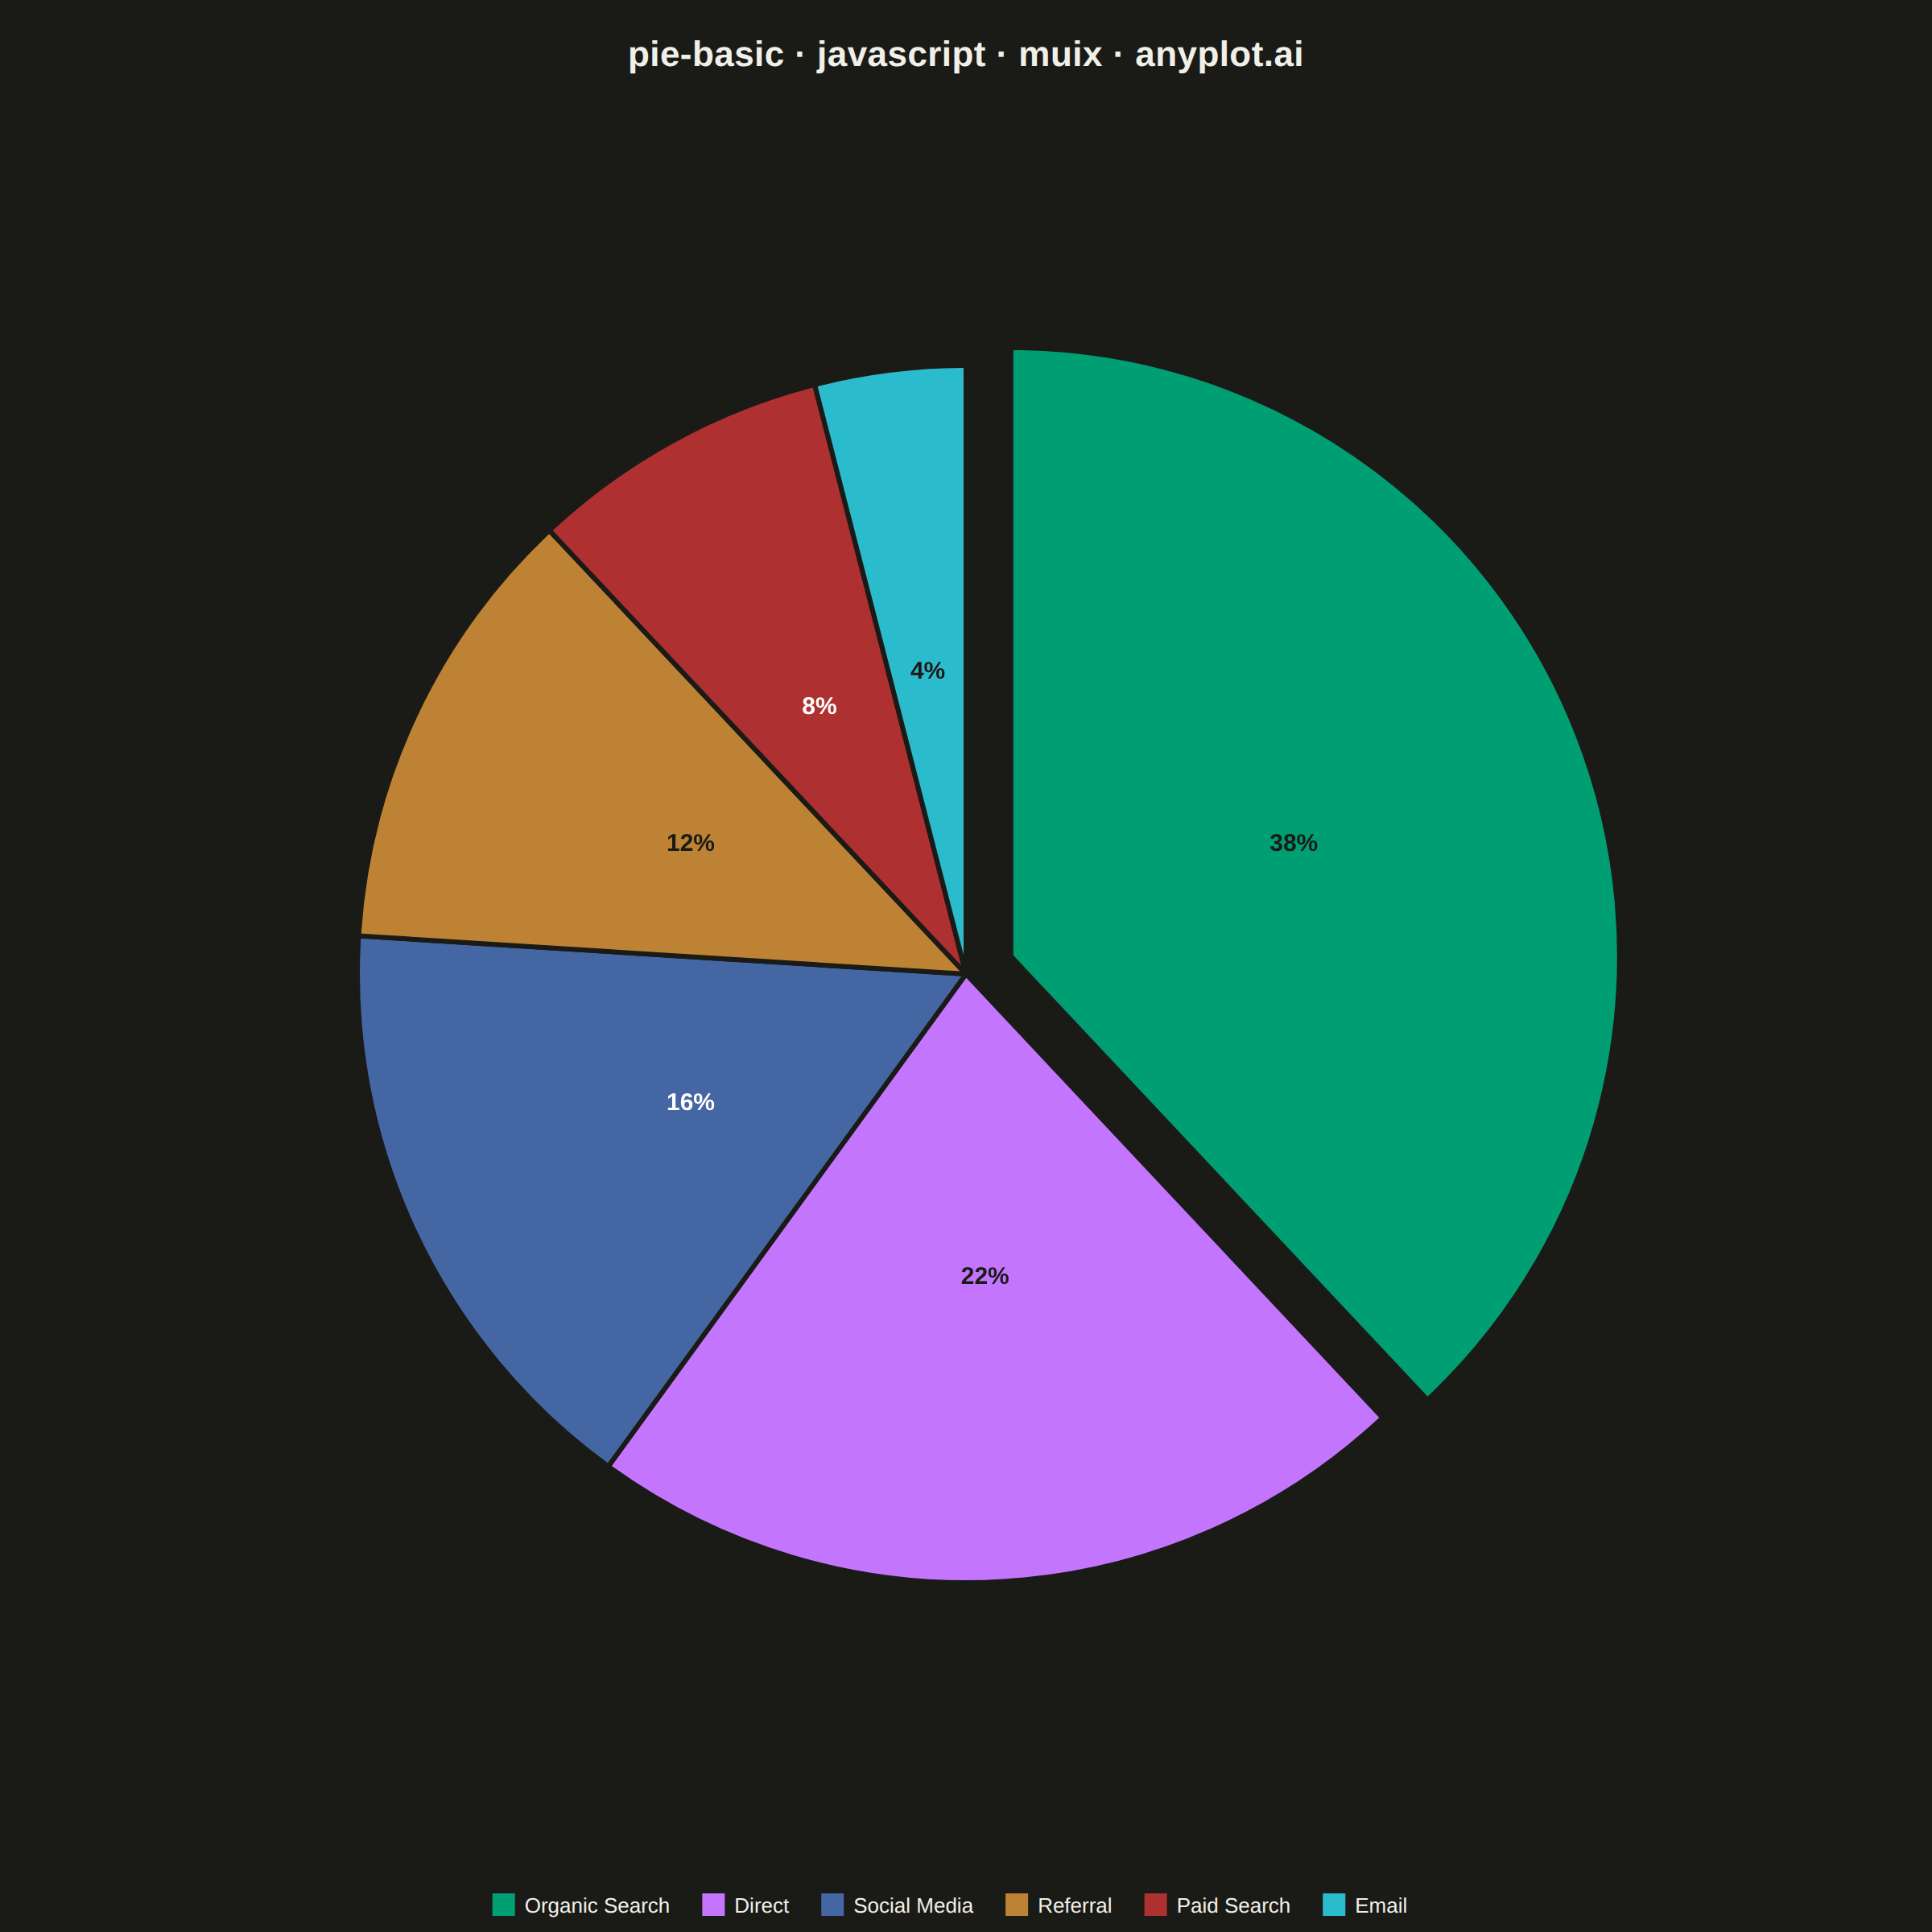
A pie chart showing proportions of categorical data as slices of a circle. Each slice represents a category's contribution to the whole, with the angle proportional to its value. Essential for visualizing parts-to-whole relationships in a simple, intuitive format.
// anyplot.ai
// pie-basic: Basic Pie Chart
// Library: muix 7.29.1 | JavaScript 22.23.2
// Quality: 89/100 | Created: 2026-08-20
//# anyplot-orientation: square
// anyplot.ai
// pie-basic: Basic Pie Chart
// Library: MUI X Charts | React | Node 22
// License: @mui/x-charts — MIT (community). Pro/Premium are out of scope.
// Quality: pending | Created: 2026-08-20

import { PieChart } from "@mui/x-charts/PieChart";
import { DefaultChartsLegend } from "@mui/x-charts/ChartsLegend";

const t = window.ANYPLOT_TOKENS;

// Website traffic sources for a mid-size e-commerce site (share of visits, sums to 100)
const CATEGORIES = [
  { id: "organic-search", label: "Organic Search", value: 38 },
  { id: "direct", label: "Direct", value: 22 },
  { id: "social-media", label: "Social Media", value: 16 },
  { id: "referral", label: "Referral", value: 12 },
  { id: "paid-search", label: "Paid Search", value: 8 },
  { id: "email", label: "Email", value: 4 },
];

// Largest slice gets a slight pop-out for emphasis
const EXPLODED_ID = "organic-search";
const EXPLODE_OFFSET = 30;

const TITLE = "pie-basic · javascript · muix · anyplot.ai";
const TITLE_FONT_SIZE =
  TITLE.length > 67 ? Math.max(15, Math.round(22 * (67 / TITLE.length))) : 22;
const MARGIN = { top: 120, right: 60, bottom: 110, left: 60 };

// Per-slice arc-label fill chosen for WCAG contrast against each Imprint color
// (matches CATEGORIES order: green, lavender, blue, ochre, red, cyan).
const LABEL_FILLS = [
  "#1A1A17",
  "#1A1A17",
  "#FFFFFF",
  "#1A1A17",
  "#FFFFFF",
  "#1A1A17",
];

// The exploded slice lives in a second, appended series (see below), which
// would otherwise push it to the end of the auto-generated legend. Reorder
// the legend items to match the pie's clockwise slice order instead, so the
// exploded, most-important category ("Organic Search") leads the legend.
const LEGEND_ORDER = CATEGORIES.map((c) => c.id);
function OrderedLegend(props) {
  const ordered = [...props.seriesToDisplay].sort(
    (a, b) => LEGEND_ORDER.indexOf(a.itemId) - LEGEND_ORDER.indexOf(b.itemId),
  );
  return <DefaultChartsLegend {...props} seriesToDisplay={ordered} />;
}

export default function Chart() {
  const { width, height } = window.ANYPLOT_SIZE;
  const drawingWidth = width - MARGIN.left - MARGIN.right;
  const drawingHeight = height - MARGIN.top - MARGIN.bottom;
  const availableRadius = Math.min(drawingWidth, drawingHeight) / 2;
  const outerRadius = Math.round(availableRadius * 0.78);
  const centerX = drawingWidth / 2;
  const centerY = drawingHeight / 2;

  // Cumulative angle boundaries (deg) in data order, mirroring MUI X's internal
  // d3 pie generator (startAngle 0 = 12 o'clock, clockwise, no padding).
  const total = CATEGORIES.reduce((sum, c) => sum + c.value, 0);
  let cumulative = 0;
  const boundaries = CATEGORIES.map((c) => {
    const start = (cumulative / total) * 360;
    cumulative += c.value;
    const end = (cumulative / total) * 360;
    return { id: c.id, start, end };
  });
  const explodedBounds = boundaries.find((b) => b.id === EXPLODED_ID);
  const midAngle =
    ((explodedBounds.start + explodedBounds.end) / 2) * (Math.PI / 180);
  const offsetX = Math.sin(midAngle) * EXPLODE_OFFSET;
  const offsetY = -Math.cos(midAngle) * EXPLODE_OFFSET;

  // The main series carries all six slices so proportions stay correct, but the
  // exploded slice is painted transparent and dropped from the legend — a second,
  // single-item series re-draws it with its real color, offset outward, on top.
  const mainData = CATEGORIES.map((c) =>
    c.id === EXPLODED_ID
      ? { id: c.id, value: c.value, color: "transparent" }
      : { id: c.id, value: c.value, label: c.label },
  );
  const explodedCategory = CATEGORIES.find((c) => c.id === EXPLODED_ID);
  const explodedData = [
    {
      id: explodedCategory.id,
      value: explodedCategory.value,
      label: explodedCategory.label,
      color: t.palette[0],
    },
  ];

  // The main series suppresses the exploded slice's own (invisible) label so
  // only the offset overlay series shows its "38%" text.
  const mainArcLabel = (item) =>
    item.id === EXPLODED_ID ? "" : `${item.value}%`;
  const explodedArcLabel = (item) => `${item.value}%`;

  return (
    <div
      style={{
        position: "relative",
        width,
        height,
        fontFamily: "'Segoe UI', Roboto, 'Helvetica Neue', Arial, sans-serif",
      }}
    >
      {/* Title */}
      <div
        style={{
          position: "absolute",
          top: 20,
          left: 0,
          right: 0,
          textAlign: "center",
          fontSize: TITLE_FONT_SIZE,
          fontWeight: 600,
          color: t.ink,
          letterSpacing: "0.01em",
          lineHeight: 1.3,
        }}
      >
        {TITLE}
      </div>

      {/* Pie chart — Imprint palette, animation off */}
      <PieChart
        width={width}
        height={height}
        colors={t.palette}
        skipAnimation
        margin={MARGIN}
        slots={{ legend: OrderedLegend }}
        series={[
          {
            id: "main",
            data: mainData,
            paddingAngle: 0,
            cornerRadius: 2,
            outerRadius,
            arcLabel: mainArcLabel,
            arcLabelMinAngle: 6,
          },
          {
            id: "exploded",
            data: explodedData,
            paddingAngle: 0,
            cornerRadius: 2,
            outerRadius,
            startAngle: explodedBounds.start,
            endAngle: explodedBounds.end,
            cx: centerX + offsetX,
            cy: centerY + offsetY,
            arcLabel: explodedArcLabel,
            arcLabelMinAngle: 6,
          },
        ]}
        slotProps={{
          legend: {
            direction: "row",
            position: { vertical: "bottom", horizontal: "middle" },
            padding: 0,
            itemMarkWidth: 14,
            itemMarkHeight: 14,
            markGap: 6,
            itemGap: 20,
            labelStyle: { fontSize: 13, fill: t.ink },
          },
        }}
        sx={{
          "& .MuiPieArc-root": { stroke: t.pageBg, strokeWidth: 3 },
          "& .MuiPieArcLabel-root": { fontSize: 15, fontWeight: "bold" },
          "& .MuiPieArcLabel-root:nth-child(1)": { fill: LABEL_FILLS[0] },
          "& .MuiPieArcLabel-root:nth-child(2)": { fill: LABEL_FILLS[1] },
          "& .MuiPieArcLabel-root:nth-child(3)": { fill: LABEL_FILLS[2] },
          "& .MuiPieArcLabel-root:nth-child(4)": { fill: LABEL_FILLS[3] },
          "& .MuiPieArcLabel-root:nth-child(5)": { fill: LABEL_FILLS[4] },
          "& .MuiPieArcLabel-root:nth-child(6)": { fill: LABEL_FILLS[5] },
        }}
      />
    </div>
  );
}
Runnable source as JSON, for any HTTP client: https://api.anyplot.ai/specs/pie-basic/muix/code. Any spec id and library id listed in llms-full.txt fit the same URL shape; every URL below is complete and callable.
{
  "spec_id": "pie-basic",
  "language": "javascript",
  "library": "muix",
  "page": "https://anyplot.ai/pie-basic/javascript/muix",
  "hub": "https://anyplot.ai/pie-basic",
  "code_json": "https://api.anyplot.ai/specs/pie-basic/muix/code",
  "spec_json": "https://api.anyplot.ai/specs/pie-basic",
  "render_light_png": "https://storage.googleapis.com/anyplot-images/plots/pie-basic/javascript/muix/plot-light.png",
  "render_dark_png": "https://storage.googleapis.com/anyplot-images/plots/pie-basic/javascript/muix/plot-dark.png",
  "interactive_light_html": "https://storage.googleapis.com/anyplot-images/plots/pie-basic/javascript/muix/plot-light.html",
  "interactive_dark_html": "https://storage.googleapis.com/anyplot-images/plots/pie-basic/javascript/muix/plot-dark.html",
  "quality_score": 89.0,
  "license": "MIT",
  "guide": "https://anyplot.ai/llms.txt"
}
Part of Basic Pie Chart on anyplot.ai.