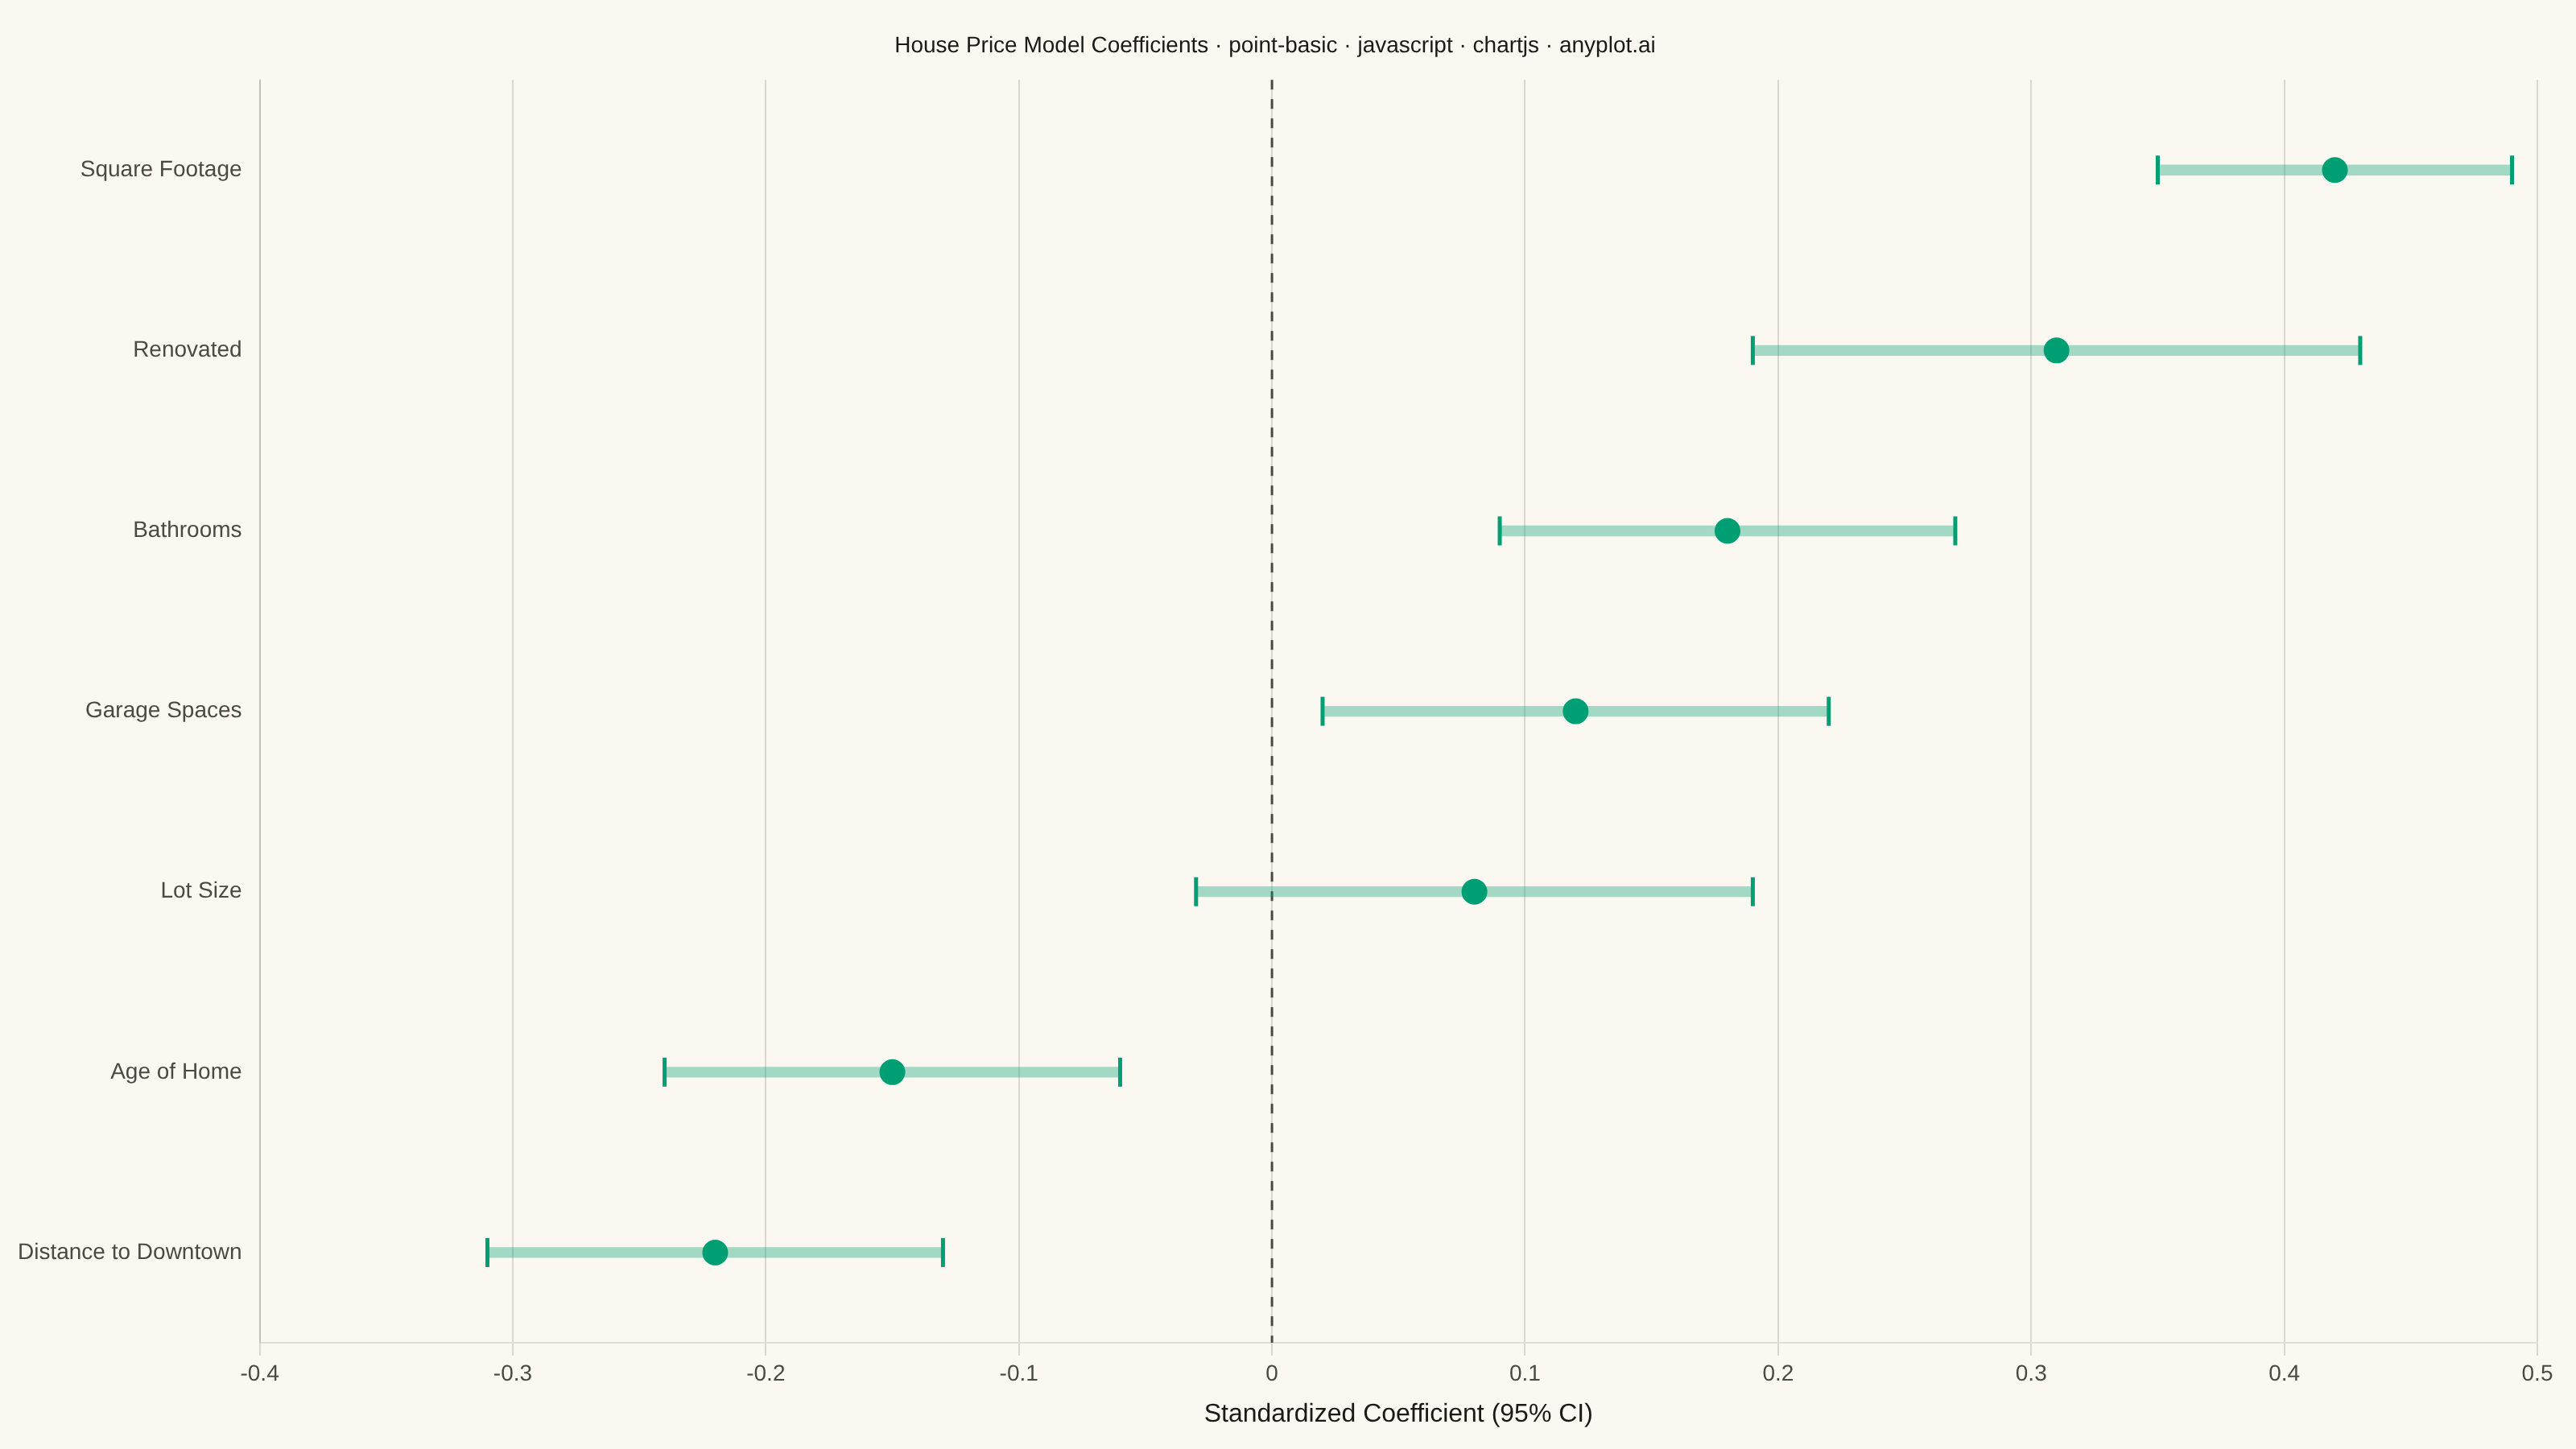
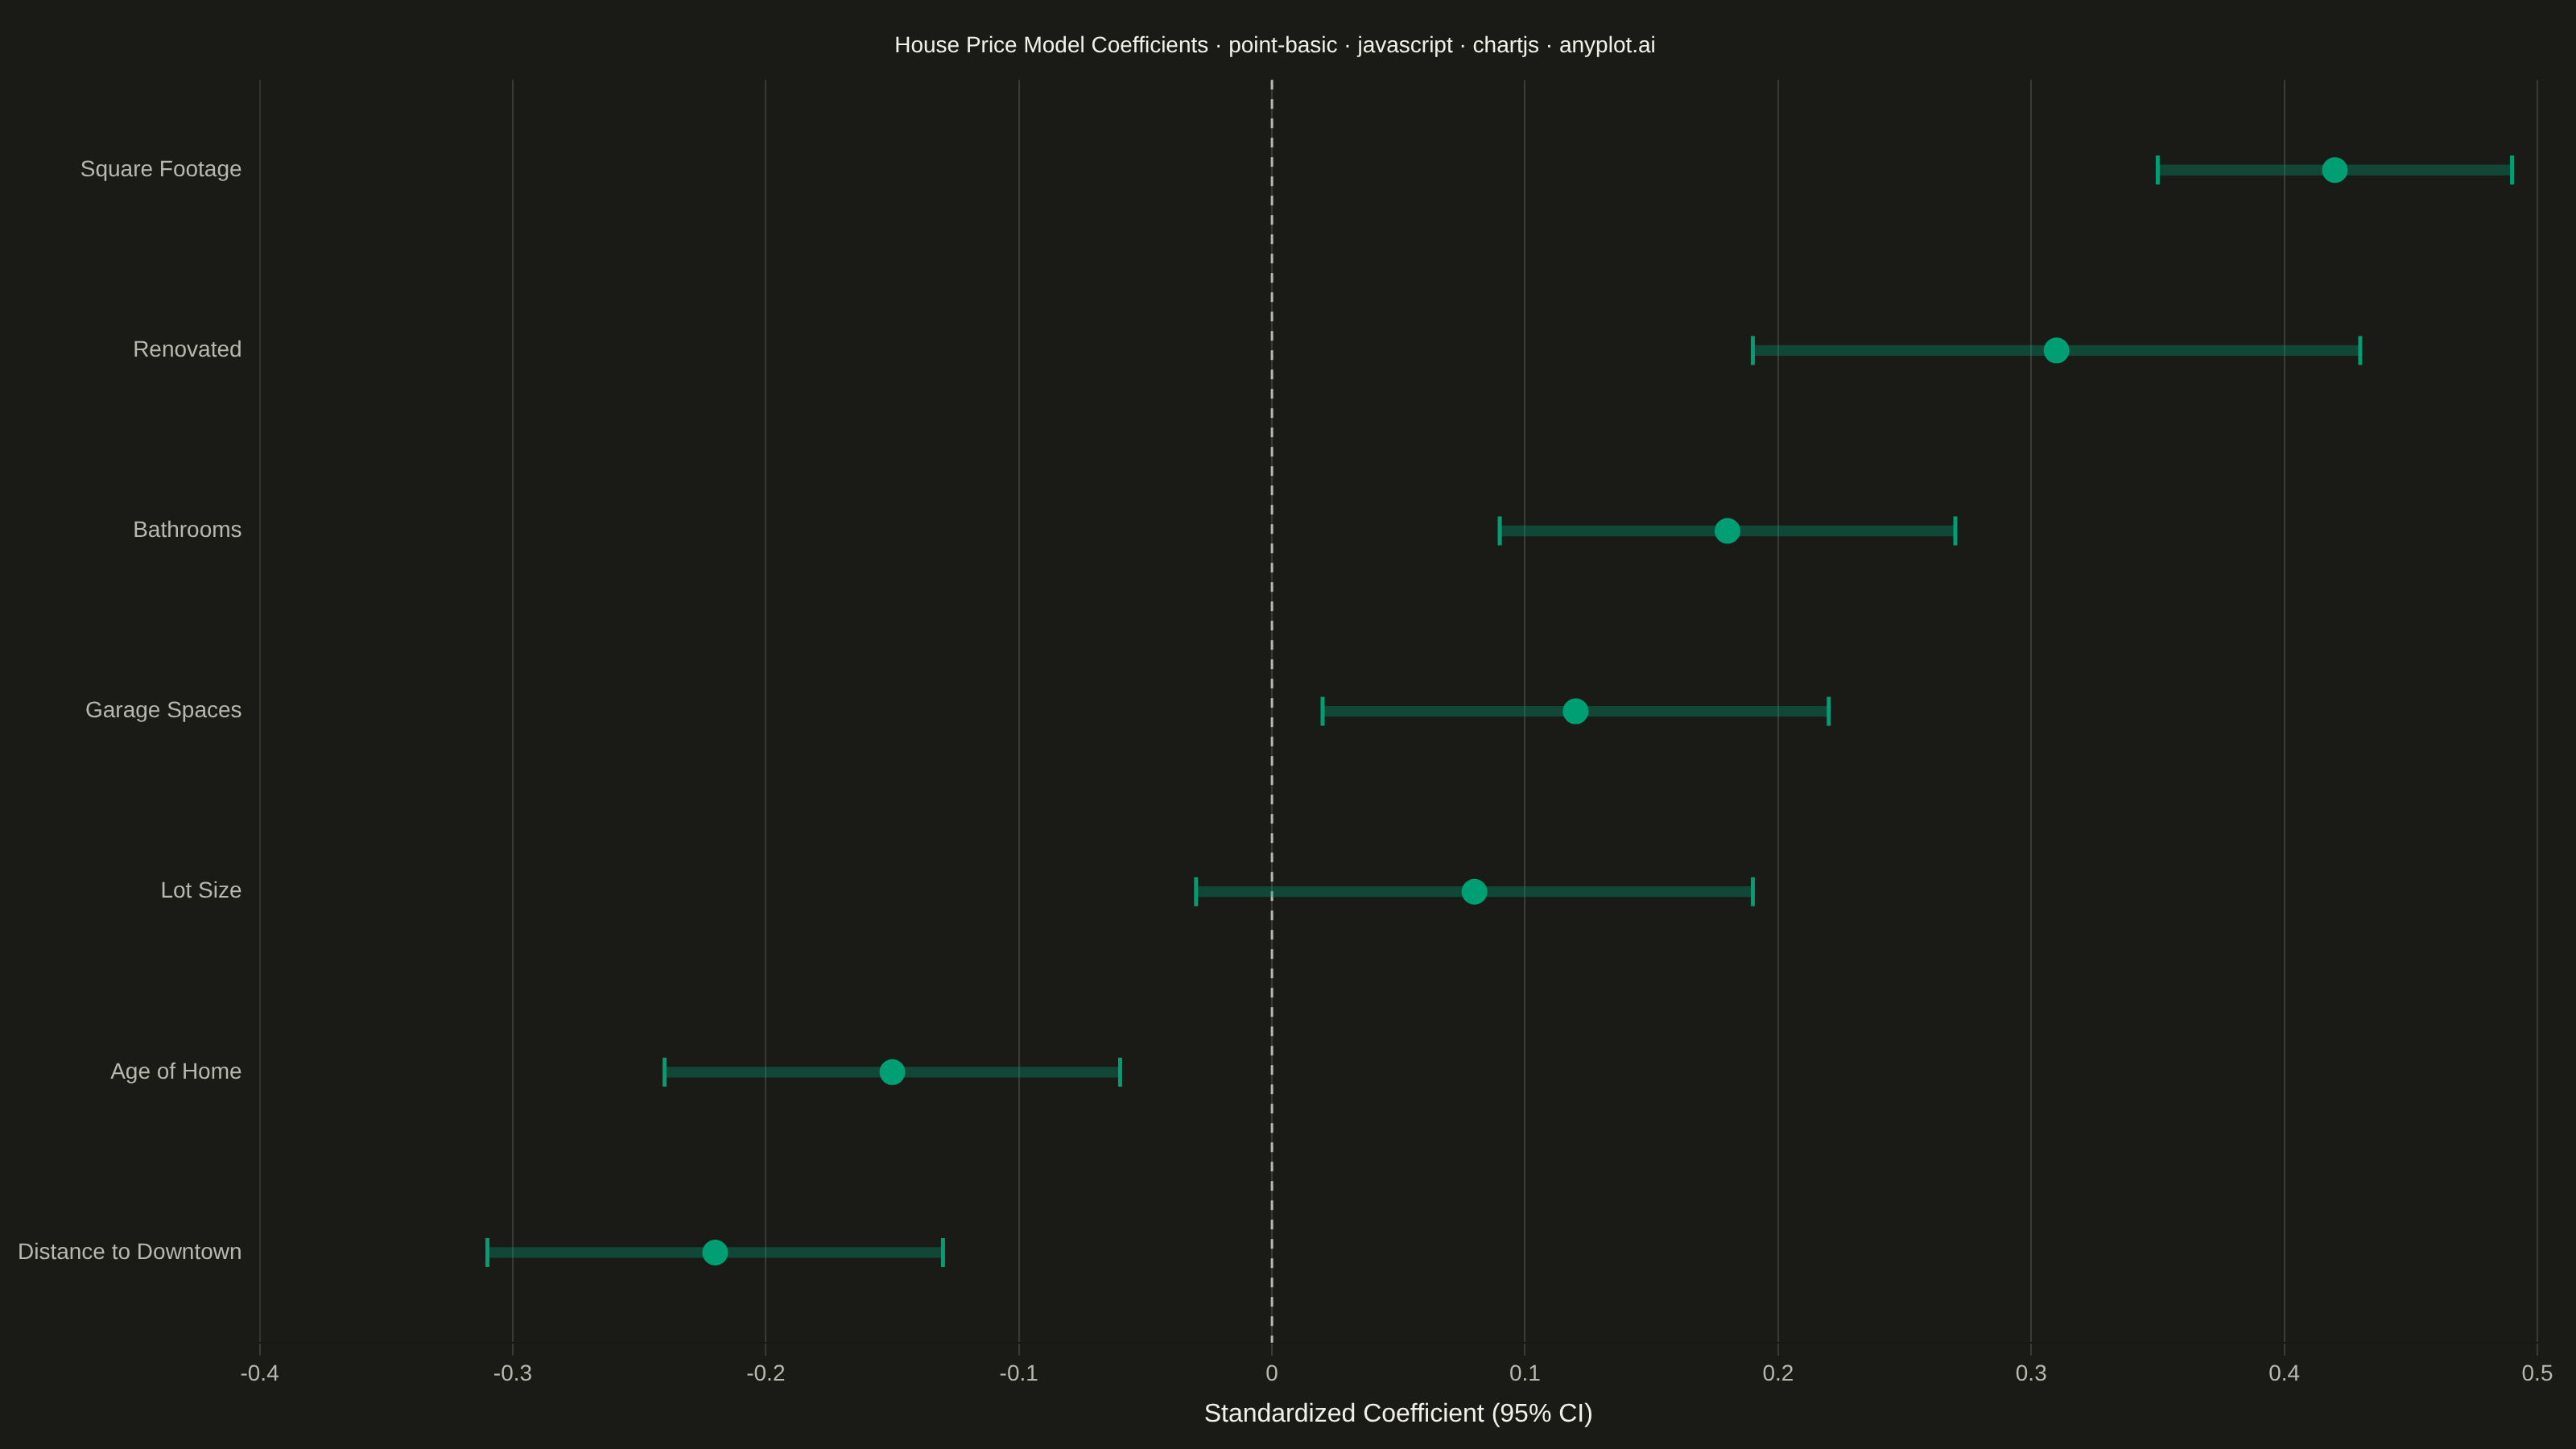
The same plot in 14 other libraries — JavaScript: D3.js, Apache ECharts, Highcharts, MUI X Charts; Python: Altair, Bokeh, lets-plot, Matplotlib, Plotly, plotnine, Pygal, Seaborn; R: ggplot2; Julia: Makie.jl. Compare all 15 side by side: Point Estimate Plot in Python, R, Julia and JavaScript.
A point estimate plot displays central tendency values (means, medians, or other estimates) with confidence intervals or error bars for each category. Each point represents the estimate, and the lines extending from it show the uncertainty range.
// anyplot.ai
// point-basic: Point Estimate Plot
// Library: chartjs 4.4.7 | JavaScript 22.23.2
// Quality: 91/100 | Created: 2026-09-05

const t = window.ANYPLOT_TOKENS;

// --- Data (in-memory, deterministic) ---------------------------------------
// Standardized regression coefficients predicting home sale price, with 95%
// confidence intervals. Sorted by effect size so the strongest positive
// predictor sits on top, mirroring a typical forest-plot reading order.
const coefficients = [
  { predictor: "Square Footage", estimate: 0.42, lower: 0.35, upper: 0.49 },
  { predictor: "Renovated", estimate: 0.31, lower: 0.19, upper: 0.43 },
  { predictor: "Bathrooms", estimate: 0.18, lower: 0.09, upper: 0.27 },
  { predictor: "Garage Spaces", estimate: 0.12, lower: 0.02, upper: 0.22 },
  { predictor: "Lot Size", estimate: 0.08, lower: -0.03, upper: 0.19 },
  { predictor: "Age of Home", estimate: -0.15, lower: -0.24, upper: -0.06 },
  { predictor: "Distance to Downtown", estimate: -0.22, lower: -0.31, upper: -0.13 },
];

const labels = coefficients.map((d) => d.predictor);

const withAlpha = (hex, alpha) => {
  const r = parseInt(hex.slice(1, 3), 16);
  const g = parseInt(hex.slice(3, 5), 16);
  const b = parseInt(hex.slice(5, 7), 16);
  return `rgba(${r}, ${g}, ${b}, ${alpha})`;
};

// --- Title (length-scaled per anyplot title rules) -------------------------
const title = "House Price Model Coefficients · point-basic · javascript · chartjs · anyplot.ai";
const titleFontSize = title.length > 67 ? Math.max(14, Math.round(22 * (67 / title.length))) : 22;

// --- Custom draw plugins (native Chart.js plugin API, no external deps) ----
// Dashed reference line at the null-effect value (x = 0).
const referenceLinePlugin = {
  id: "referenceLine",
  beforeDatasetsDraw(chart) {
    const { ctx, chartArea, scales } = chart;
    const xZero = scales.x.getPixelForValue(0);
    if (xZero < chartArea.left || xZero > chartArea.right) return;
    ctx.save();
    ctx.strokeStyle = t.inkSoft;
    ctx.lineWidth = 1.5;
    ctx.setLineDash([6, 6]);
    ctx.beginPath();
    ctx.moveTo(xZero, chartArea.top);
    ctx.lineTo(xZero, chartArea.bottom);
    ctx.stroke();
    ctx.restore();
  },
};

// Caps at each confidence-interval endpoint, derived from the floating bar's
// real pixel bounds (chart.getDatasetMeta), not decorative marks.
const errorCapsPlugin = {
  id: "errorCaps",
  afterDatasetsDraw(chart) {
    const meta = chart.getDatasetMeta(0);
    const ctx = chart.ctx;
    const capHalf = 9;
    ctx.save();
    ctx.strokeStyle = t.palette[0];
    ctx.lineWidth = 2.5;
    meta.data.forEach((bar) => {
      [bar.x, bar.base].forEach((px) => {
        ctx.beginPath();
        ctx.moveTo(px, bar.y - capHalf);
        ctx.lineTo(px, bar.y + capHalf);
        ctx.stroke();
      });
    });
    ctx.restore();
  },
};

// --- Mount -------------------------------------------------------------------
const canvas = document.createElement("canvas");
document.getElementById("container").appendChild(canvas);

// --- Chart (mixed bar + line: floating bar draws the CI, line draws the point estimate marker only)
new Chart(canvas, {
  data: {
    labels,
    datasets: [
      {
        type: "bar",
        label: "95% CI",
        data: coefficients.map((d) => [d.lower, d.upper]),
        backgroundColor: withAlpha(t.palette[0], 0.35),
        barThickness: 6,
        borderWidth: 0,
      },
      {
        type: "line",
        label: "Estimate",
        data: coefficients.map((d) => d.estimate),
        showLine: false,
        pointStyle: "circle",
        pointRadius: 9,
        pointBackgroundColor: t.palette[0],
        pointBorderColor: t.pageBg,
        pointBorderWidth: 2,
      },
    ],
  },
  options: {
    indexAxis: "y",
    responsive: true,
    maintainAspectRatio: false,
    animation: false,
    layout: { padding: { top: 8, right: 24, bottom: 8, left: 8 } },
    plugins: {
      title: { display: true, text: title, color: t.ink, font: { size: titleFontSize, weight: "medium" } },
      legend: { display: false },
    },
    scales: {
      x: {
        title: { display: true, text: "Standardized Coefficient (95% CI)", color: t.ink, font: { size: 16 } },
        ticks: { color: t.inkSoft, font: { size: 14 } },
        grid: { color: t.grid },
      },
      y: {
        ticks: { color: t.inkSoft, font: { size: 14 } },
        grid: { display: false },
      },
    },
  },
  plugins: [referenceLinePlugin, errorCapsPlugin],
});
Runnable source as JSON, for any HTTP client: https://api.anyplot.ai/specs/point-basic/chartjs/code. Any spec id and library id listed in llms-full.txt fit the same URL shape; every URL below is complete and callable.
{
  "spec_id": "point-basic",
  "language": "javascript",
  "library": "chartjs",
  "page": "https://anyplot.ai/point-basic/javascript/chartjs",
  "hub": "https://anyplot.ai/point-basic",
  "code_json": "https://api.anyplot.ai/specs/point-basic/chartjs/code",
  "spec_json": "https://api.anyplot.ai/specs/point-basic",
  "render_light_png": "https://storage.googleapis.com/anyplot-images/plots/point-basic/javascript/chartjs/plot-light.png",
  "render_dark_png": "https://storage.googleapis.com/anyplot-images/plots/point-basic/javascript/chartjs/plot-dark.png",
  "interactive_light_html": "https://storage.googleapis.com/anyplot-images/plots/point-basic/javascript/chartjs/plot-light.html",
  "interactive_dark_html": "https://storage.googleapis.com/anyplot-images/plots/point-basic/javascript/chartjs/plot-dark.html",
  "quality_score": 91.0,
  "license": "MIT",
  "guide": "https://anyplot.ai/llms.txt"
}
Part of Point Estimate Plot on anyplot.ai.