The same plot in 14 other libraries — Python: Altair, Bokeh, lets-plot, Matplotlib, Plotly, plotnine, Pygal, Seaborn; Julia: Makie.jl; JavaScript: Chart.js, D3.js, Apache ECharts, Highcharts, MUI X Charts. Compare all 15 side by side: Point Estimate Plot in Python, R, Julia and JavaScript.
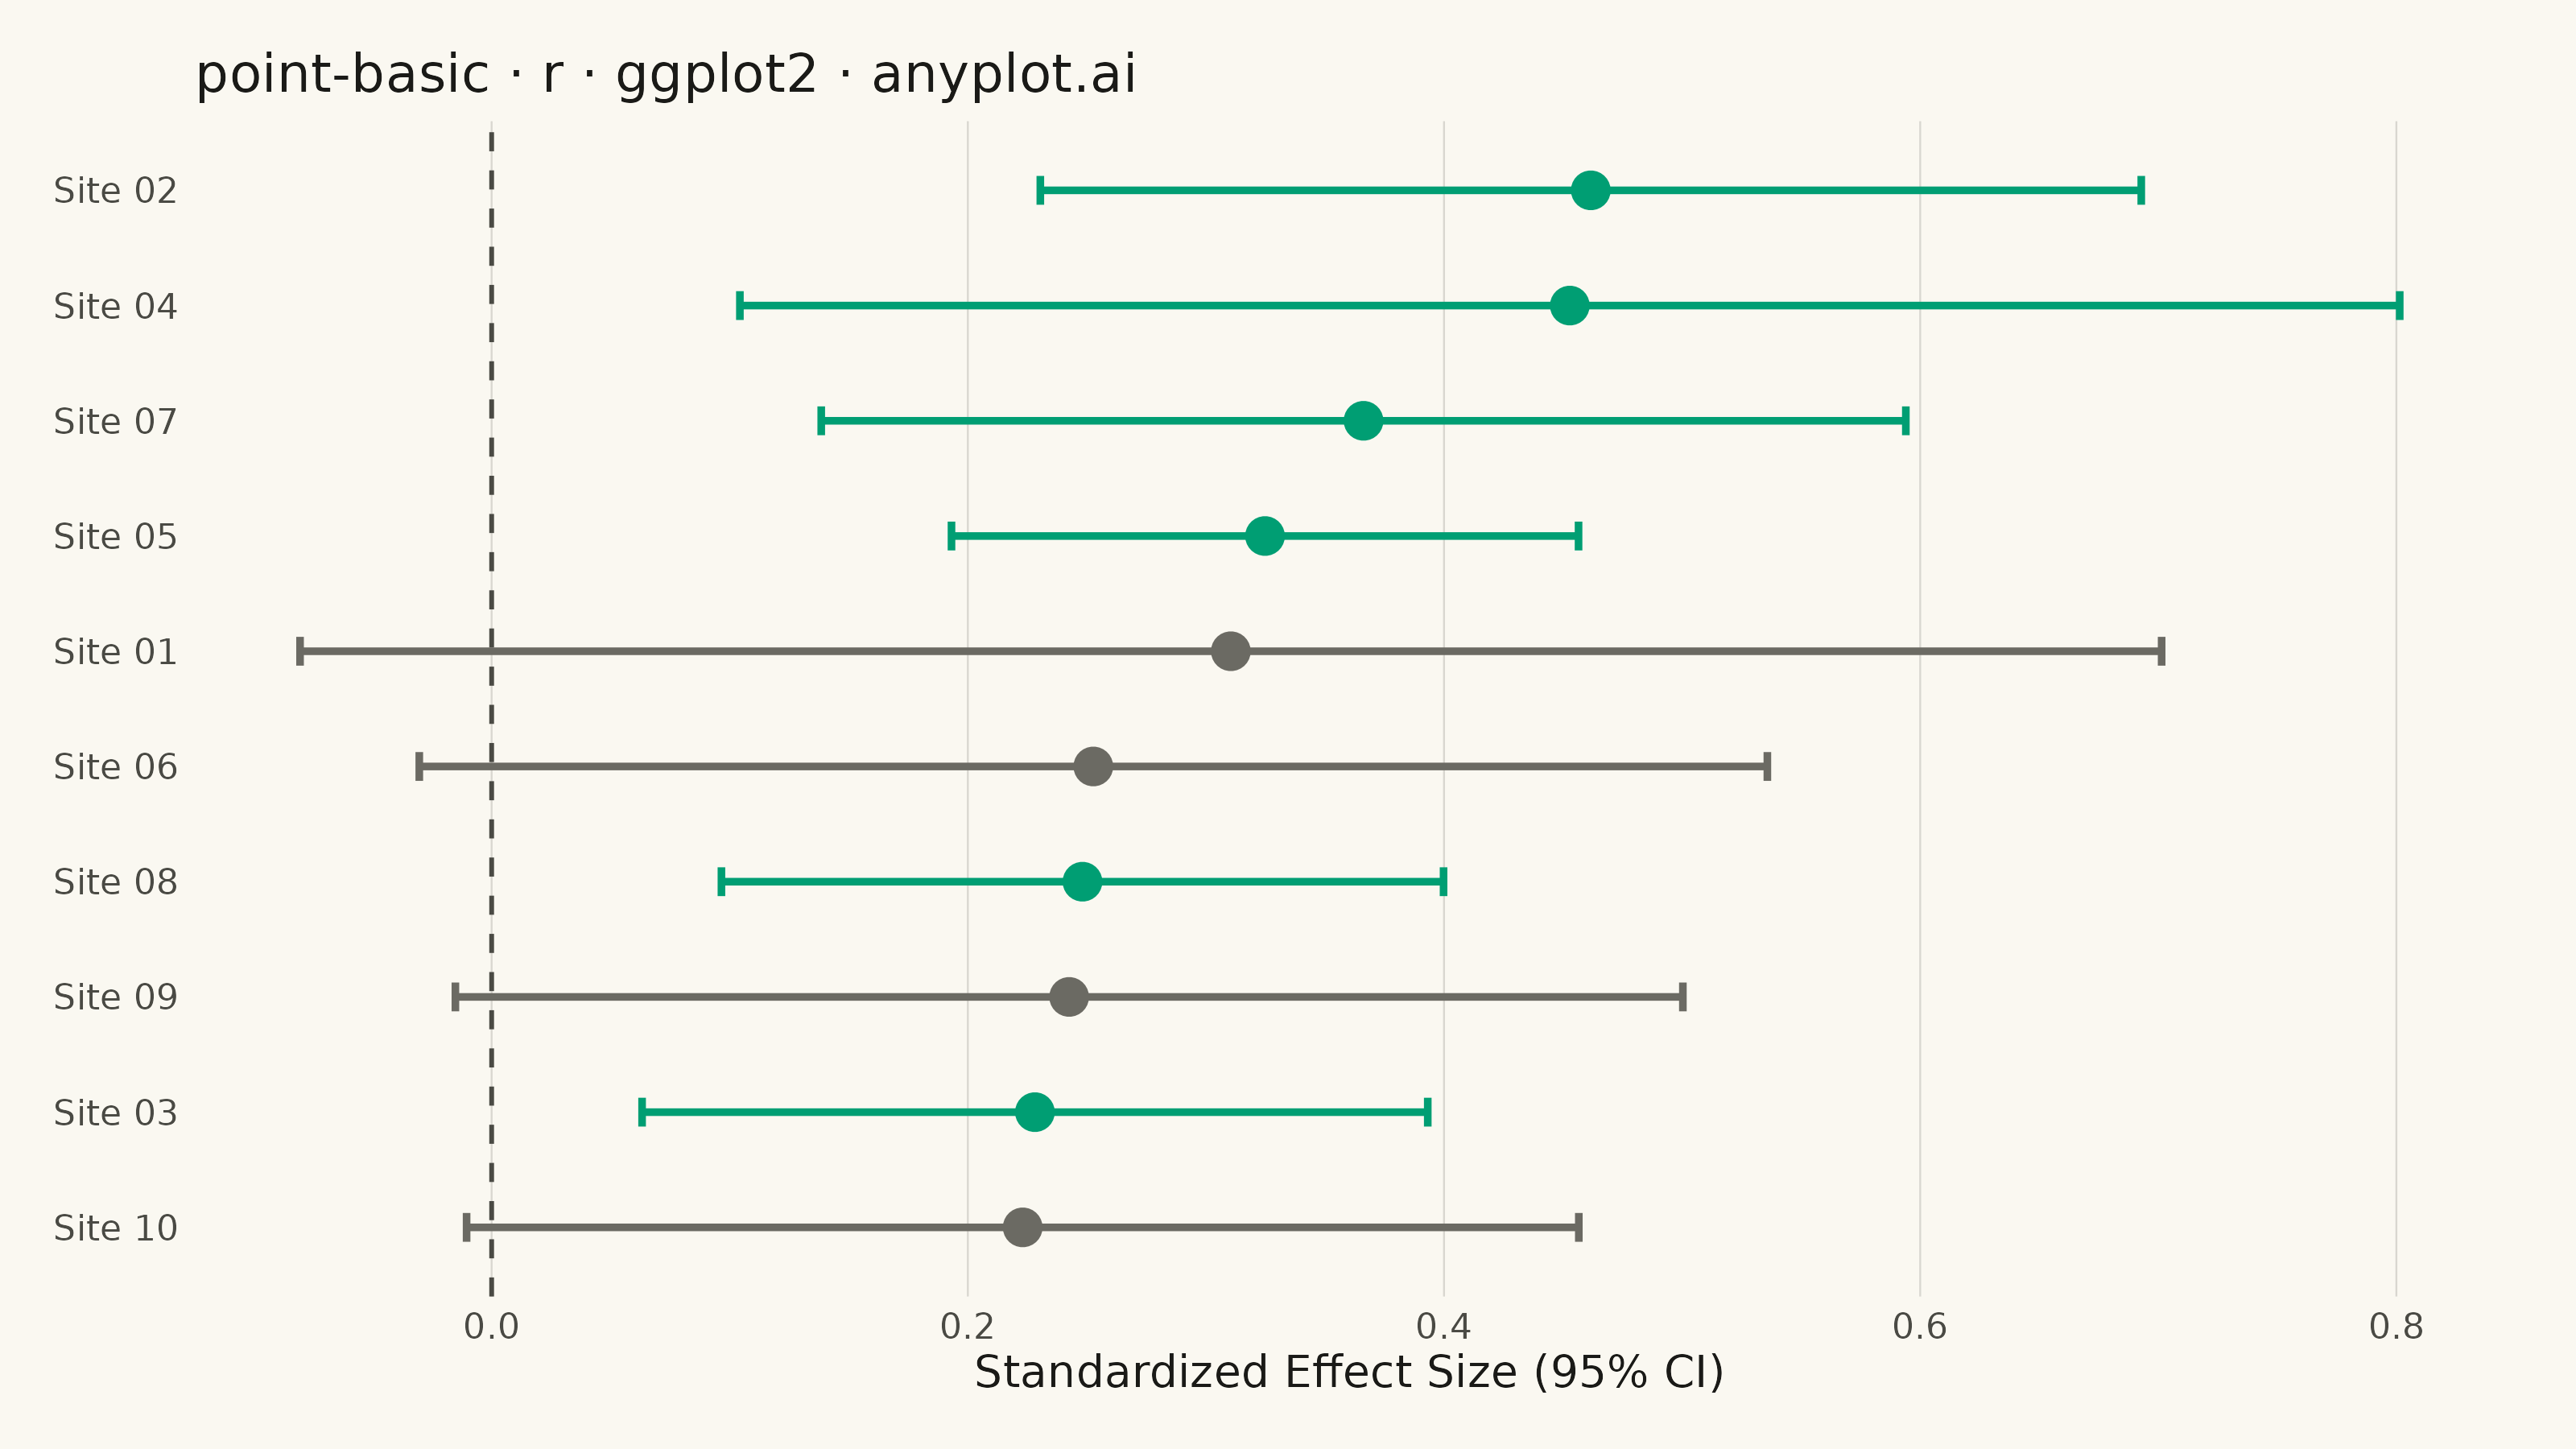
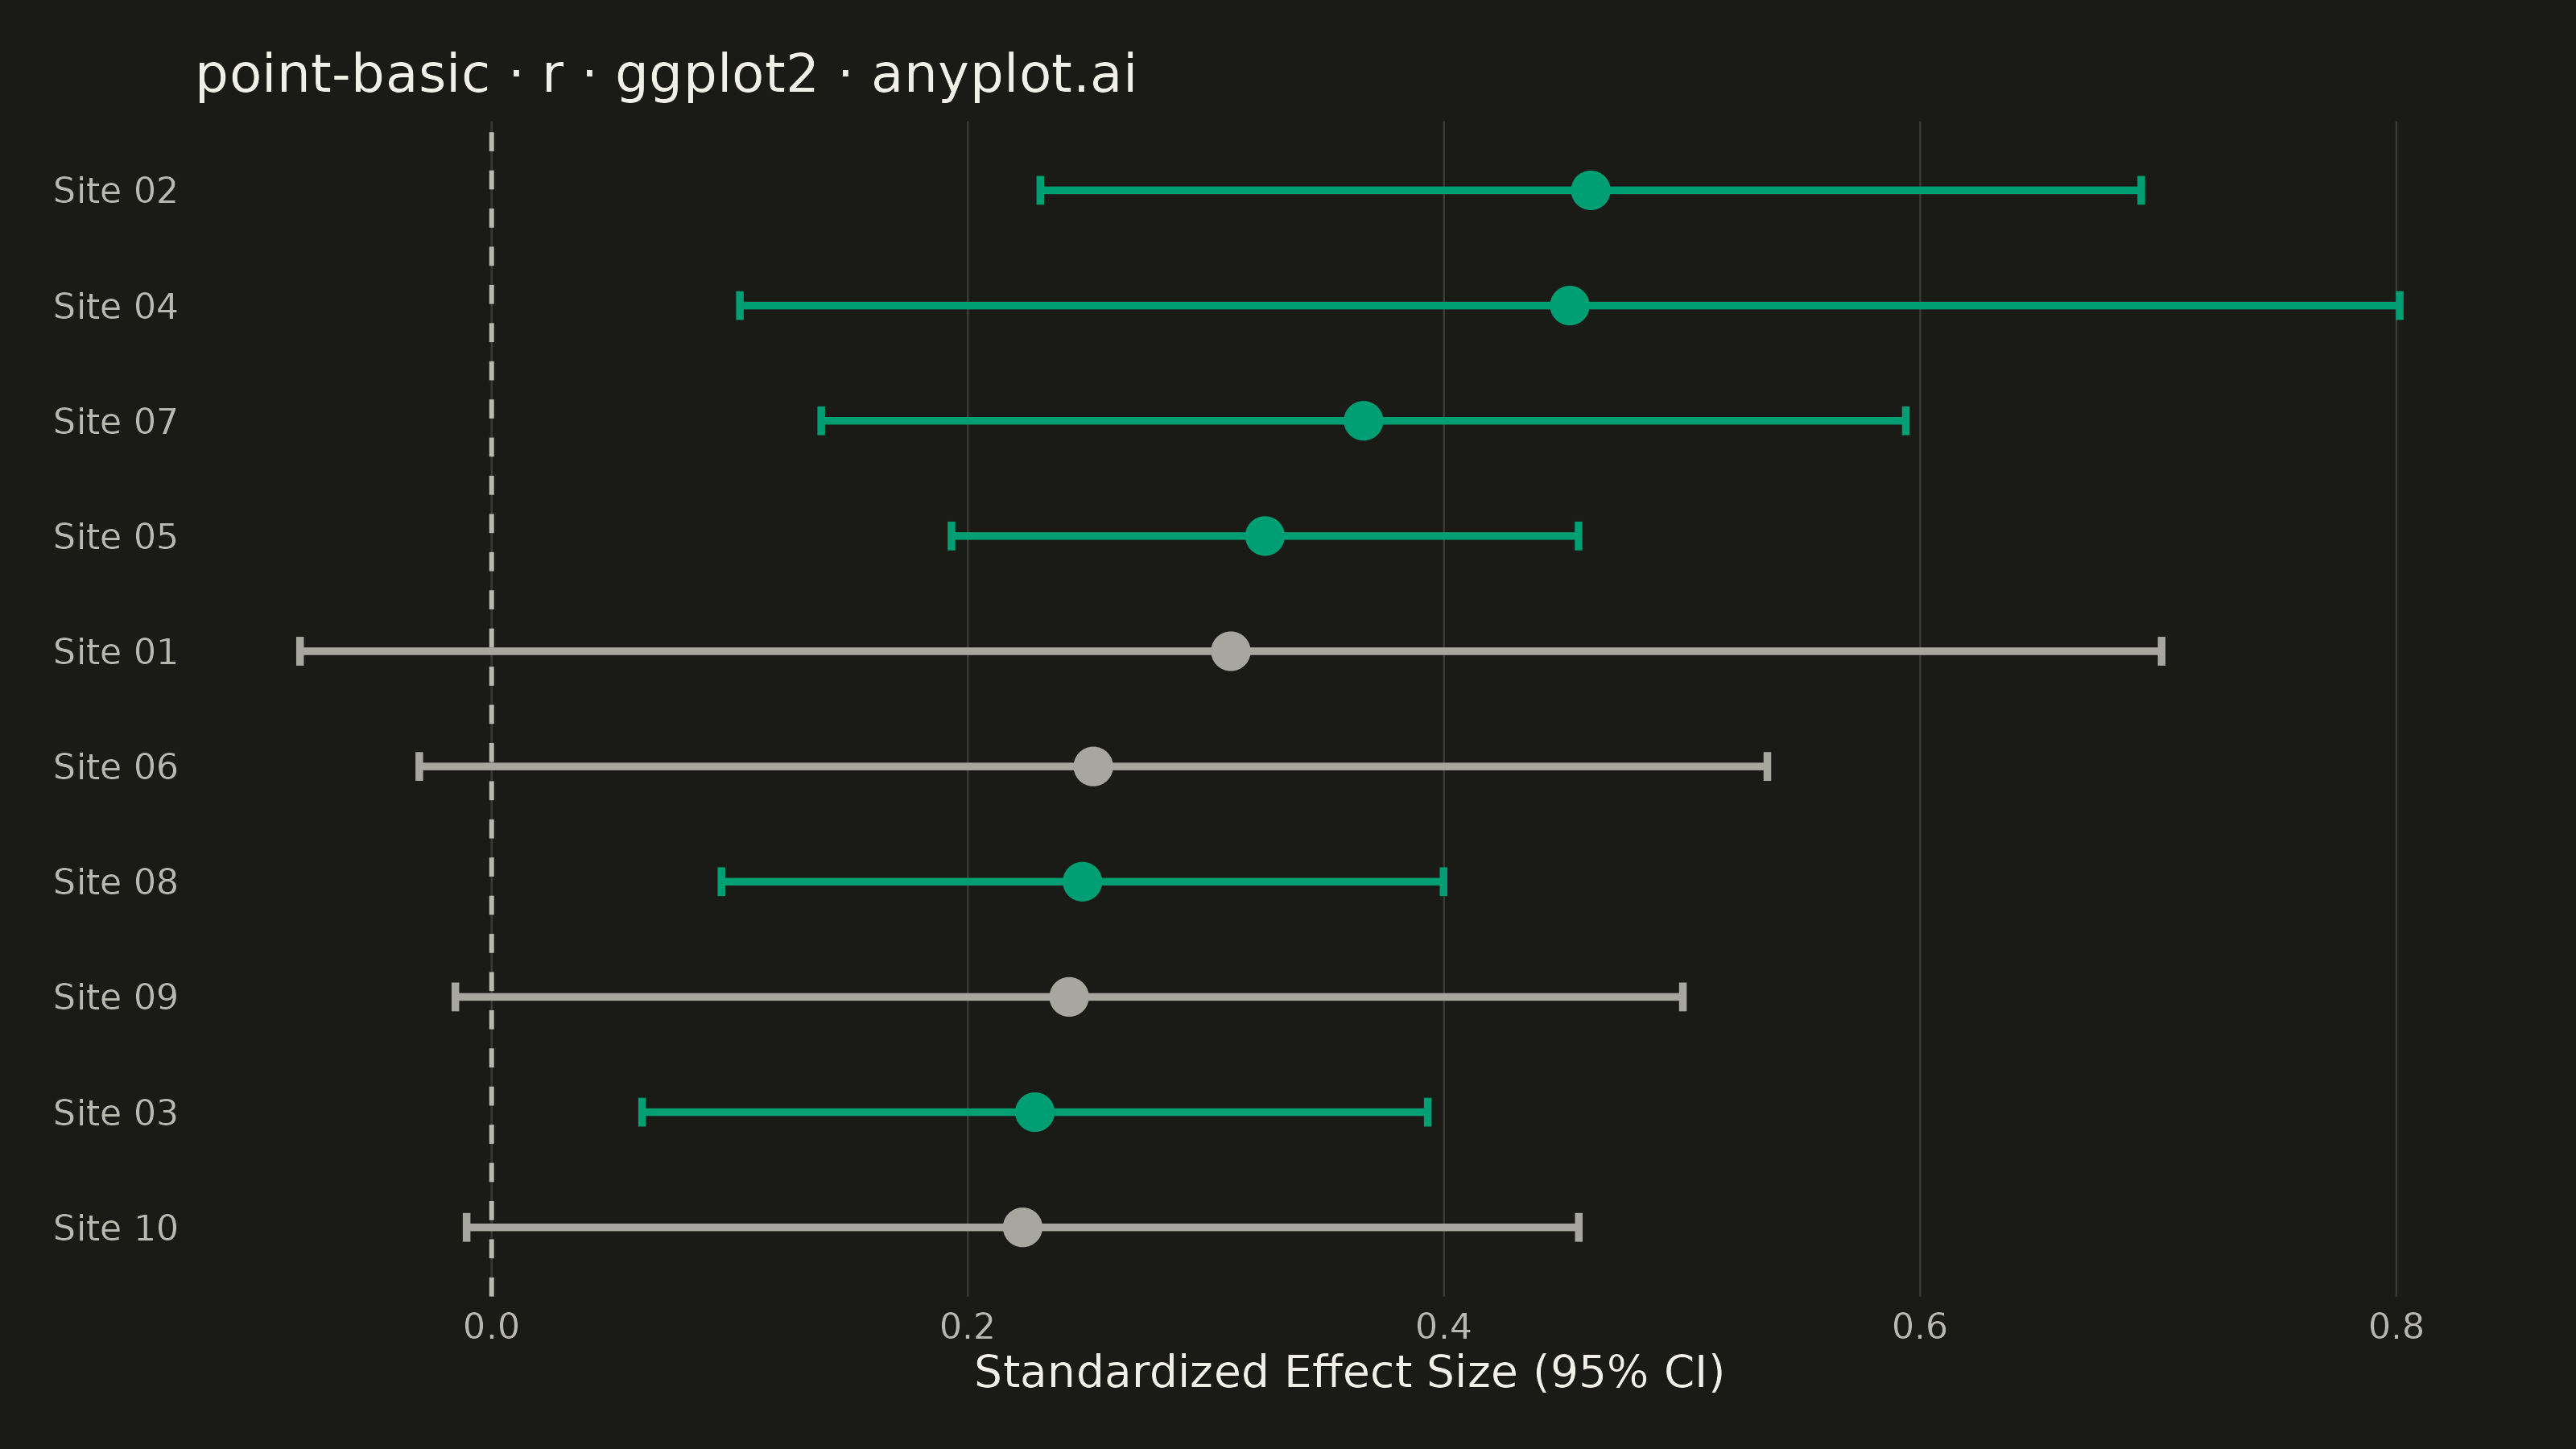
A point estimate plot displays central tendency values (means, medians, or other estimates) with confidence intervals or error bars for each category. Each point represents the estimate, and the lines extending from it show the uncertainty range.
#' anyplot.ai
#' point-basic: Point Estimate Plot
#' Library: ggplot2 3.5.1 | R 4.4.1
#' Quality: 93/100 | Created: 2026-09-05

library(ggplot2)
library(dplyr)
library(ragg)

set.seed(42)

# --- Theme tokens -------------------------------------------------------
THEME    <- Sys.getenv("ANYPLOT_THEME", "light")
PAGE_BG  <- if (THEME == "light") "#FAF8F1" else "#1A1A17"
INK      <- if (THEME == "light") "#1A1A17" else "#F0EFE8"
INK_SOFT <- if (THEME == "light") "#4A4A44" else "#B8B7B0"
MUTED    <- if (THEME == "light") "#6B6A63" else "#A8A79F" # semantic anchor — not statistically significant
GRID_COL <- paste0(INK, "26") # ~15% opacity tint, per style-guide subtle-grid guidance
BRAND    <- "#009E73" # Imprint palette position 1 — ALWAYS first series

# --- Data -----------------------------------------------------------------
# Simulated standardized mean difference (effect size) from a multi-site
# clinical trial. Each site draws its own sample, so the 95% CI width varies
# naturally with sample size rather than being hand-picked.
sites <- sprintf("Site %02d", 1:10)
n_per_site <- c(40, 65, 120, 30, 200, 55, 90, 150, 45, 75)
true_effect <- 0.35

trial_results <- lapply(seq_along(sites), function(i) {
  n <- n_per_site[i]
  sample_effect <- rnorm(n, mean = true_effect, sd = 1)
  se <- sd(sample_effect) / sqrt(n)
  estimate <- mean(sample_effect)
  tibble::tibble(
    site = sites[i],
    estimate = estimate,
    lower_bound = estimate - qt(0.975, df = n - 1) * se,
    upper_bound = estimate + qt(0.975, df = n - 1) * se
  )
})

df <- bind_rows(trial_results) %>%
  arrange(estimate) %>%
  mutate(
    site = factor(site, levels = site),
    significant = lower_bound > 0 | upper_bound < 0,
    point_color = if_else(significant, BRAND, MUTED)
  )

# --- Plot -------------------------------------------------------------------
p <- ggplot(df, aes(x = estimate, y = site)) +
  geom_vline(xintercept = 0, linetype = "dashed", linewidth = 0.5, color = INK_SOFT) +
  geom_errorbar(
    aes(xmin = lower_bound, xmax = upper_bound, color = point_color),
    orientation = "y", width = 0.25, linewidth = 0.8
  ) +
  geom_point(aes(color = point_color), size = 3.5) +
  scale_color_identity() +
  labs(
    x = "Standardized Effect Size (95% CI)",
    y = NULL,
    title = "point-basic · r · ggplot2 · anyplot.ai"
  ) +
  theme_minimal(base_size = 8) +
  theme(
    plot.background   = element_rect(fill = PAGE_BG, color = PAGE_BG),
    panel.background  = element_rect(fill = PAGE_BG, color = NA),
    panel.grid.major.y = element_blank(),
    panel.grid.minor  = element_blank(),
    panel.grid.major.x = element_line(color = GRID_COL, linewidth = 0.2),
    axis.title        = element_text(color = INK, size = 10),
    axis.text         = element_text(color = INK_SOFT, size = 8),
    axis.ticks        = element_blank(),
    plot.title        = element_text(color = INK, size = 12),
    plot.margin       = margin(12, 16, 12, 12)
  )

# --- Save -------------------------------------------------------------------
ggsave(
  filename = sprintf("plot-%s.png", THEME),
  plot     = p,
  device   = ragg::agg_png,
  width    = 8,
  height   = 4.5,
  units    = "in",
  dpi      = 400
)
Runnable source as JSON, for any HTTP client: https://api.anyplot.ai/specs/point-basic/ggplot2/code. Any spec id and library id listed in llms-full.txt fit the same URL shape; every URL below is complete and callable.
{
  "spec_id": "point-basic",
  "language": "r",
  "library": "ggplot2",
  "page": "https://anyplot.ai/point-basic/r/ggplot2",
  "hub": "https://anyplot.ai/point-basic",
  "code_json": "https://api.anyplot.ai/specs/point-basic/ggplot2/code",
  "spec_json": "https://api.anyplot.ai/specs/point-basic",
  "render_light_png": "https://storage.googleapis.com/anyplot-images/plots/point-basic/r/ggplot2/plot-light.png",
  "render_dark_png": "https://storage.googleapis.com/anyplot-images/plots/point-basic/r/ggplot2/plot-dark.png",
  "quality_score": 93.0,
  "license": "MIT",
  "guide": "https://anyplot.ai/llms.txt"
}
Part of Point Estimate Plot on anyplot.ai.