The same plot in 14 other libraries — JavaScript: Chart.js, D3.js, Highcharts, MUI X Charts; Python: Altair, Bokeh, lets-plot, Matplotlib, Plotly, plotnine, Pygal, Seaborn; R: ggplot2; Julia: Makie.jl. Compare all 15 side by side: Point Estimate Plot in Python, R, Julia and JavaScript.
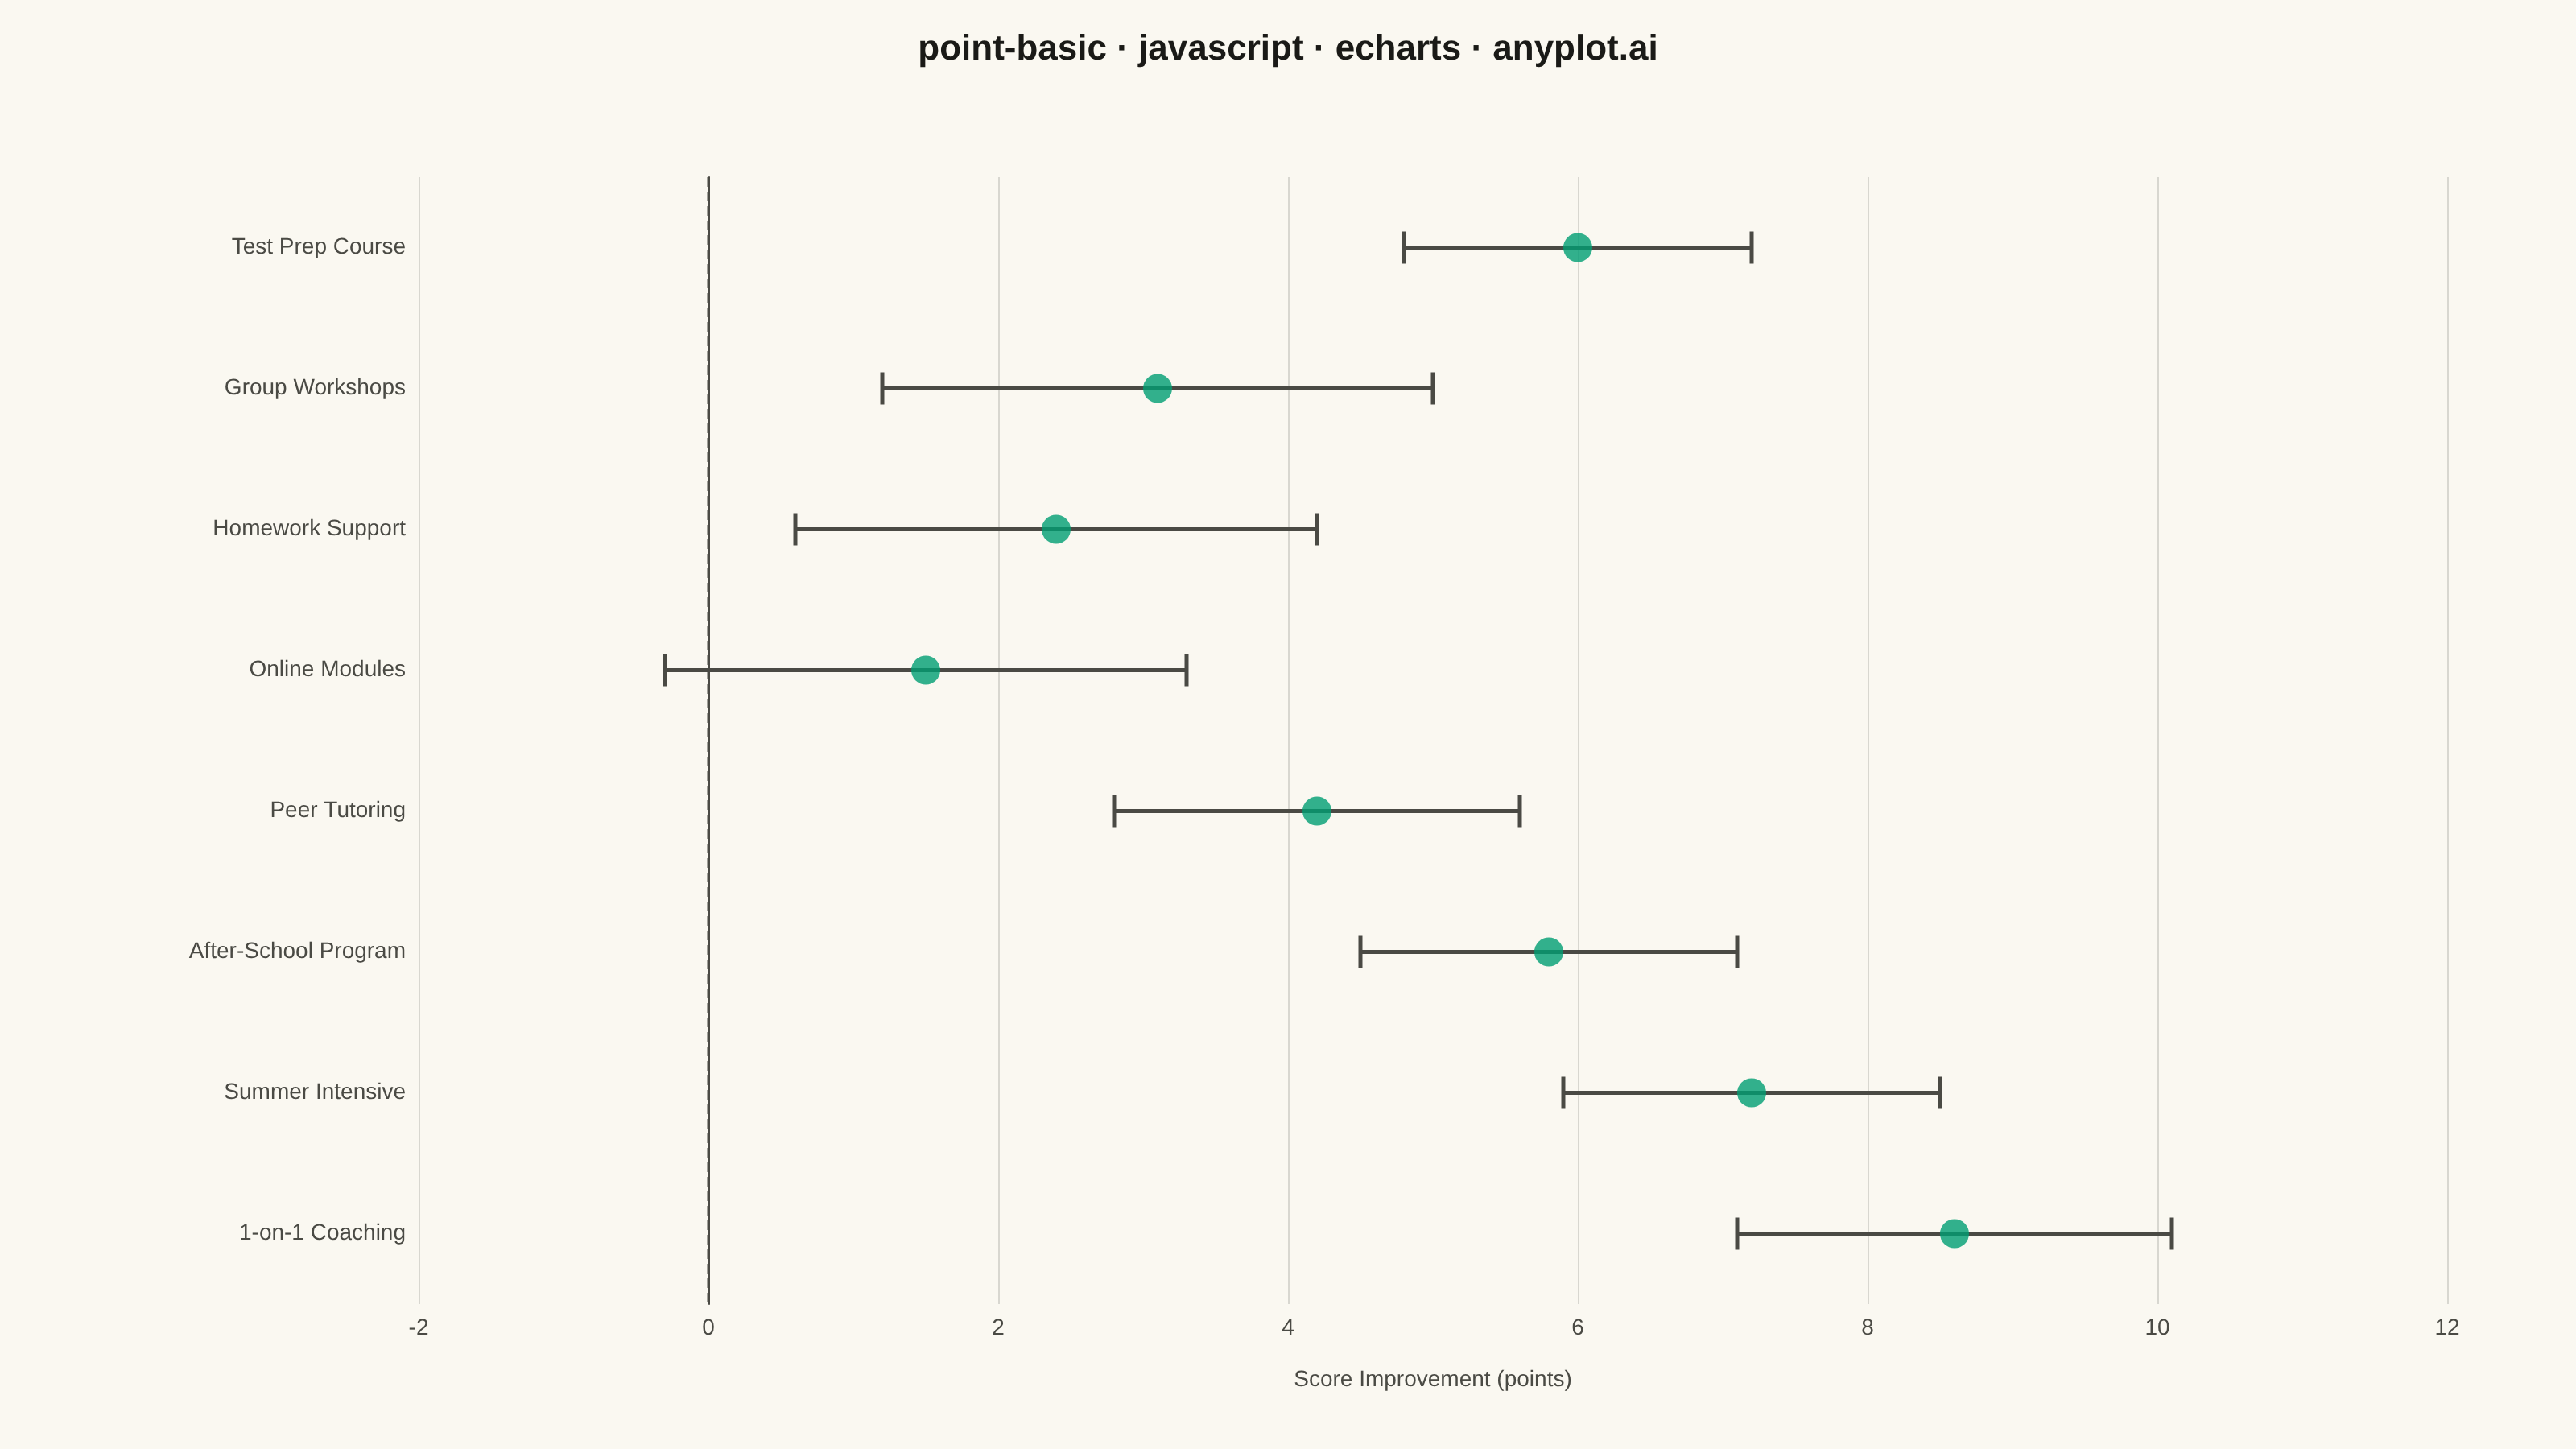
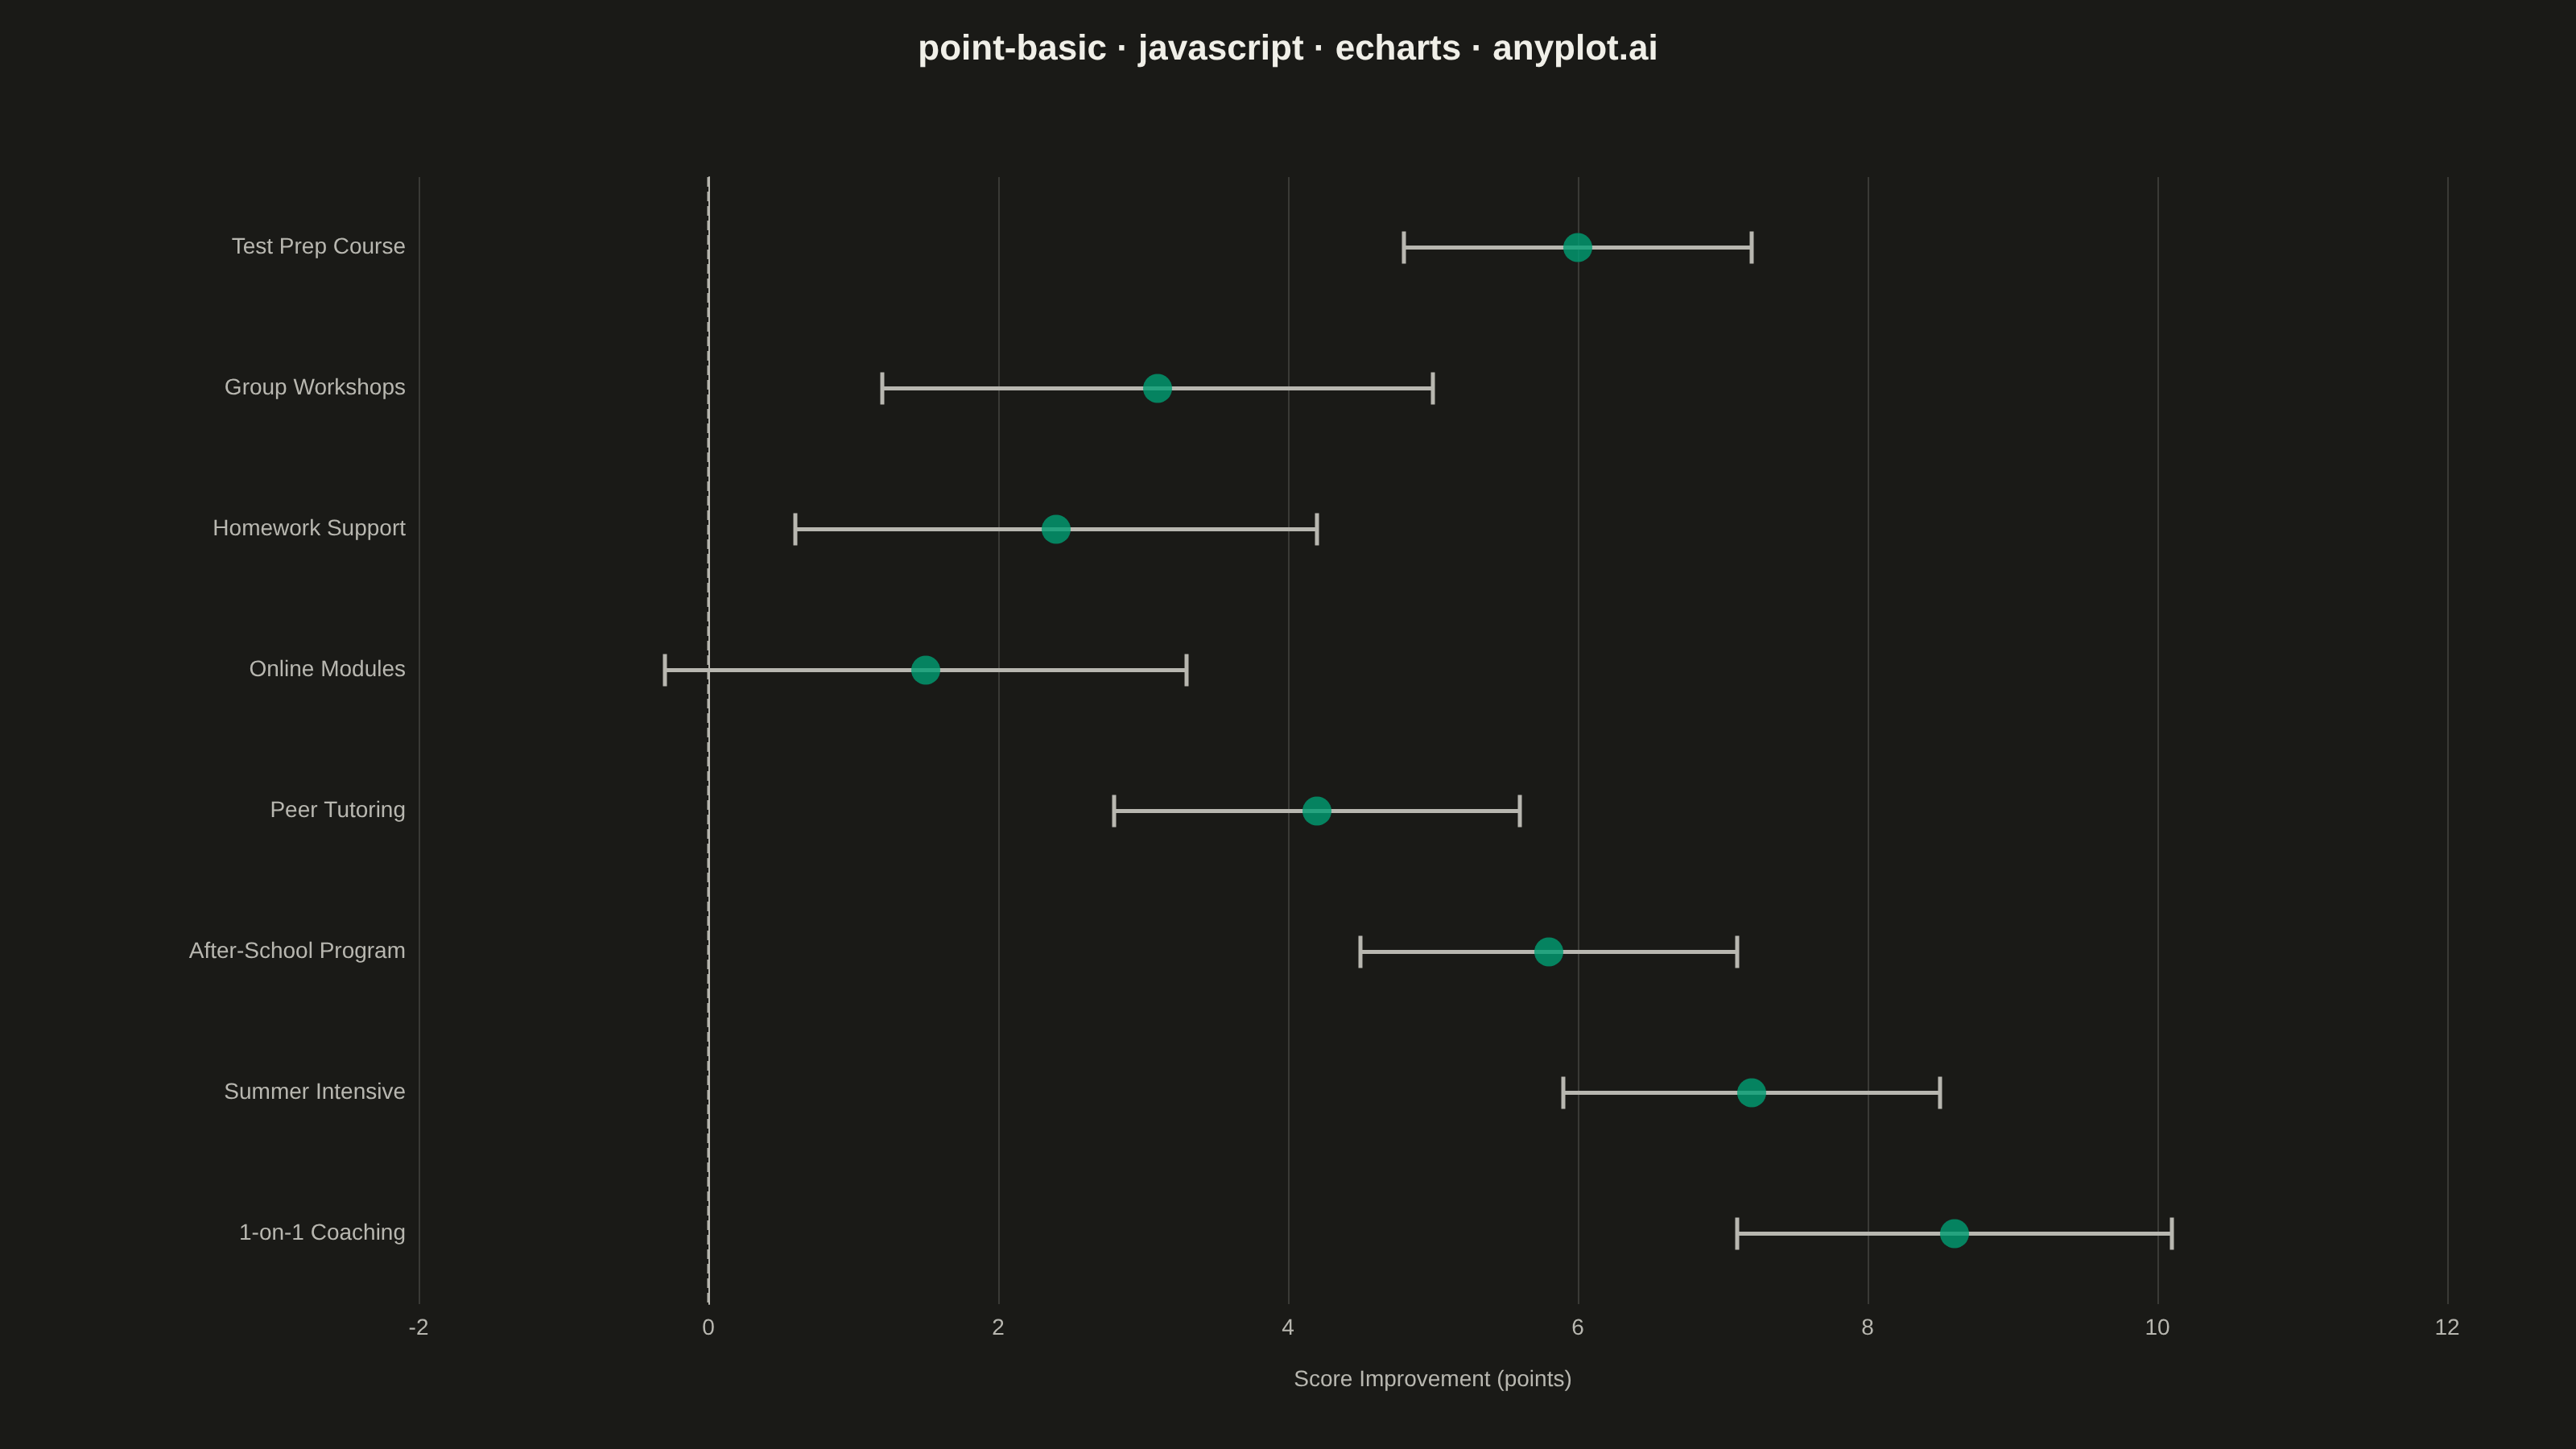
A point estimate plot displays central tendency values (means, medians, or other estimates) with confidence intervals or error bars for each category. Each point represents the estimate, and the lines extending from it show the uncertainty range.
// anyplot.ai
// point-basic: Point Estimate Plot
// Library: echarts 6.1.0 | JavaScript 22.23.2
// Quality: 95/100 | Created: 2026-09-05

const t = window.ANYPLOT_TOKENS;

// --- Data (in-memory, deterministic) ----------------------------------------
// Average test-score improvement (points) attributed to eight tutoring
// programs, each with a 95% confidence interval from a randomized evaluation.
const rawPrograms = [
  "Test Prep Course",
  "Group Workshops",
  "Homework Support",
  "Online Modules",
  "Peer Tutoring",
  "After-School Program",
  "Summer Intensive",
  "1-on-1 Coaching",
];
const rawEstimate = [6.0, 3.1, 2.4, 1.5, 4.2, 5.8, 7.2, 8.6];
const rawLowerBound = [4.8, 1.2, 0.6, -0.3, 2.8, 4.5, 5.9, 7.1];
const rawUpperBound = [7.2, 5.0, 4.2, 3.3, 5.6, 7.1, 8.5, 10.1];

// Rank by estimate (descending) so the strongest program reads first from the top.
const order = rawPrograms.map((_, i) => i).sort((a, b) => rawEstimate[b] - rawEstimate[a]);
const programs = order.map((i) => rawPrograms[i]);
const estimate = order.map((i) => rawEstimate[i]);
const lowerBound = order.map((i) => rawLowerBound[i]);
const upperBound = order.map((i) => rawUpperBound[i]);

const rows = programs.map((_, i) => [i, lowerBound[i], upperBound[i]]);
const points = programs.map((_, i) => [estimate[i], i]);

// --- Custom renderer: error bar with caps -----------------------------------
function renderErrorBar(params, api) {
  const categoryIndex = api.value(0);
  const lowPt = api.coord([api.value(1), categoryIndex]);
  const highPt = api.coord([api.value(2), categoryIndex]);
  const capHalf = 10;
  const style = { stroke: t.inkSoft, lineWidth: 2.5 };
  return {
    type: "group",
    children: [
      { type: "line", shape: { x1: lowPt[0], y1: lowPt[1], x2: highPt[0], y2: highPt[1] }, style },
      { type: "line", shape: { x1: lowPt[0], y1: lowPt[1] - capHalf, x2: lowPt[0], y2: lowPt[1] + capHalf }, style },
      { type: "line", shape: { x1: highPt[0], y1: highPt[1] - capHalf, x2: highPt[0], y2: highPt[1] + capHalf }, style },
    ],
  };
}

// --- Init --------------------------------------------------------------------
const chart = echarts.init(document.getElementById("container"));

// --- Option --------------------------------------------------------------------
chart.setOption({
  animation: false,
  backgroundColor: "transparent",
  title: {
    text: "point-basic · javascript · echarts · anyplot.ai",
    left: "center",
    textStyle: { color: t.ink, fontSize: 22 },
  },
  grid: { left: 260, right: 80, top: 110, bottom: 90 },
  xAxis: {
    type: "value",
    name: "Score Improvement (points)",
    nameLocation: "middle",
    nameGap: 40,
    nameTextStyle: { color: t.inkSoft, fontSize: 14 },
    axisLabel: { color: t.inkSoft, fontSize: 14 },
    axisLine: { lineStyle: { color: t.inkSoft } },
    splitLine: { lineStyle: { color: t.grid } },
  },
  yAxis: {
    type: "category",
    data: programs,
    inverse: true,
    axisLabel: {
      color: t.inkSoft,
      fontSize: 14,
      // Emphasize the top-ranked program to give the sorted list a clear focal point.
      formatter: (value, index) => (index === 0 ? `{focal|${value}}` : value),
      rich: { focal: { color: t.ink, fontWeight: 700 } },
    },
    axisLine: { show: false },
    axisTick: { show: false },
    splitLine: { show: false },
  },
  series: [
    {
      type: "custom",
      renderItem: renderErrorBar,
      encode: { x: [1, 2], y: 0 },
      data: rows,
      clip: true,
      z: 2,
    },
    {
      type: "scatter",
      data: points,
      symbolSize: 18,
      itemStyle: { color: t.palette[0] },
      z: 3,
      markLine: {
        silent: true,
        symbol: "none",
        lineStyle: { color: t.inkSoft, type: "dashed", width: 1.5 },
        label: { show: false },
        data: [{ xAxis: 0 }],
      },
    },
  ],
});
Runnable source as JSON, for any HTTP client: https://api.anyplot.ai/specs/point-basic/echarts/code. Any spec id and library id listed in llms-full.txt fit the same URL shape; every URL below is complete and callable.
{
  "spec_id": "point-basic",
  "language": "javascript",
  "library": "echarts",
  "page": "https://anyplot.ai/point-basic/javascript/echarts",
  "hub": "https://anyplot.ai/point-basic",
  "code_json": "https://api.anyplot.ai/specs/point-basic/echarts/code",
  "spec_json": "https://api.anyplot.ai/specs/point-basic",
  "render_light_png": "https://storage.googleapis.com/anyplot-images/plots/point-basic/javascript/echarts/plot-light.png",
  "render_dark_png": "https://storage.googleapis.com/anyplot-images/plots/point-basic/javascript/echarts/plot-dark.png",
  "interactive_light_html": "https://storage.googleapis.com/anyplot-images/plots/point-basic/javascript/echarts/plot-light.html",
  "interactive_dark_html": "https://storage.googleapis.com/anyplot-images/plots/point-basic/javascript/echarts/plot-dark.html",
  "quality_score": 95.0,
  "license": "MIT",
  "guide": "https://anyplot.ai/llms.txt"
}
Part of Point Estimate Plot on anyplot.ai.