The same plot in 14 other libraries — JavaScript: Chart.js, D3.js, Apache ECharts, MUI X Charts; Python: Altair, Bokeh, lets-plot, Matplotlib, Plotly, plotnine, Pygal, Seaborn; R: ggplot2; Julia: Makie.jl. Compare all 15 side by side: Point Estimate Plot in Python, R, Julia and JavaScript.
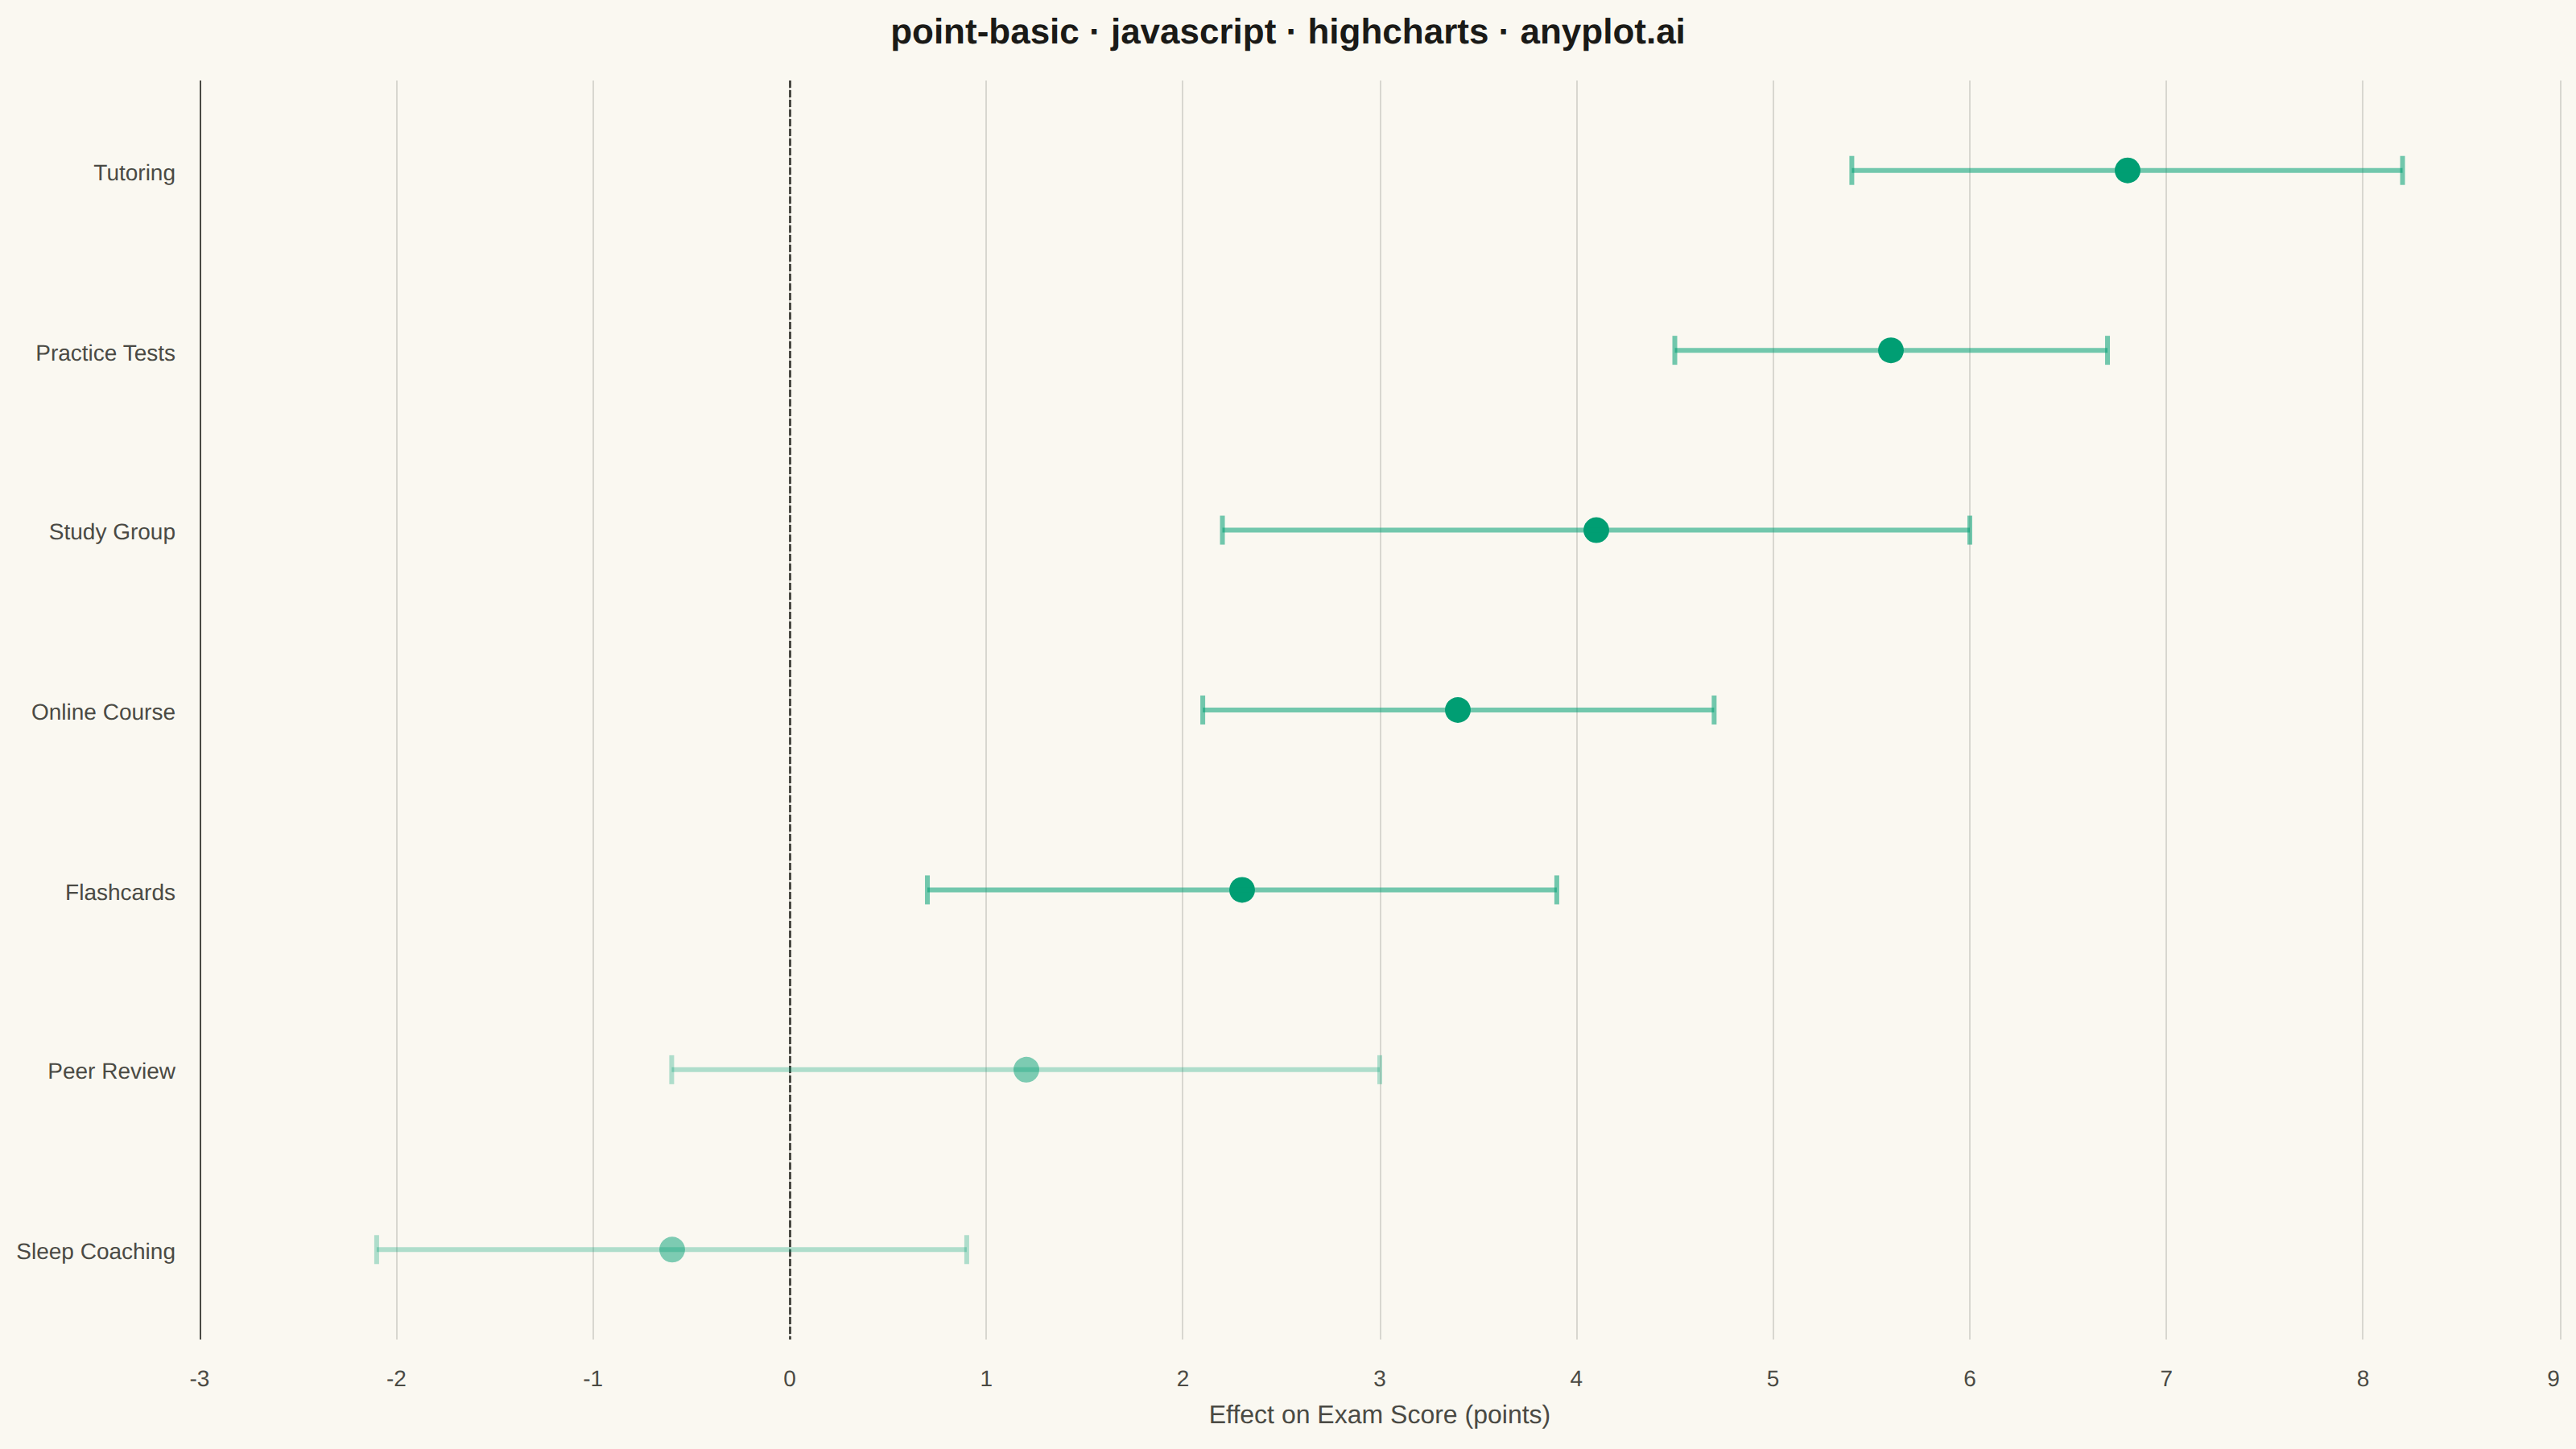
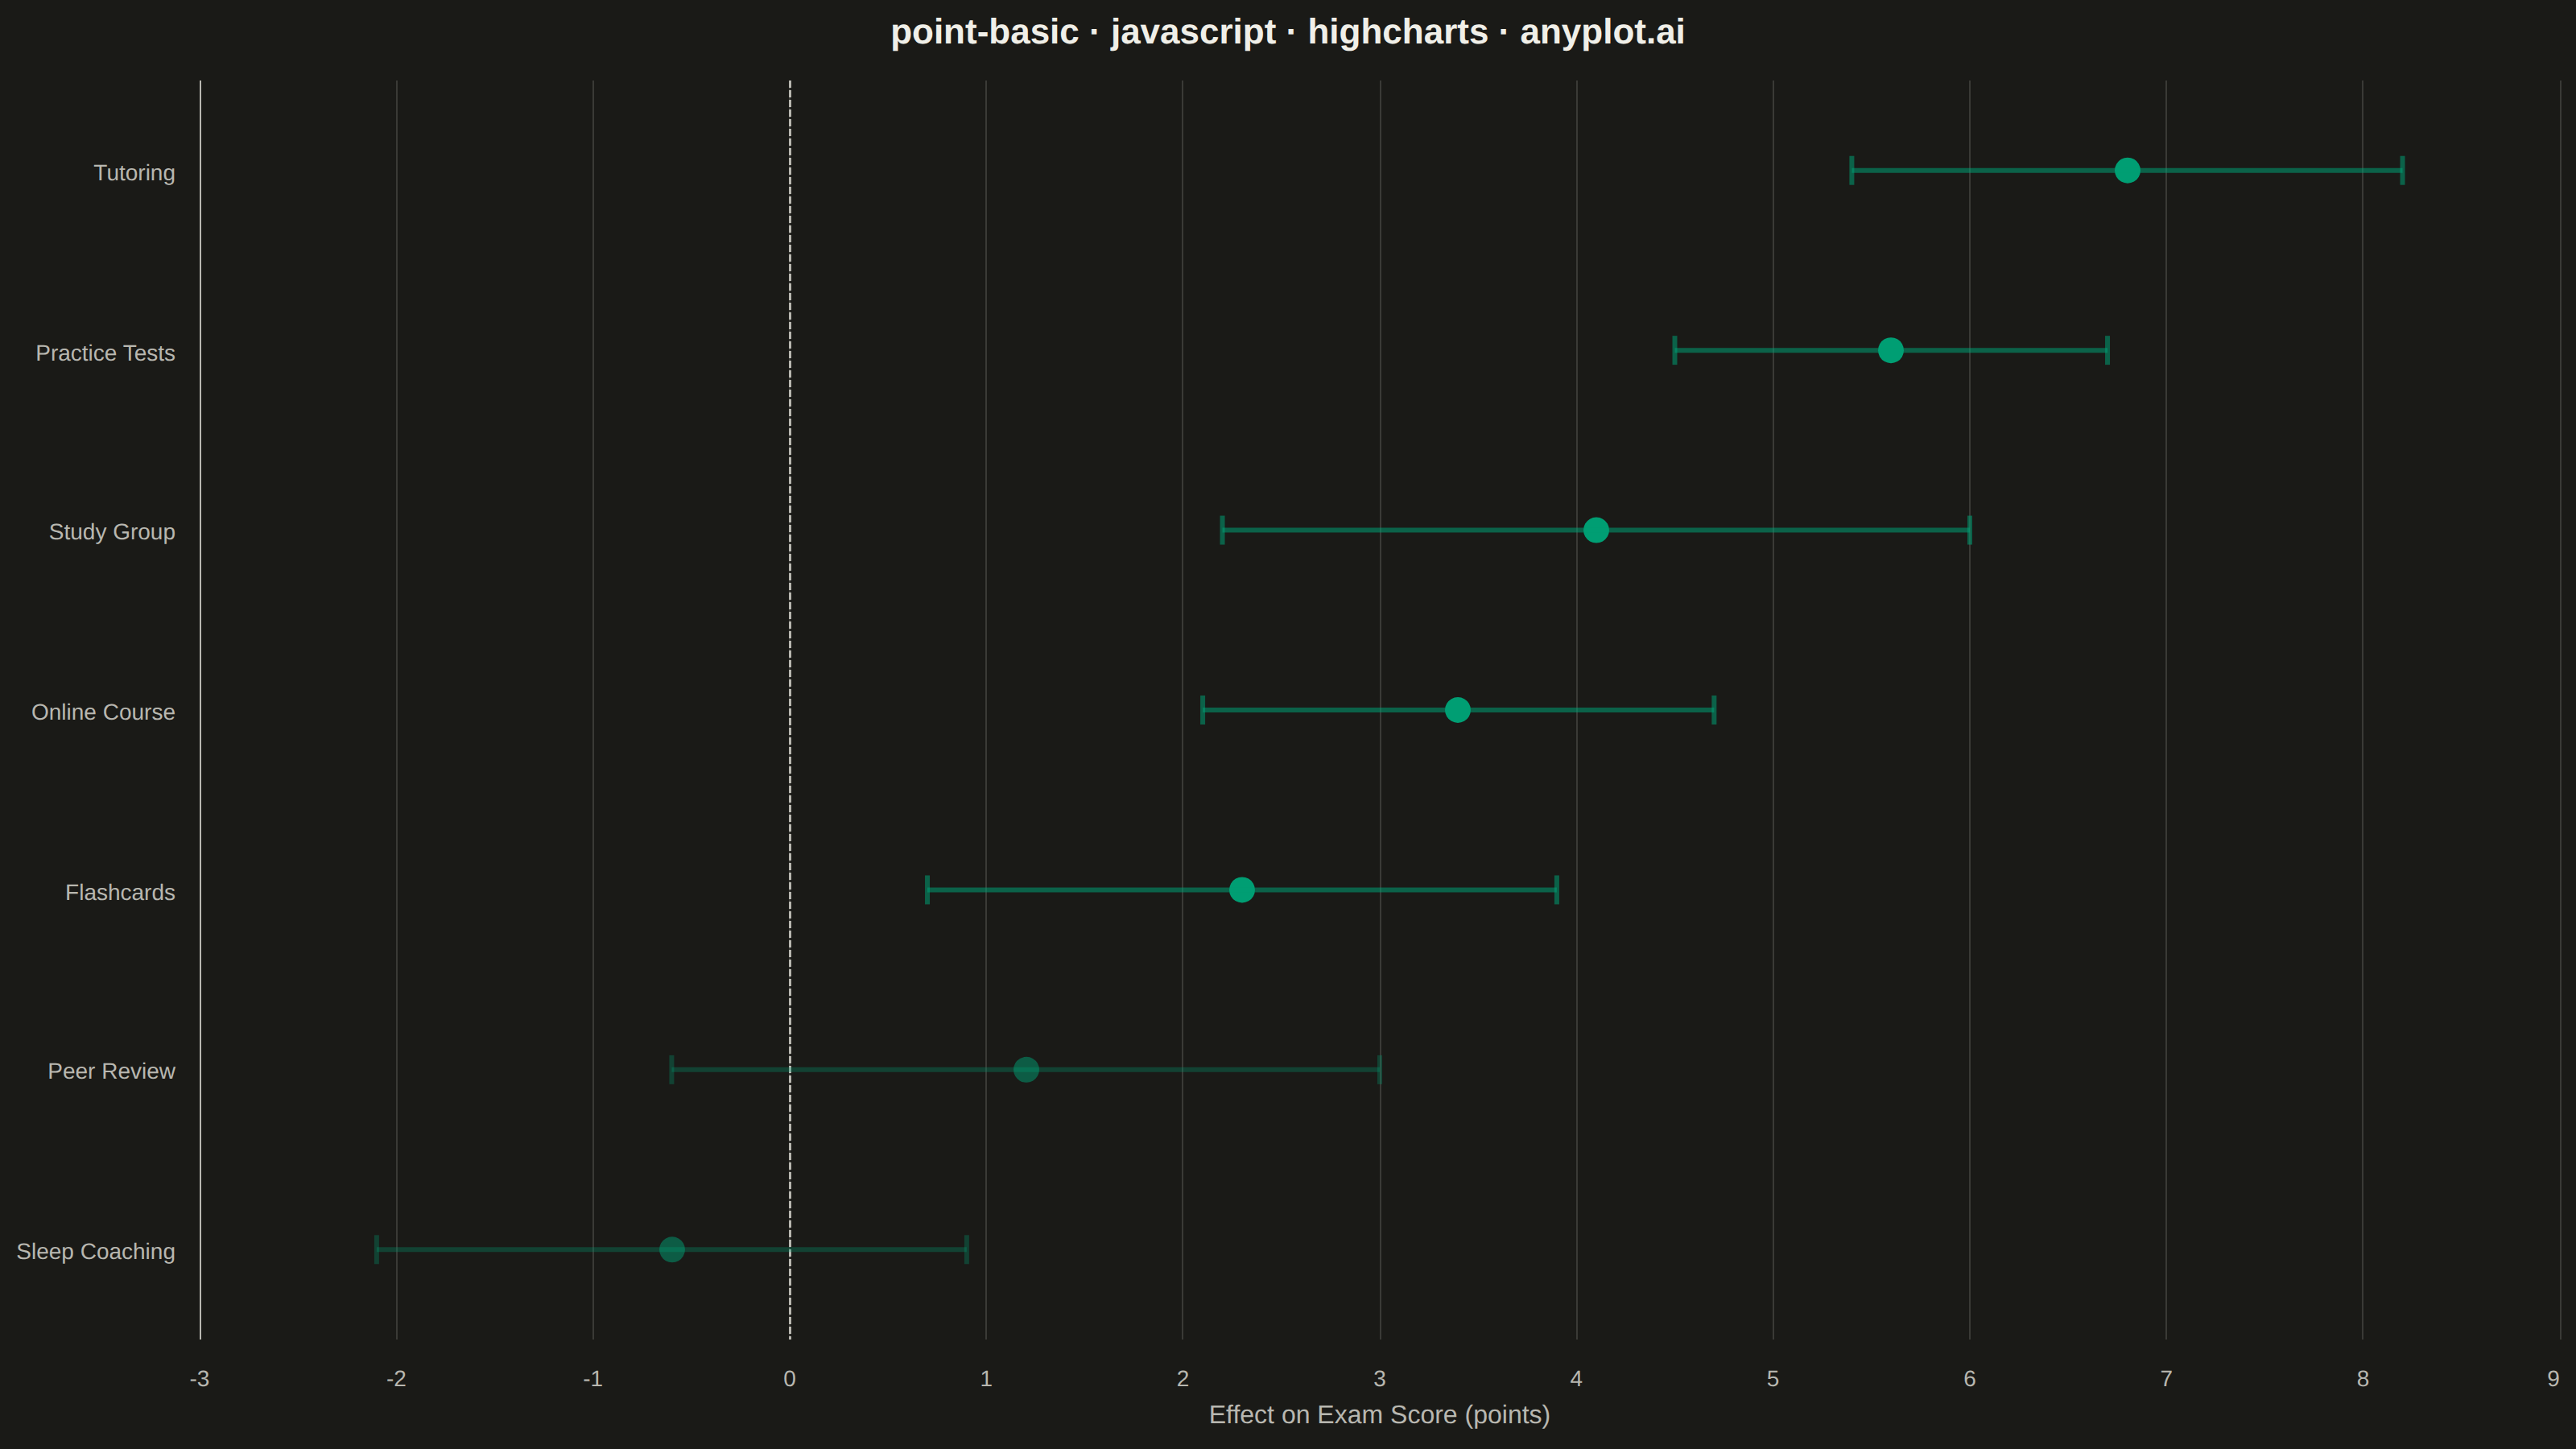
A point estimate plot displays central tendency values (means, medians, or other estimates) with confidence intervals or error bars for each category. Each point represents the estimate, and the lines extending from it show the uncertainty range.
// anyplot.ai
// point-basic: Point Estimate Plot
// Library: highcharts 12.6.0 | JavaScript 22.23.2
// Quality: 92/100 | Created: 2026-09-05

//# anyplot-orientation: landscape
const t = window.ANYPLOT_TOKENS;

// --- Data (in-memory, deterministic) ----------------------------------------
// Estimated effect of study interventions on exam score, points gained/lost
// vs. a no-intervention baseline, with 95% confidence intervals. Sorted
// descending by estimate so the chart reads top-to-bottom from strongest to
// weakest effect.
const rows = [
  { category: "Tutoring", estimate: 6.8, marginOfError: 1.4 },
  { category: "Study Group", estimate: 4.1, marginOfError: 1.9 },
  { category: "Practice Tests", estimate: 5.6, marginOfError: 1.1 },
  { category: "Flashcards", estimate: 2.3, marginOfError: 1.6 },
  { category: "Online Course", estimate: 3.4, marginOfError: 1.3 },
  { category: "Peer Review", estimate: 1.2, marginOfError: 1.8 },
  { category: "Sleep Coaching", estimate: -0.6, marginOfError: 1.5 },
].sort((a, b) => b.estimate - a.estimate);

const categories = rows.map((r) => r.category);
const estimate = rows.map((r) => r.estimate);
const lowerBound = rows.map((r) => r.estimate - r.marginOfError);
const upperBound = rows.map((r) => r.estimate + r.marginOfError);
// An interval crossing zero is not statistically significant — render it in a
// muted tone (same hue, lower opacity) so the eye separates the two groups
// without leaning on the reference line alone.
const isSignificant = rows.map((_, i) => lowerBound[i] > 0 || upperBound[i] < 0);

// Highcharts core has no errorbar/columnrange series (those live in the
// unloaded highcharts-more module) — draw the CI whiskers natively with the
// SVGRenderer once the axes are laid out, keyed off the same pixel space the
// scatter points use.
const intervalColor = Highcharts.color(t.palette[0]).setOpacity(0.55).get();
const intervalColorMuted = Highcharts.color(t.palette[0])
  .setOpacity(0.3)
  .get();
const markerColorMuted = Highcharts.color(t.palette[0]).setOpacity(0.5).get();
const capHalfPx = 9;

// --- Chart -------------------------------------------------------------
Highcharts.chart("container", {
  chart: {
    type: "scatter",
    inverted: true,
    backgroundColor: "transparent",
    animation: false,
    style: { fontFamily: "inherit" },
    events: {
      load() {
        const chart = this;
        const xAxis = chart.xAxis[0];
        const yAxis = chart.yAxis[0];
        categories.forEach((_, i) => {
          const rowPixel = xAxis.toPixels(i);
          const lowPixel = yAxis.toPixels(lowerBound[i]);
          const highPixel = yAxis.toPixels(upperBound[i]);
          const stroke = isSignificant[i] ? intervalColor : intervalColorMuted;
          chart.renderer
            .path(["M", lowPixel, rowPixel, "L", highPixel, rowPixel])
            .attr({ "stroke-width": 3, stroke, zIndex: 4 })
            .add();
          [lowPixel, highPixel].forEach((xPixel) => {
            chart.renderer
              .path([
                "M",
                xPixel,
                rowPixel - capHalfPx,
                "L",
                xPixel,
                rowPixel + capHalfPx,
              ])
              .attr({ "stroke-width": 3, stroke, zIndex: 4 })
              .add();
          });
        });
      },
    },
  },
  credits: { enabled: false },
  colors: t.palette,
  title: {
    text: "point-basic · javascript · highcharts · anyplot.ai",
    style: { color: t.ink, fontSize: "22px", fontWeight: "600" },
  },
  xAxis: {
    categories,
    minPadding: 0.08,
    maxPadding: 0.08,
    lineColor: t.inkSoft,
    tickColor: t.inkSoft,
    labels: { style: { color: t.inkSoft, fontSize: "14px" } },
  },
  yAxis: {
    title: {
      text: "Effect on Exam Score (points)",
      style: { color: t.inkSoft, fontSize: "16px" },
    },
    minPadding: 0.06,
    maxPadding: 0.06,
    lineColor: t.inkSoft,
    tickColor: t.inkSoft,
    gridLineColor: t.grid,
    labels: { style: { color: t.inkSoft, fontSize: "14px" } },
    plotLines: [
      {
        value: 0,
        color: t.inkSoft,
        width: 1.5,
        dashStyle: "ShortDash",
        zIndex: 3,
      },
    ],
  },
  legend: { enabled: false },
  tooltip: {
    formatter() {
      const i = this.point.x;
      return (
        `<b>${categories[i]}</b><br/>` +
        `Estimate: ${estimate[i].toFixed(1)}<br/>` +
        `95% CI: [${lowerBound[i].toFixed(1)}, ${upperBound[i].toFixed(1)}]`
      );
    },
  },
  plotOptions: {
    series: { animation: false },
    scatter: {
      marker: { radius: 8, symbol: "circle", lineWidth: 0 },
    },
  },
  series: [
    {
      name: "Estimate",
      data: estimate.map((v, i) => ({
        x: i,
        y: v,
        marker: isSignificant[i] ? undefined : { fillColor: markerColorMuted },
      })),
      zIndex: 5,
    },
    {
      // Invisible — only extends the value axis to cover the CI whiskers,
      // which are custom-drawn (see chart.events.load) and outside any
      // series Highcharts would otherwise use for axis-extent calculation.
      name: "CI bounds",
      data: [...lowerBound, ...upperBound].map((v, j) => [
        j % categories.length,
        v,
      ]),
      marker: { enabled: false },
      lineWidth: 0,
      enableMouseTracking: false,
      showInLegend: false,
    },
  ],
});
Runnable source as JSON, for any HTTP client: https://api.anyplot.ai/specs/point-basic/highcharts/code. Any spec id and library id listed in llms-full.txt fit the same URL shape; every URL below is complete and callable.
{
  "spec_id": "point-basic",
  "language": "javascript",
  "library": "highcharts",
  "page": "https://anyplot.ai/point-basic/javascript/highcharts",
  "hub": "https://anyplot.ai/point-basic",
  "code_json": "https://api.anyplot.ai/specs/point-basic/highcharts/code",
  "spec_json": "https://api.anyplot.ai/specs/point-basic",
  "render_light_png": "https://storage.googleapis.com/anyplot-images/plots/point-basic/javascript/highcharts/plot-light.png",
  "render_dark_png": "https://storage.googleapis.com/anyplot-images/plots/point-basic/javascript/highcharts/plot-dark.png",
  "interactive_light_html": "https://storage.googleapis.com/anyplot-images/plots/point-basic/javascript/highcharts/plot-light.html",
  "interactive_dark_html": "https://storage.googleapis.com/anyplot-images/plots/point-basic/javascript/highcharts/plot-dark.html",
  "quality_score": 92.0,
  "license": "MIT",
  "guide": "https://anyplot.ai/llms.txt"
}
Part of Point Estimate Plot on anyplot.ai.