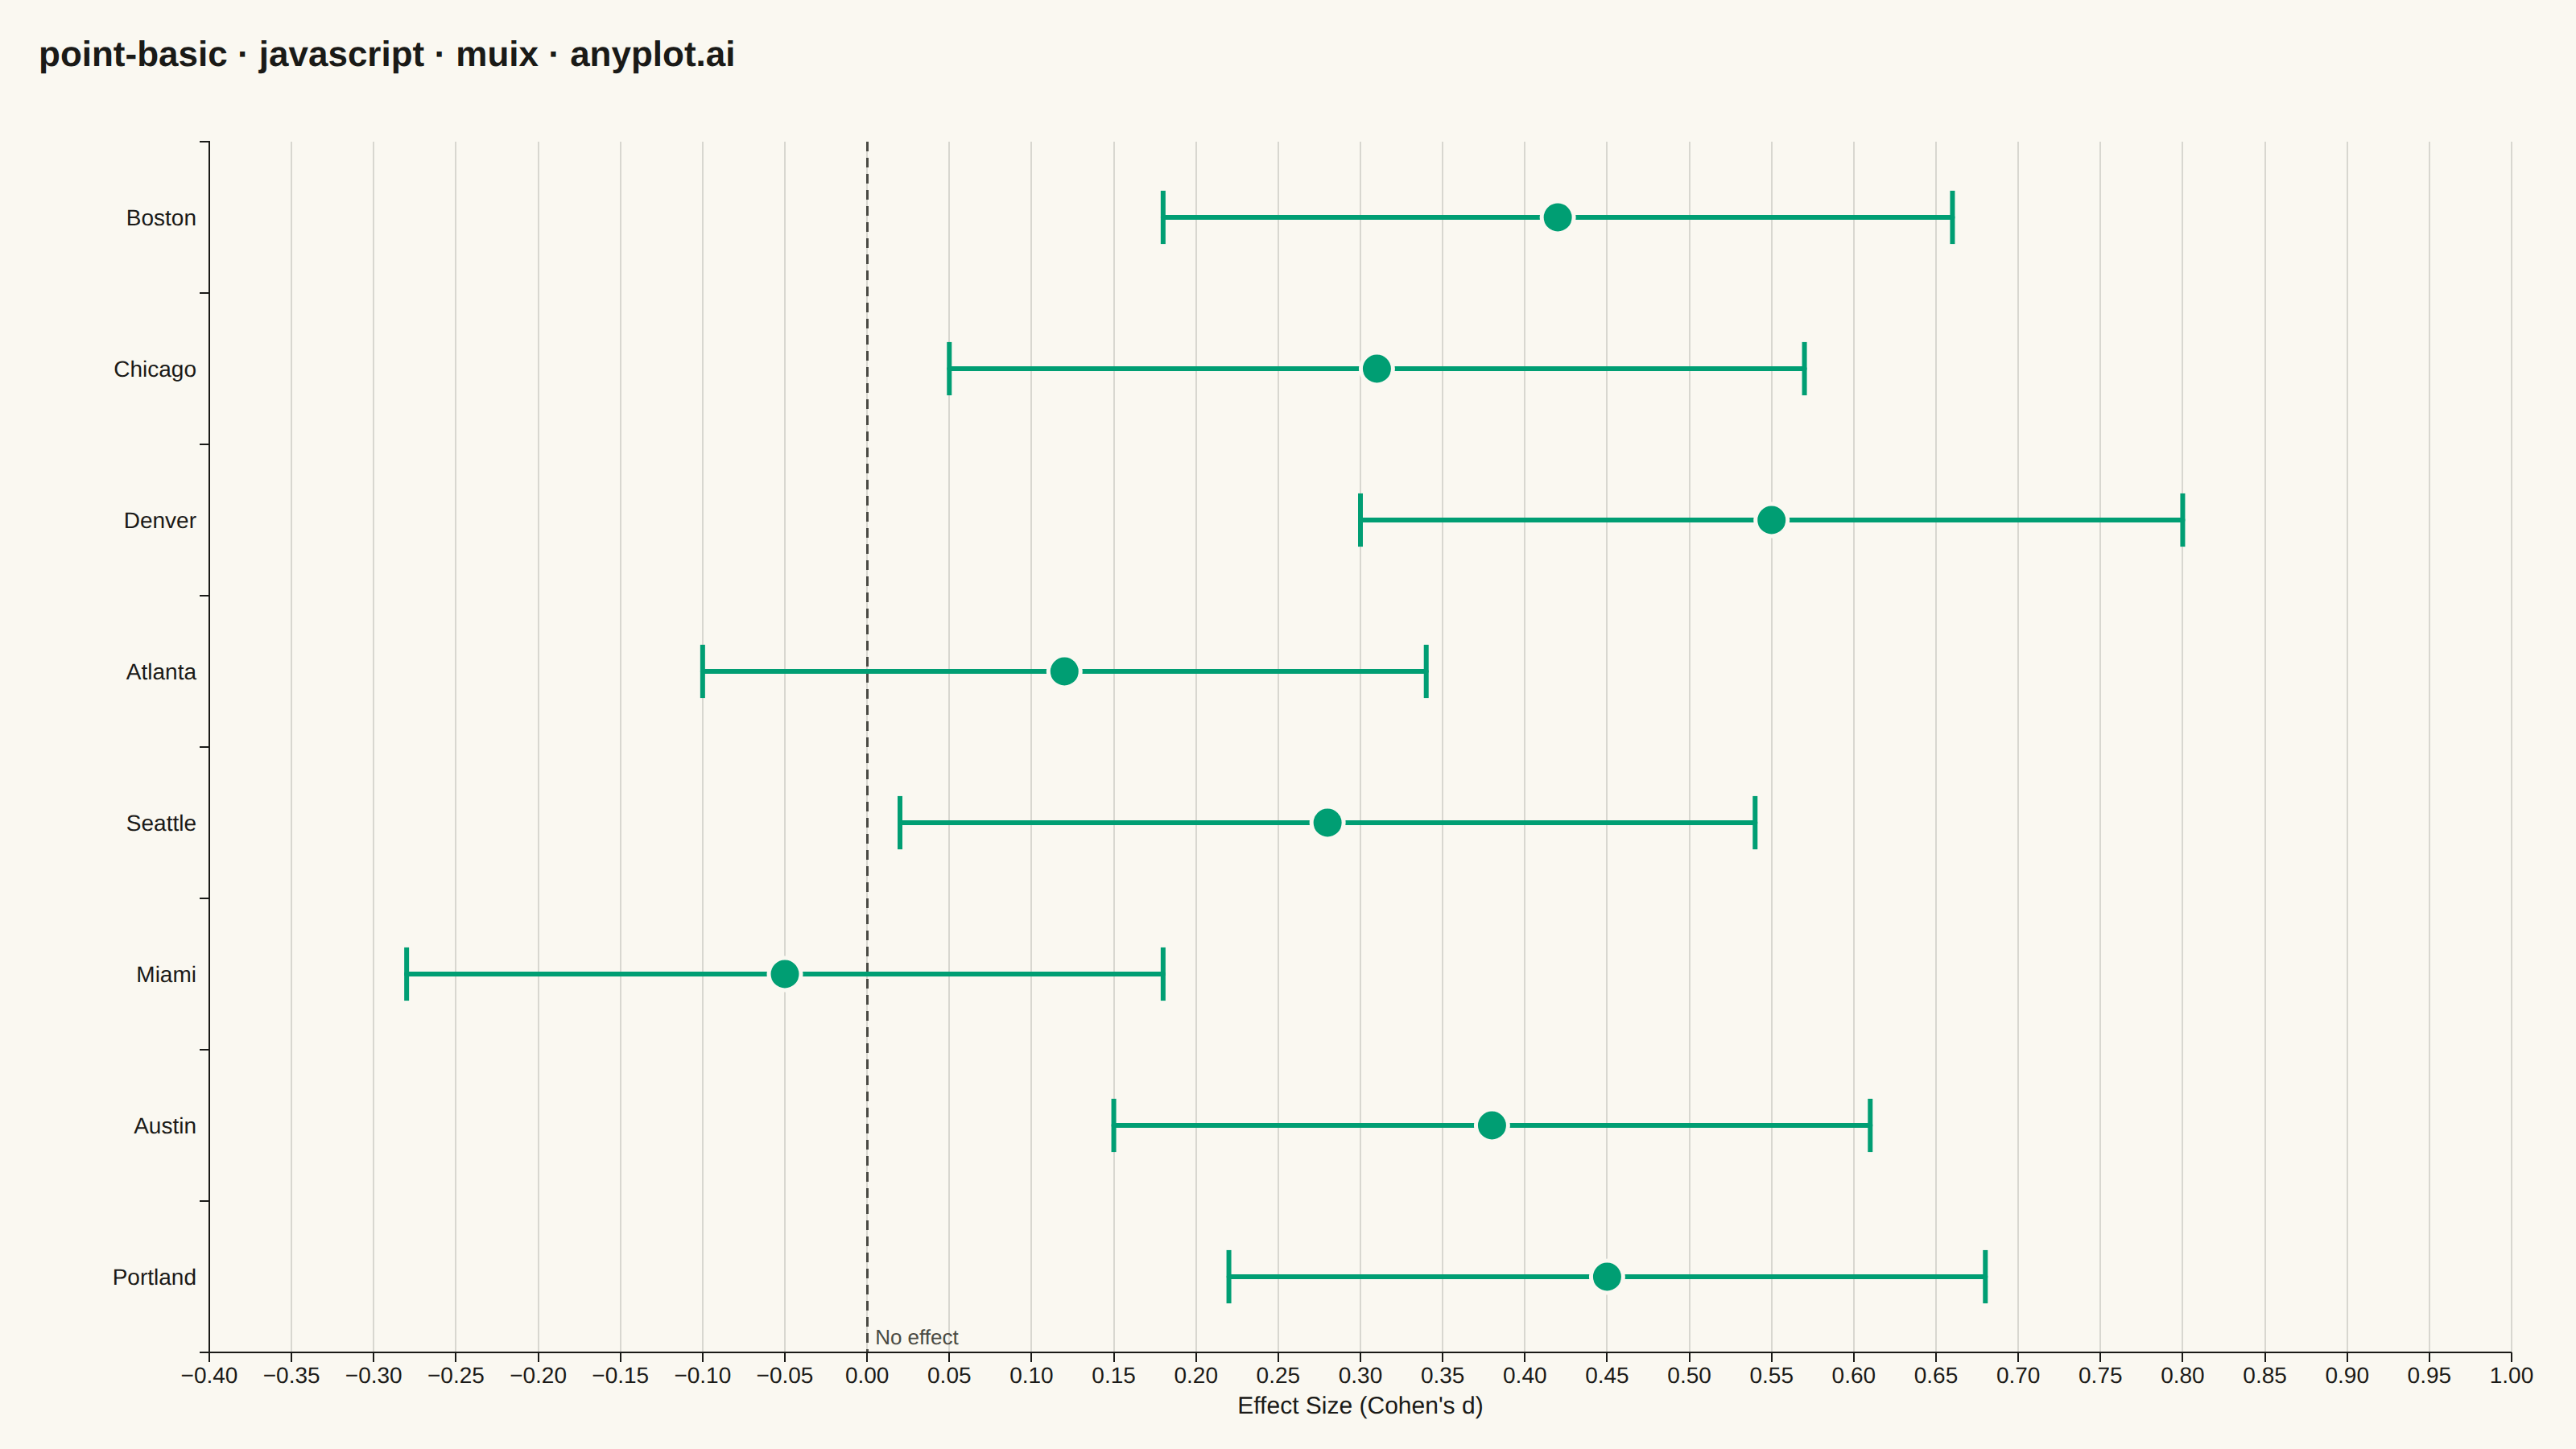
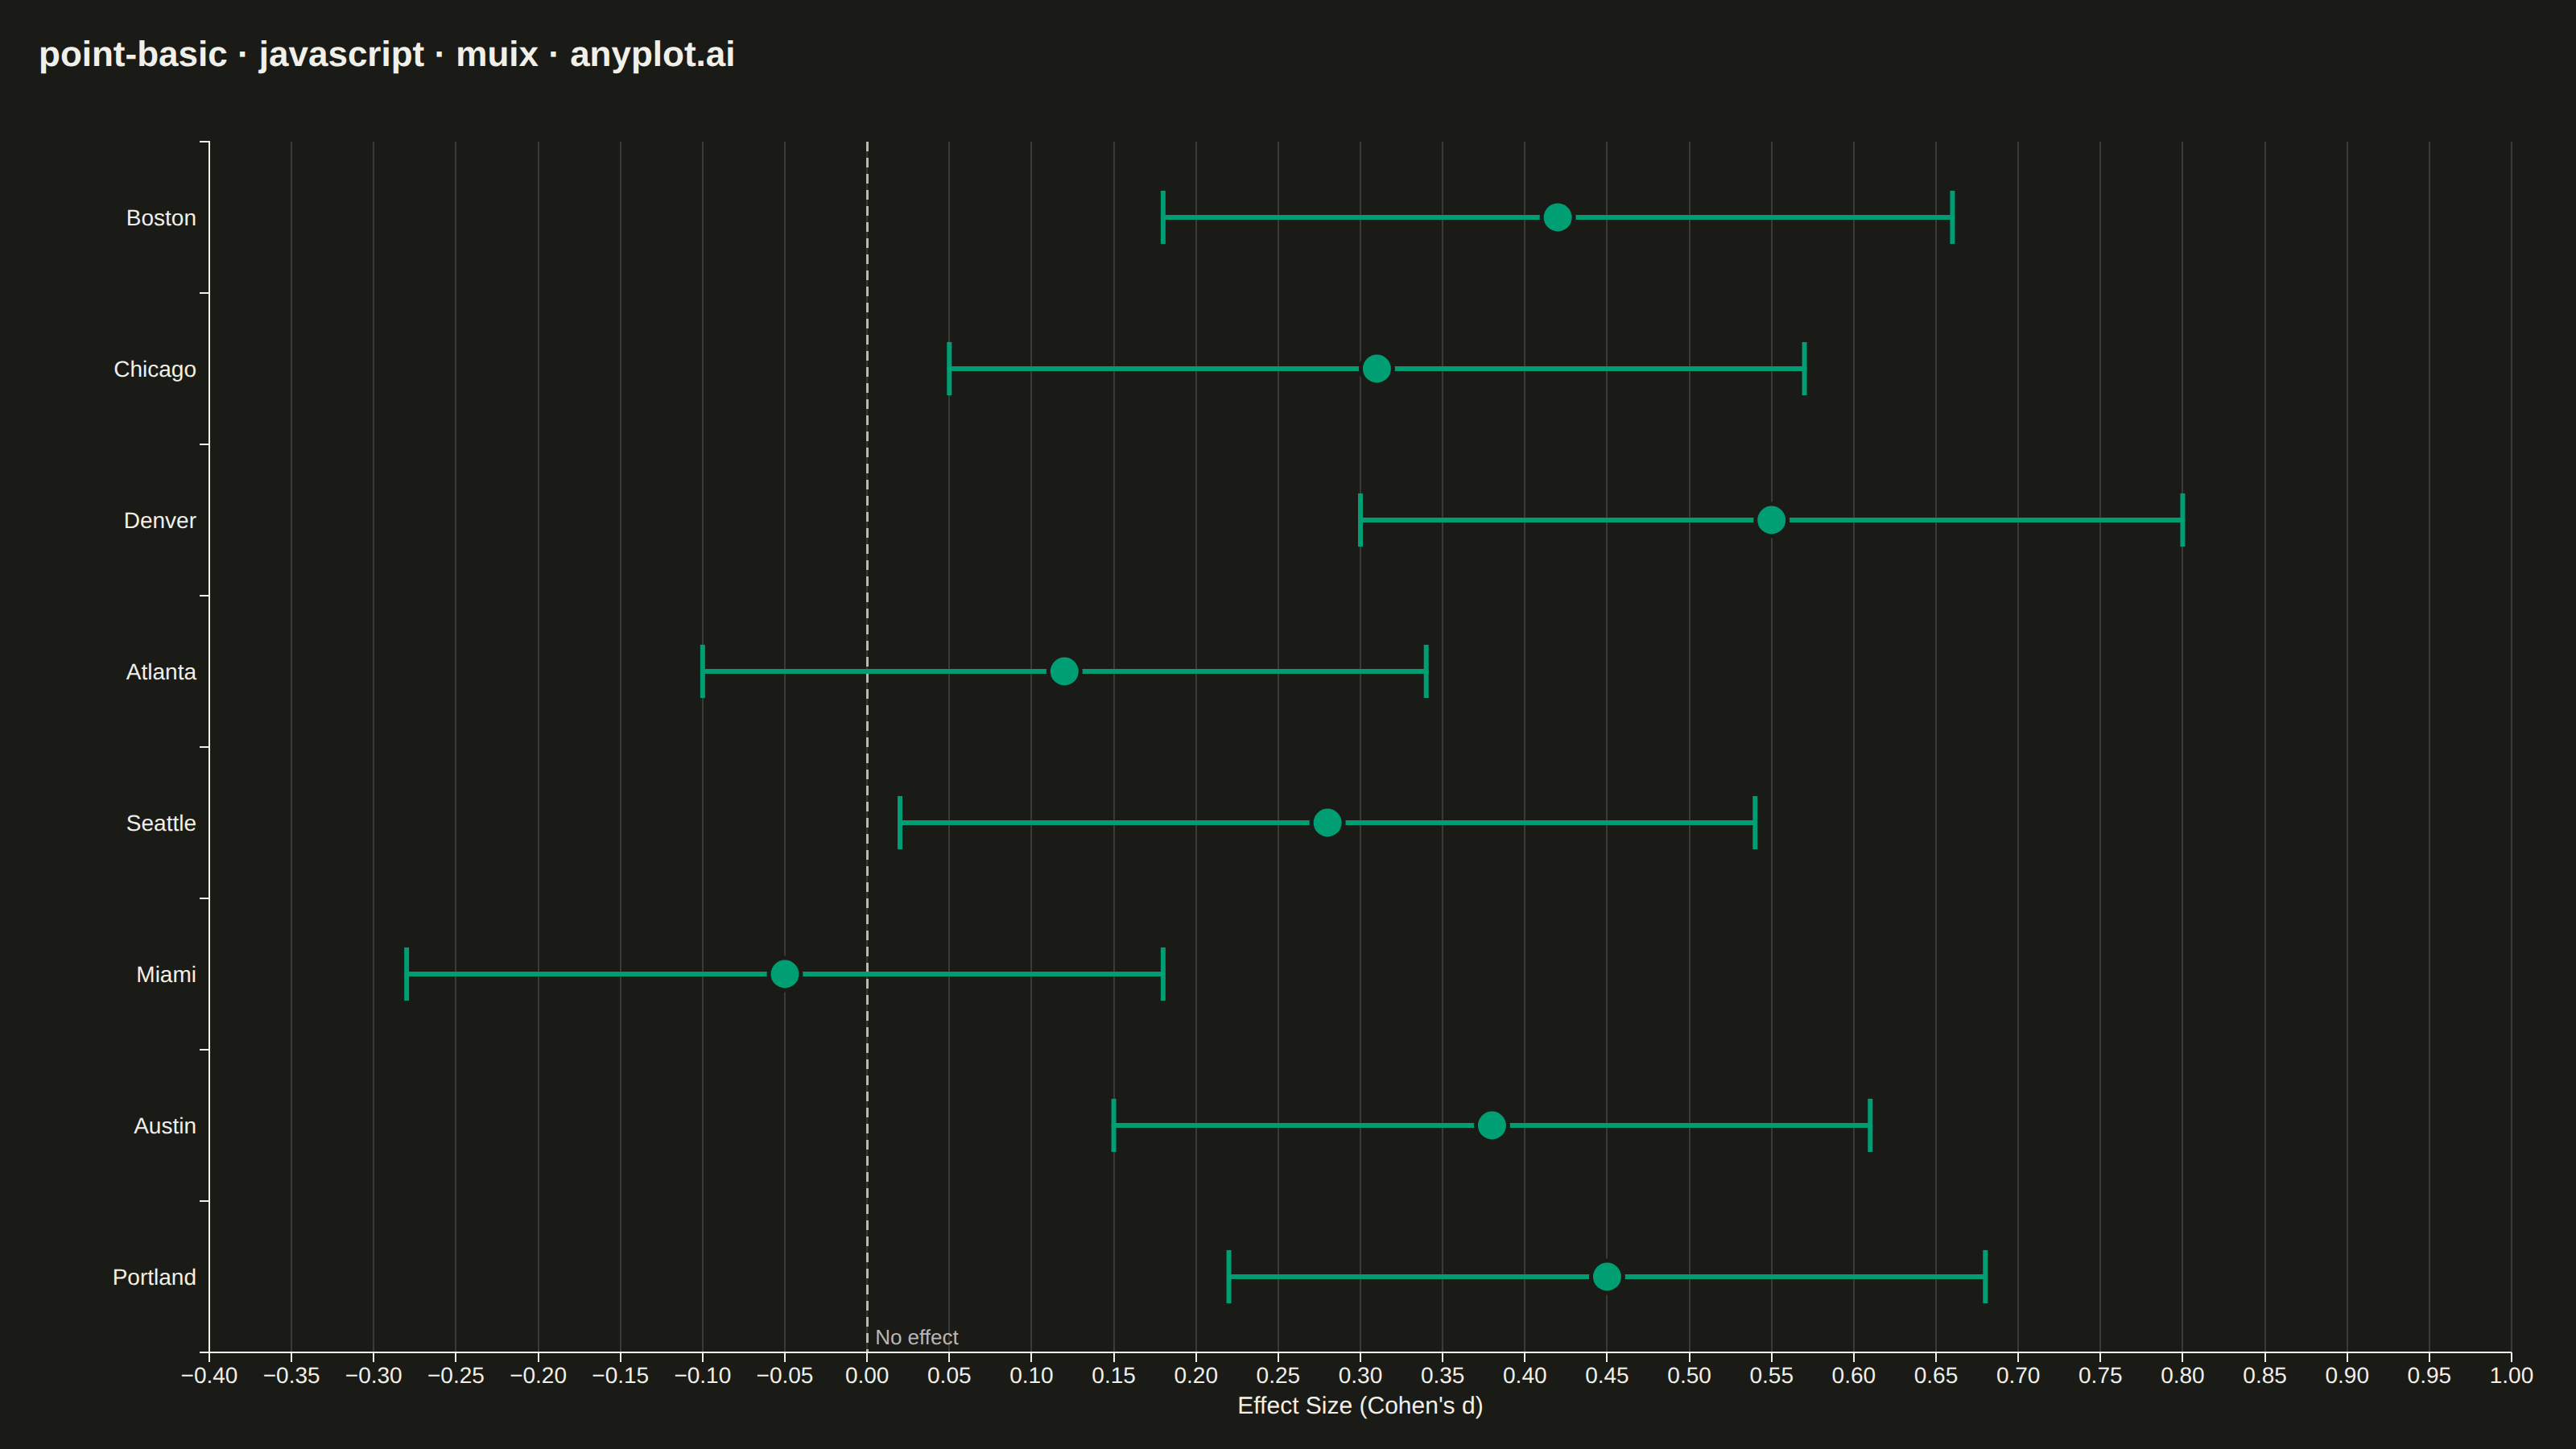
The same plot in 14 other libraries — JavaScript: Chart.js, D3.js, Apache ECharts, Highcharts; Python: Altair, Bokeh, lets-plot, Matplotlib, Plotly, plotnine, Pygal, Seaborn; R: ggplot2; Julia: Makie.jl. Compare all 15 side by side: Point Estimate Plot in Python, R, Julia and JavaScript.
A point estimate plot displays central tendency values (means, medians, or other estimates) with confidence intervals or error bars for each category. Each point represents the estimate, and the lines extending from it show the uncertainty range.
// anyplot.ai
// point-basic: Point Estimate Plot
// Library: muix 7.29.1 | JavaScript 22.23.2
// Quality: 87/100 | Created: 2026-09-05
//# anyplot-orientation: landscape
// anyplot.ai
// point-basic: Point Estimate Plot
// Library: MUI X Charts | React | Node 22
// License: @mui/x-charts — MIT (community). Pro/Premium are out of scope.
// Quality: pending | Created: 2026-09-05
import { ChartContainer } from "@mui/x-charts/ChartContainer";
import { ChartsXAxis } from "@mui/x-charts/ChartsXAxis";
import { ChartsYAxis } from "@mui/x-charts/ChartsYAxis";
import { ChartsGrid } from "@mui/x-charts/ChartsGrid";
import { ChartsReferenceLine } from "@mui/x-charts/ChartsReferenceLine";
import { useXScale, useYScale } from "@mui/x-charts/hooks";

const t = window.ANYPLOT_TOKENS;

// --- Data: effect of an after-school tutoring program on standardized test
// scores (Cohen's d), independently estimated at 8 pilot sites with 95% CIs.
// Sorted descending by estimate so the visual hierarchy reads top-to-bottom.
const sites = [
  { site: "Denver", estimate: 0.55, lower: 0.3, upper: 0.8 },
  { site: "Portland", estimate: 0.45, lower: 0.22, upper: 0.68 },
  { site: "Boston", estimate: 0.42, lower: 0.18, upper: 0.66 },
  { site: "Austin", estimate: 0.38, lower: 0.15, upper: 0.61 },
  { site: "Chicago", estimate: 0.31, lower: 0.05, upper: 0.57 },
  { site: "Seattle", estimate: 0.28, lower: 0.02, upper: 0.54 },
  { site: "Atlanta", estimate: 0.12, lower: -0.1, upper: 0.34 },
  { site: "Miami", estimate: -0.05, lower: -0.28, upper: 0.18 },
];

const TITLE_HEIGHT = 68;

// --- Custom overlay: MUI X community has no built-in error-bar series, so the
// point + CI whiskers are drawn directly against the cartesian scales via the
// public useXScale/useYScale hooks (this stays entirely within community
// @mui/x-charts — no Pro chart types involved).
function PointEstimates() {
  const xScale = useXScale();
  const yScale = useYScale();
  const capHalf = (yScale.bandwidth?.() ?? 0) * 0.22;

  return (
    <g>
      {sites.map((row) => {
        const y = (yScale(row.site) ?? 0) + (yScale.bandwidth?.() ?? 0) / 2;
        const xLow = xScale(row.lower);
        const xHigh = xScale(row.upper);
        const xEst = xScale(row.estimate);
        return (
          <g key={row.site}>
            <line x1={xLow} x2={xHigh} y1={y} y2={y} stroke={t.palette[0]} strokeWidth={3} strokeLinecap="round" />
            <line x1={xLow} x2={xLow} y1={y - capHalf} y2={y + capHalf} stroke={t.palette[0]} strokeWidth={3} />
            <line x1={xHigh} x2={xHigh} y1={y - capHalf} y2={y + capHalf} stroke={t.palette[0]} strokeWidth={3} />
            <circle cx={xEst} cy={y} r={10} fill={t.palette[0]} stroke={t.pageBg} strokeWidth={2.5} />
          </g>
        );
      })}
    </g>
  );
}

export default function Chart() {
  const chartHeight = window.ANYPLOT_SIZE.height - TITLE_HEIGHT;

  return (
    <div style={{ width: window.ANYPLOT_SIZE.width, height: window.ANYPLOT_SIZE.height }}>
      <div
        style={{
          height: TITLE_HEIGHT,
          display: "flex",
          alignItems: "center",
          paddingLeft: 24,
          fontSize: 22,
          fontWeight: 600,
          color: t.ink,
          fontFamily: "inherit",
        }}
      >
        point-basic · javascript · muix · anyplot.ai
      </div>
      <ChartContainer
        width={window.ANYPLOT_SIZE.width}
        height={chartHeight}
        series={[]}
        skipAnimation
        margin={{ top: 20, bottom: 60, left: 130, right: 40 }}
        xAxis={[
          {
            id: "effect-size",
            scaleType: "linear",
            min: -0.4,
            max: 1.0,
            label: "Effect Size (Cohen's d)",
            labelStyle: { fontSize: 15 },
            tickLabelStyle: { fontSize: 14 },
            tickInterval: [-0.4, -0.2, 0, 0.2, 0.4, 0.6, 0.8, 1.0],
          },
        ]}
        yAxis={[
          {
            id: "site",
            scaleType: "band",
            data: sites.map((row) => row.site),
            tickLabelStyle: { fontSize: 14 },
          },
        ]}
      >
        <ChartsGrid vertical />
        <ChartsReferenceLine
          x={0}
          label="No effect"
          labelAlign="end"
          lineStyle={{ stroke: t.inkSoft, strokeDasharray: "6 4", strokeWidth: 1.5 }}
          labelStyle={{ fontSize: 13, fill: t.inkSoft }}
        />
        <PointEstimates />
        <ChartsXAxis axisId="effect-size" />
        <ChartsYAxis axisId="site" disableTicks />
      </ChartContainer>
    </div>
  );
}
Runnable source as JSON, for any HTTP client: https://api.anyplot.ai/specs/point-basic/muix/code. Any spec id and library id listed in llms-full.txt fit the same URL shape; every URL below is complete and callable.
{
  "spec_id": "point-basic",
  "language": "javascript",
  "library": "muix",
  "page": "https://anyplot.ai/point-basic/javascript/muix",
  "hub": "https://anyplot.ai/point-basic",
  "code_json": "https://api.anyplot.ai/specs/point-basic/muix/code",
  "spec_json": "https://api.anyplot.ai/specs/point-basic",
  "render_light_png": "https://storage.googleapis.com/anyplot-images/plots/point-basic/javascript/muix/plot-light.png",
  "render_dark_png": "https://storage.googleapis.com/anyplot-images/plots/point-basic/javascript/muix/plot-dark.png",
  "interactive_light_html": "https://storage.googleapis.com/anyplot-images/plots/point-basic/javascript/muix/plot-light.html",
  "interactive_dark_html": "https://storage.googleapis.com/anyplot-images/plots/point-basic/javascript/muix/plot-dark.html",
  "quality_score": 87.0,
  "license": "MIT",
  "guide": "https://anyplot.ai/llms.txt"
}
Part of Point Estimate Plot on anyplot.ai.