The same plot in 14 other libraries — JavaScript: Chart.js, Apache ECharts, Highcharts, MUI X Charts; Python: Altair, Bokeh, lets-plot, Matplotlib, Plotly, plotnine, Pygal, Seaborn; R: ggplot2; Julia: Makie.jl. Compare all 15 side by side: Point Estimate Plot in Python, R, Julia and JavaScript.
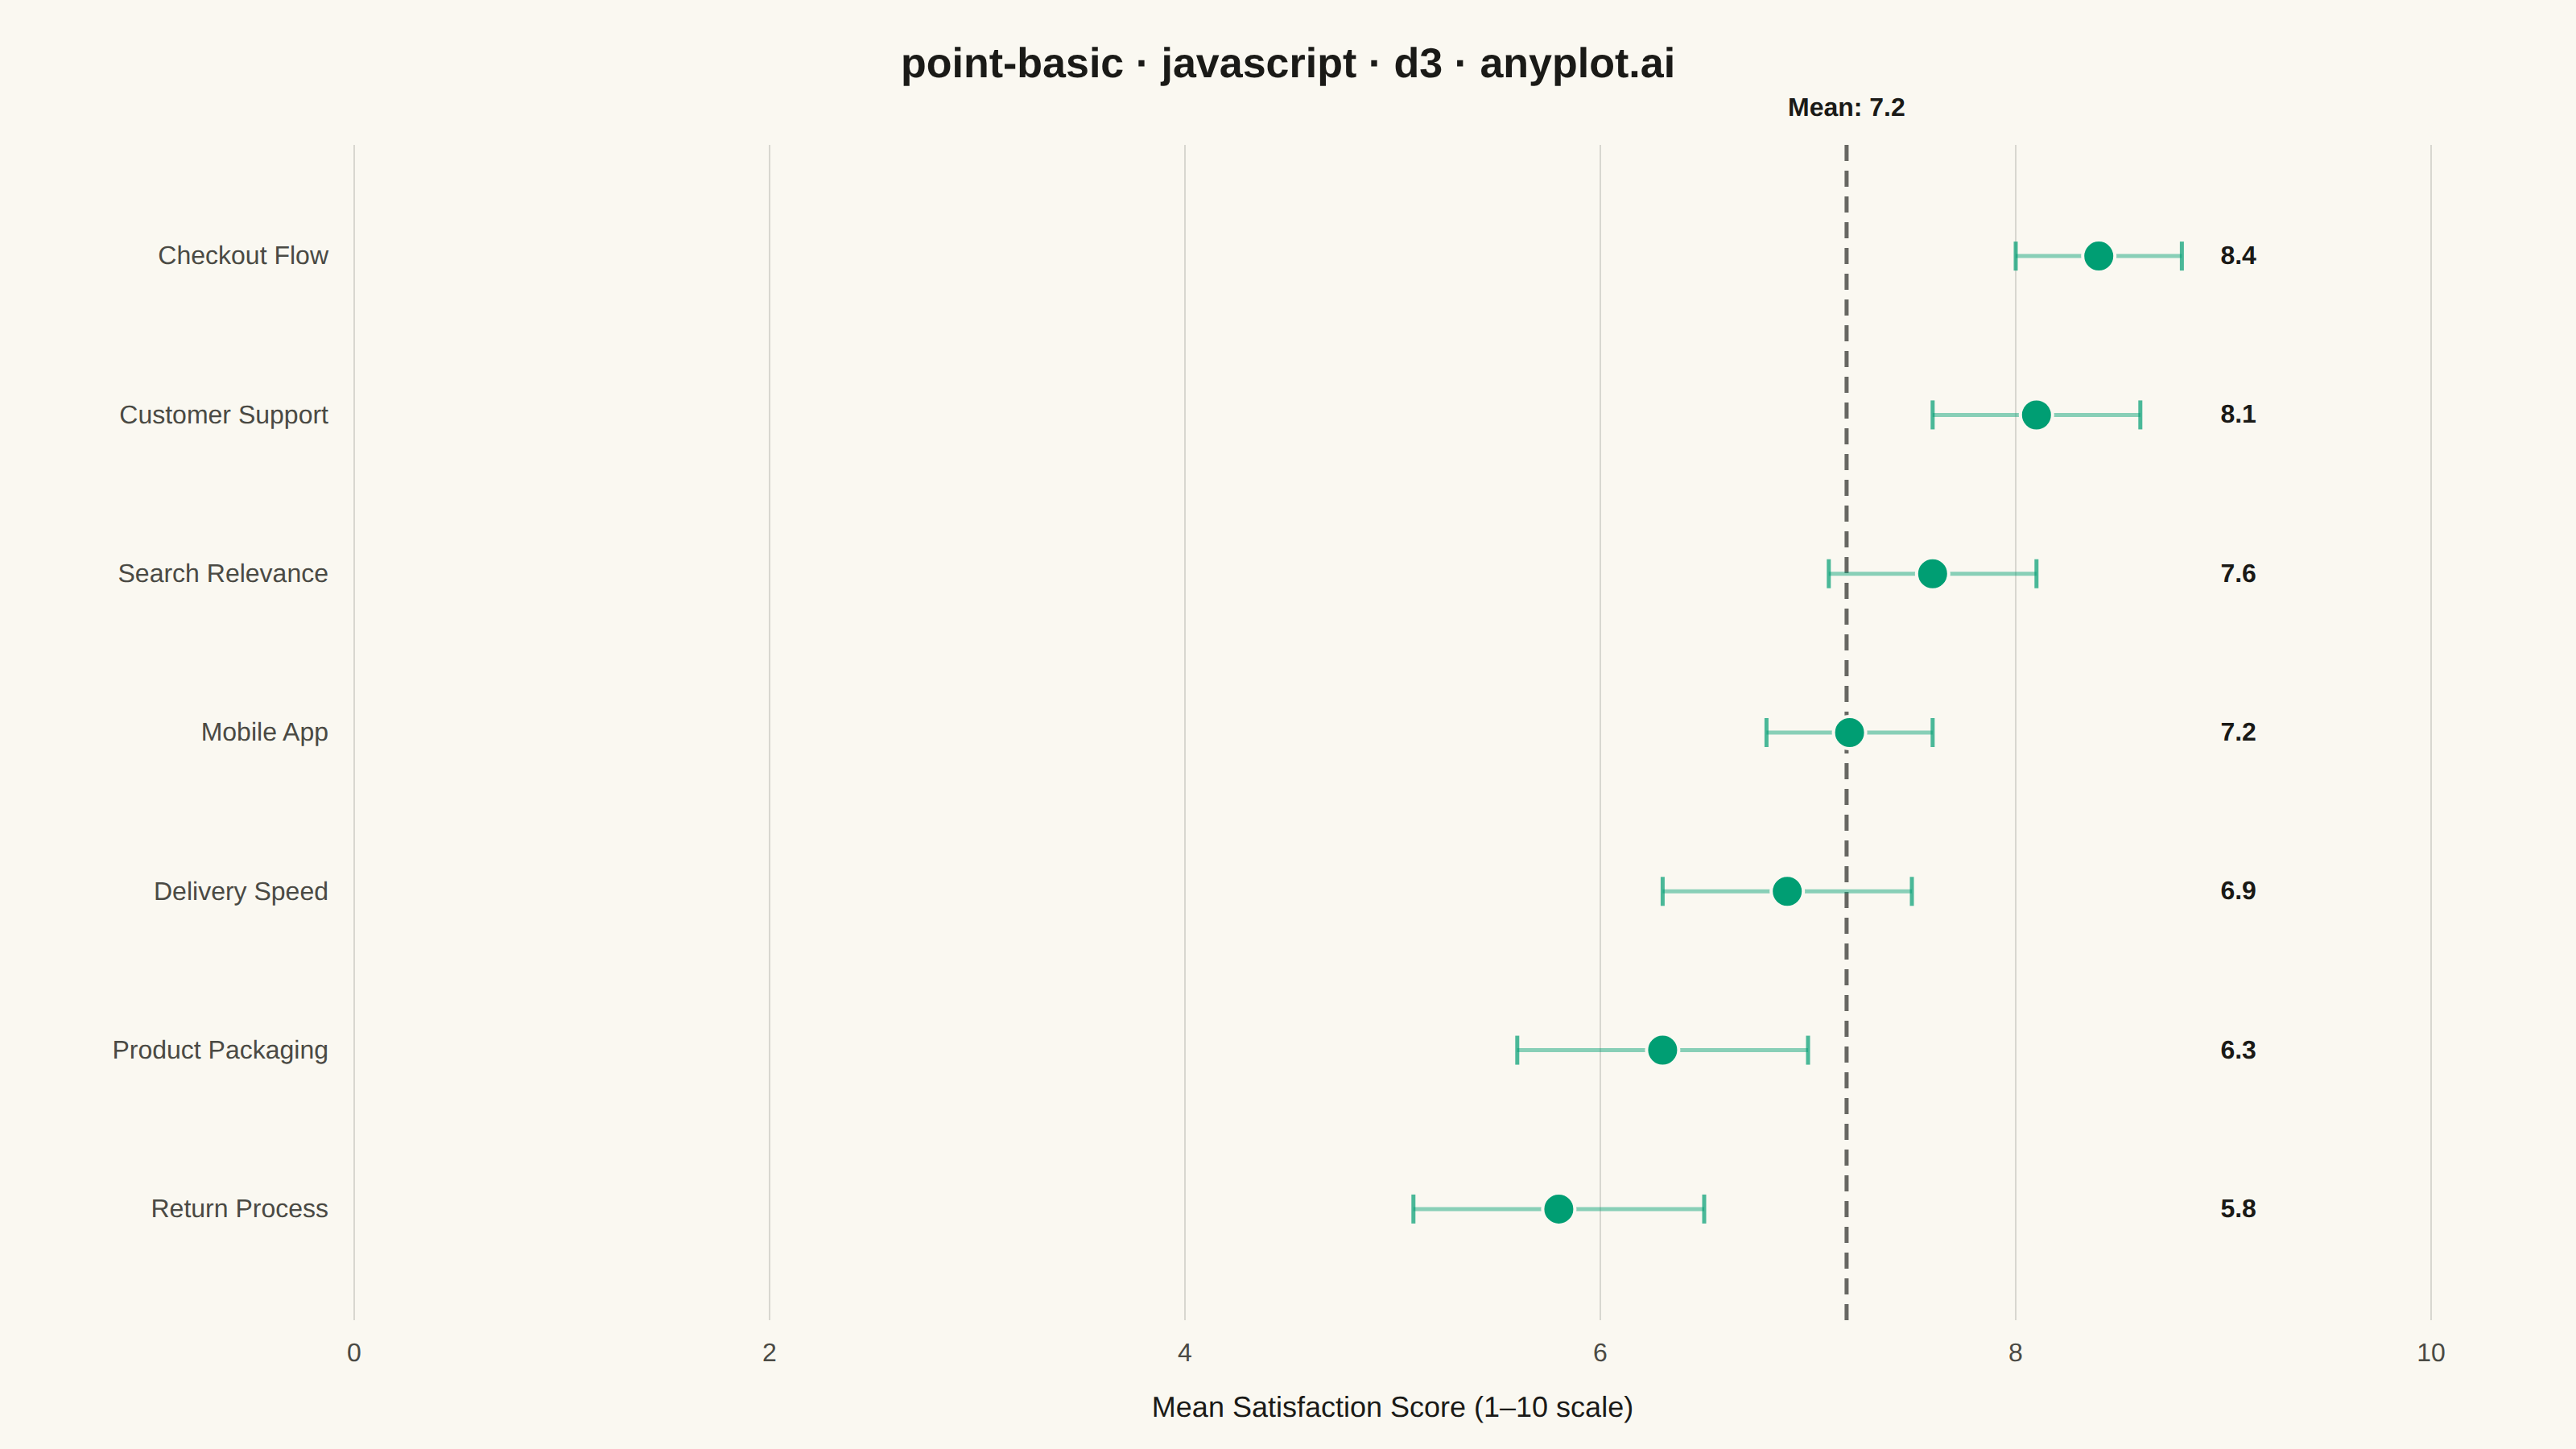
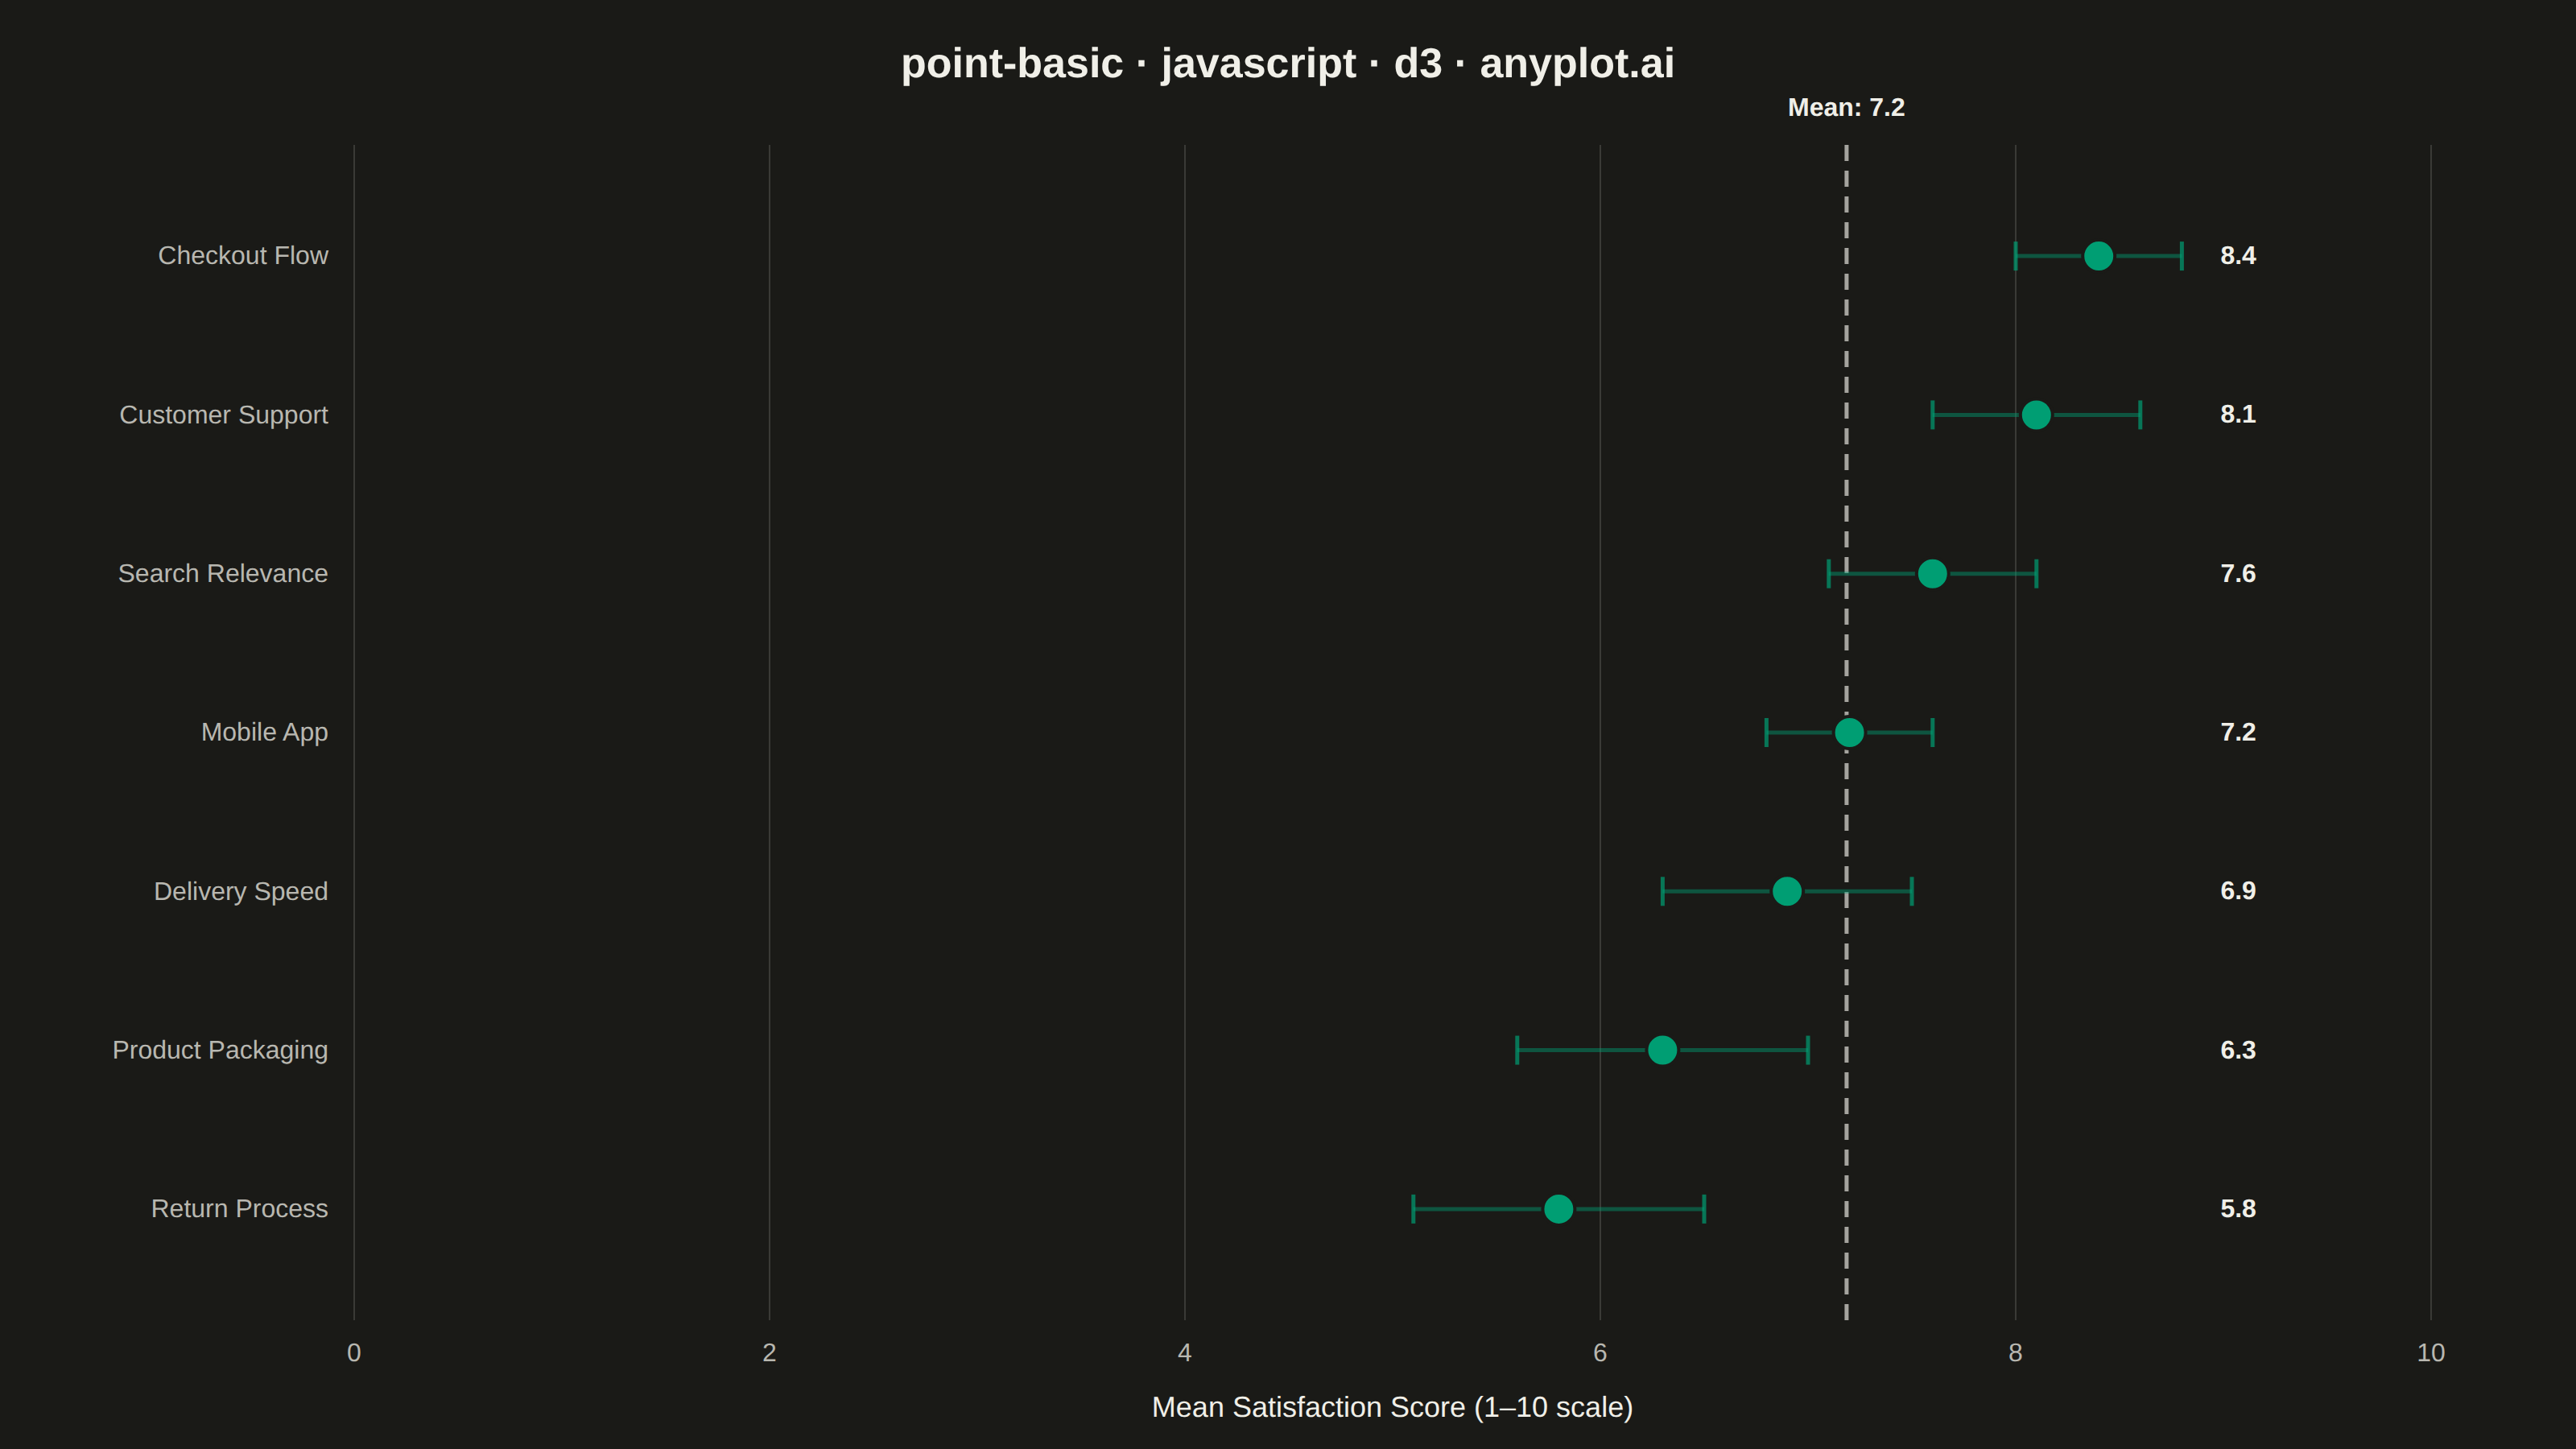
A point estimate plot displays central tendency values (means, medians, or other estimates) with confidence intervals or error bars for each category. Each point represents the estimate, and the lines extending from it show the uncertainty range.
// anyplot.ai
// point-basic: Point Estimate Plot
// Library: d3 7.9.0 | JavaScript 22.23.2
// Quality: 91/100 | Created: 2026-09-05

const t = window.ANYPLOT_TOKENS;
const { width, height } = window.ANYPLOT_SIZE;
const margin = { top: 90, right: 90, bottom: 80, left: 220 };
const iw = width - margin.left - margin.right;
const ih = height - margin.top - margin.bottom;

// --- Data: customer satisfaction survey, mean score (1-10) with 95% CI -----
const data = [
  { category: "Checkout Flow", estimate: 8.4, lower: 8.0, upper: 8.8 },
  { category: "Search Relevance", estimate: 7.6, lower: 7.1, upper: 8.1 },
  { category: "Delivery Speed", estimate: 6.9, lower: 6.3, upper: 7.5 },
  { category: "Mobile App", estimate: 7.2, lower: 6.8, upper: 7.6 },
  { category: "Customer Support", estimate: 8.1, lower: 7.6, upper: 8.6 },
  { category: "Product Packaging", estimate: 6.3, lower: 5.6, upper: 7.0 },
  { category: "Return Process", estimate: 5.8, lower: 5.1, upper: 6.5 },
];

// sort descending by estimate so the eye reads a clean ranking top to bottom
data.sort((a, b) => d3.descending(a.estimate, b.estimate));
const meanEstimate = d3.mean(data, (d) => d.estimate);
const maxUpper = d3.max(data, (d) => d.upper);
const fmt = d3.format(".1f");

// --- SVG mount ---------------------------------------------------------------
const svg = d3
  .select("#container")
  .append("svg")
  .attr("width", width)
  .attr("height", height);
const g = svg
  .append("g")
  .attr("transform", `translate(${margin.left},${margin.top})`);

// --- Scales --------------------------------------------------------------
const x = d3.scaleLinear().domain([0, 10]).nice().range([0, iw]);
const y = d3
  .scaleBand()
  .domain(data.map((d) => d.category))
  .range([0, ih])
  .padding(0.4);

// --- Gridlines (x-axis only, subtle) ---------------------------------------
g.append("g")
  .attr("class", "grid")
  .selectAll("line")
  .data(x.ticks(6))
  .join("line")
  .attr("x1", (d) => x(d))
  .attr("x2", (d) => x(d))
  .attr("y1", 0)
  .attr("y2", ih)
  .attr("stroke", t.grid)
  .attr("stroke-width", 1);

// --- Axes ------------------------------------------------------------------
const xAxis = g
  .append("g")
  .attr("transform", `translate(0,${ih})`)
  .call(
    d3
      .axisBottom(x)
      .ticks(6)
      .tickSize(0)
      .tickPadding(14)
      .tickFormat(d3.format(".0f")),
  );
const yAxis = g.append("g").call(d3.axisLeft(y).tickSize(0).tickPadding(16));

for (const ax of [xAxis, yAxis]) {
  ax.selectAll("text").attr("fill", t.inkSoft).style("font-size", "16px");
}
xAxis.select(".domain").remove();
yAxis.select(".domain").remove();

// --- Reference line: overall mean, the focal point the ranking is read against ---
// Sized/opacity-boosted (vs. a thin 1px hairline) so the dashes survive
// downsampling and stay unmistakable next to the bolder whiskers/caps.
g.append("line")
  .attr("x1", x(meanEstimate))
  .attr("x2", x(meanEstimate))
  .attr("y1", 0)
  .attr("y2", ih)
  .attr("stroke", t.ink)
  .attr("stroke-width", 2.5)
  .attr("stroke-dasharray", "10,6")
  .attr("opacity", 0.65);

g.append("text")
  .attr("x", x(meanEstimate))
  .attr("y", -18)
  .attr("text-anchor", "middle")
  .attr("fill", t.ink)
  .style("font-size", "16px")
  .style("font-weight", "600")
  .text(`Mean: ${fmt(meanEstimate)}`);

// --- Axis labels -------------------------------------------------------------
g.append("text")
  .attr("x", iw / 2)
  .attr("y", ih + 60)
  .attr("text-anchor", "middle")
  .attr("fill", t.ink)
  .style("font-size", "18px")
  .text("Mean Satisfaction Score (1–10 scale)");

// --- Confidence interval whiskers + caps ------------------------------------
const rows = g
  .selectAll(".row")
  .data(data)
  .join("g")
  .attr("class", "row")
  .attr(
    "transform",
    (d) => `translate(0,${y(d.category) + y.bandwidth() / 2})`,
  );

const capHalf = 9;

// whiskers + caps rendered at reduced opacity so the saturated point marker
// reads as the primary focal point of each row
rows
  .append("line")
  .attr("x1", (d) => x(d.lower))
  .attr("x2", (d) => x(d.upper))
  .attr("y1", 0)
  .attr("y2", 0)
  .attr("stroke", t.palette[0])
  .attr("stroke-width", 2.5)
  .attr("opacity", 0.45);

rows
  .append("line")
  .attr("x1", (d) => x(d.lower))
  .attr("x2", (d) => x(d.lower))
  .attr("y1", -capHalf)
  .attr("y2", capHalf)
  .attr("stroke", t.palette[0])
  .attr("stroke-width", 2.5)
  .attr("opacity", 0.7);

rows
  .append("line")
  .attr("x1", (d) => x(d.upper))
  .attr("x2", (d) => x(d.upper))
  .attr("y1", -capHalf)
  .attr("y2", capHalf)
  .attr("stroke", t.palette[0])
  .attr("stroke-width", 2.5)
  .attr("opacity", 0.7);

// --- Point estimates ---------------------------------------------------------
rows
  .append("circle")
  .attr("cx", (d) => x(d.estimate))
  .attr("cy", 0)
  .attr("r", 10)
  .attr("fill", t.palette[0])
  .attr("stroke", t.pageBg)
  .attr("stroke-width", 2);

// value labels via d3.format, aligned in a single column past the widest
// whisker so they never collide with a cap or the mean reference line
rows
  .append("text")
  .attr("x", x(maxUpper) + 24)
  .attr("y", 5)
  .attr("fill", t.ink)
  .style("font-size", "16px")
  .style("font-weight", "600")
  .text((d) => fmt(d.estimate));

// --- Title -------------------------------------------------------------------
svg
  .append("text")
  .attr("x", width / 2)
  .attr("y", 48)
  .attr("text-anchor", "middle")
  .attr("fill", t.ink)
  .style("font-size", "26px")
  .style("font-weight", "600")
  .text("point-basic · javascript · d3 · anyplot.ai");
Runnable source as JSON, for any HTTP client: https://api.anyplot.ai/specs/point-basic/d3/code. Any spec id and library id listed in llms-full.txt fit the same URL shape; every URL below is complete and callable.
{
  "spec_id": "point-basic",
  "language": "javascript",
  "library": "d3",
  "page": "https://anyplot.ai/point-basic/javascript/d3",
  "hub": "https://anyplot.ai/point-basic",
  "code_json": "https://api.anyplot.ai/specs/point-basic/d3/code",
  "spec_json": "https://api.anyplot.ai/specs/point-basic",
  "render_light_png": "https://storage.googleapis.com/anyplot-images/plots/point-basic/javascript/d3/plot-light.png",
  "render_dark_png": "https://storage.googleapis.com/anyplot-images/plots/point-basic/javascript/d3/plot-dark.png",
  "interactive_light_html": "https://storage.googleapis.com/anyplot-images/plots/point-basic/javascript/d3/plot-light.html",
  "interactive_dark_html": "https://storage.googleapis.com/anyplot-images/plots/point-basic/javascript/d3/plot-dark.html",
  "quality_score": 91.0,
  "license": "MIT",
  "guide": "https://anyplot.ai/llms.txt"
}
Part of Point Estimate Plot on anyplot.ai.