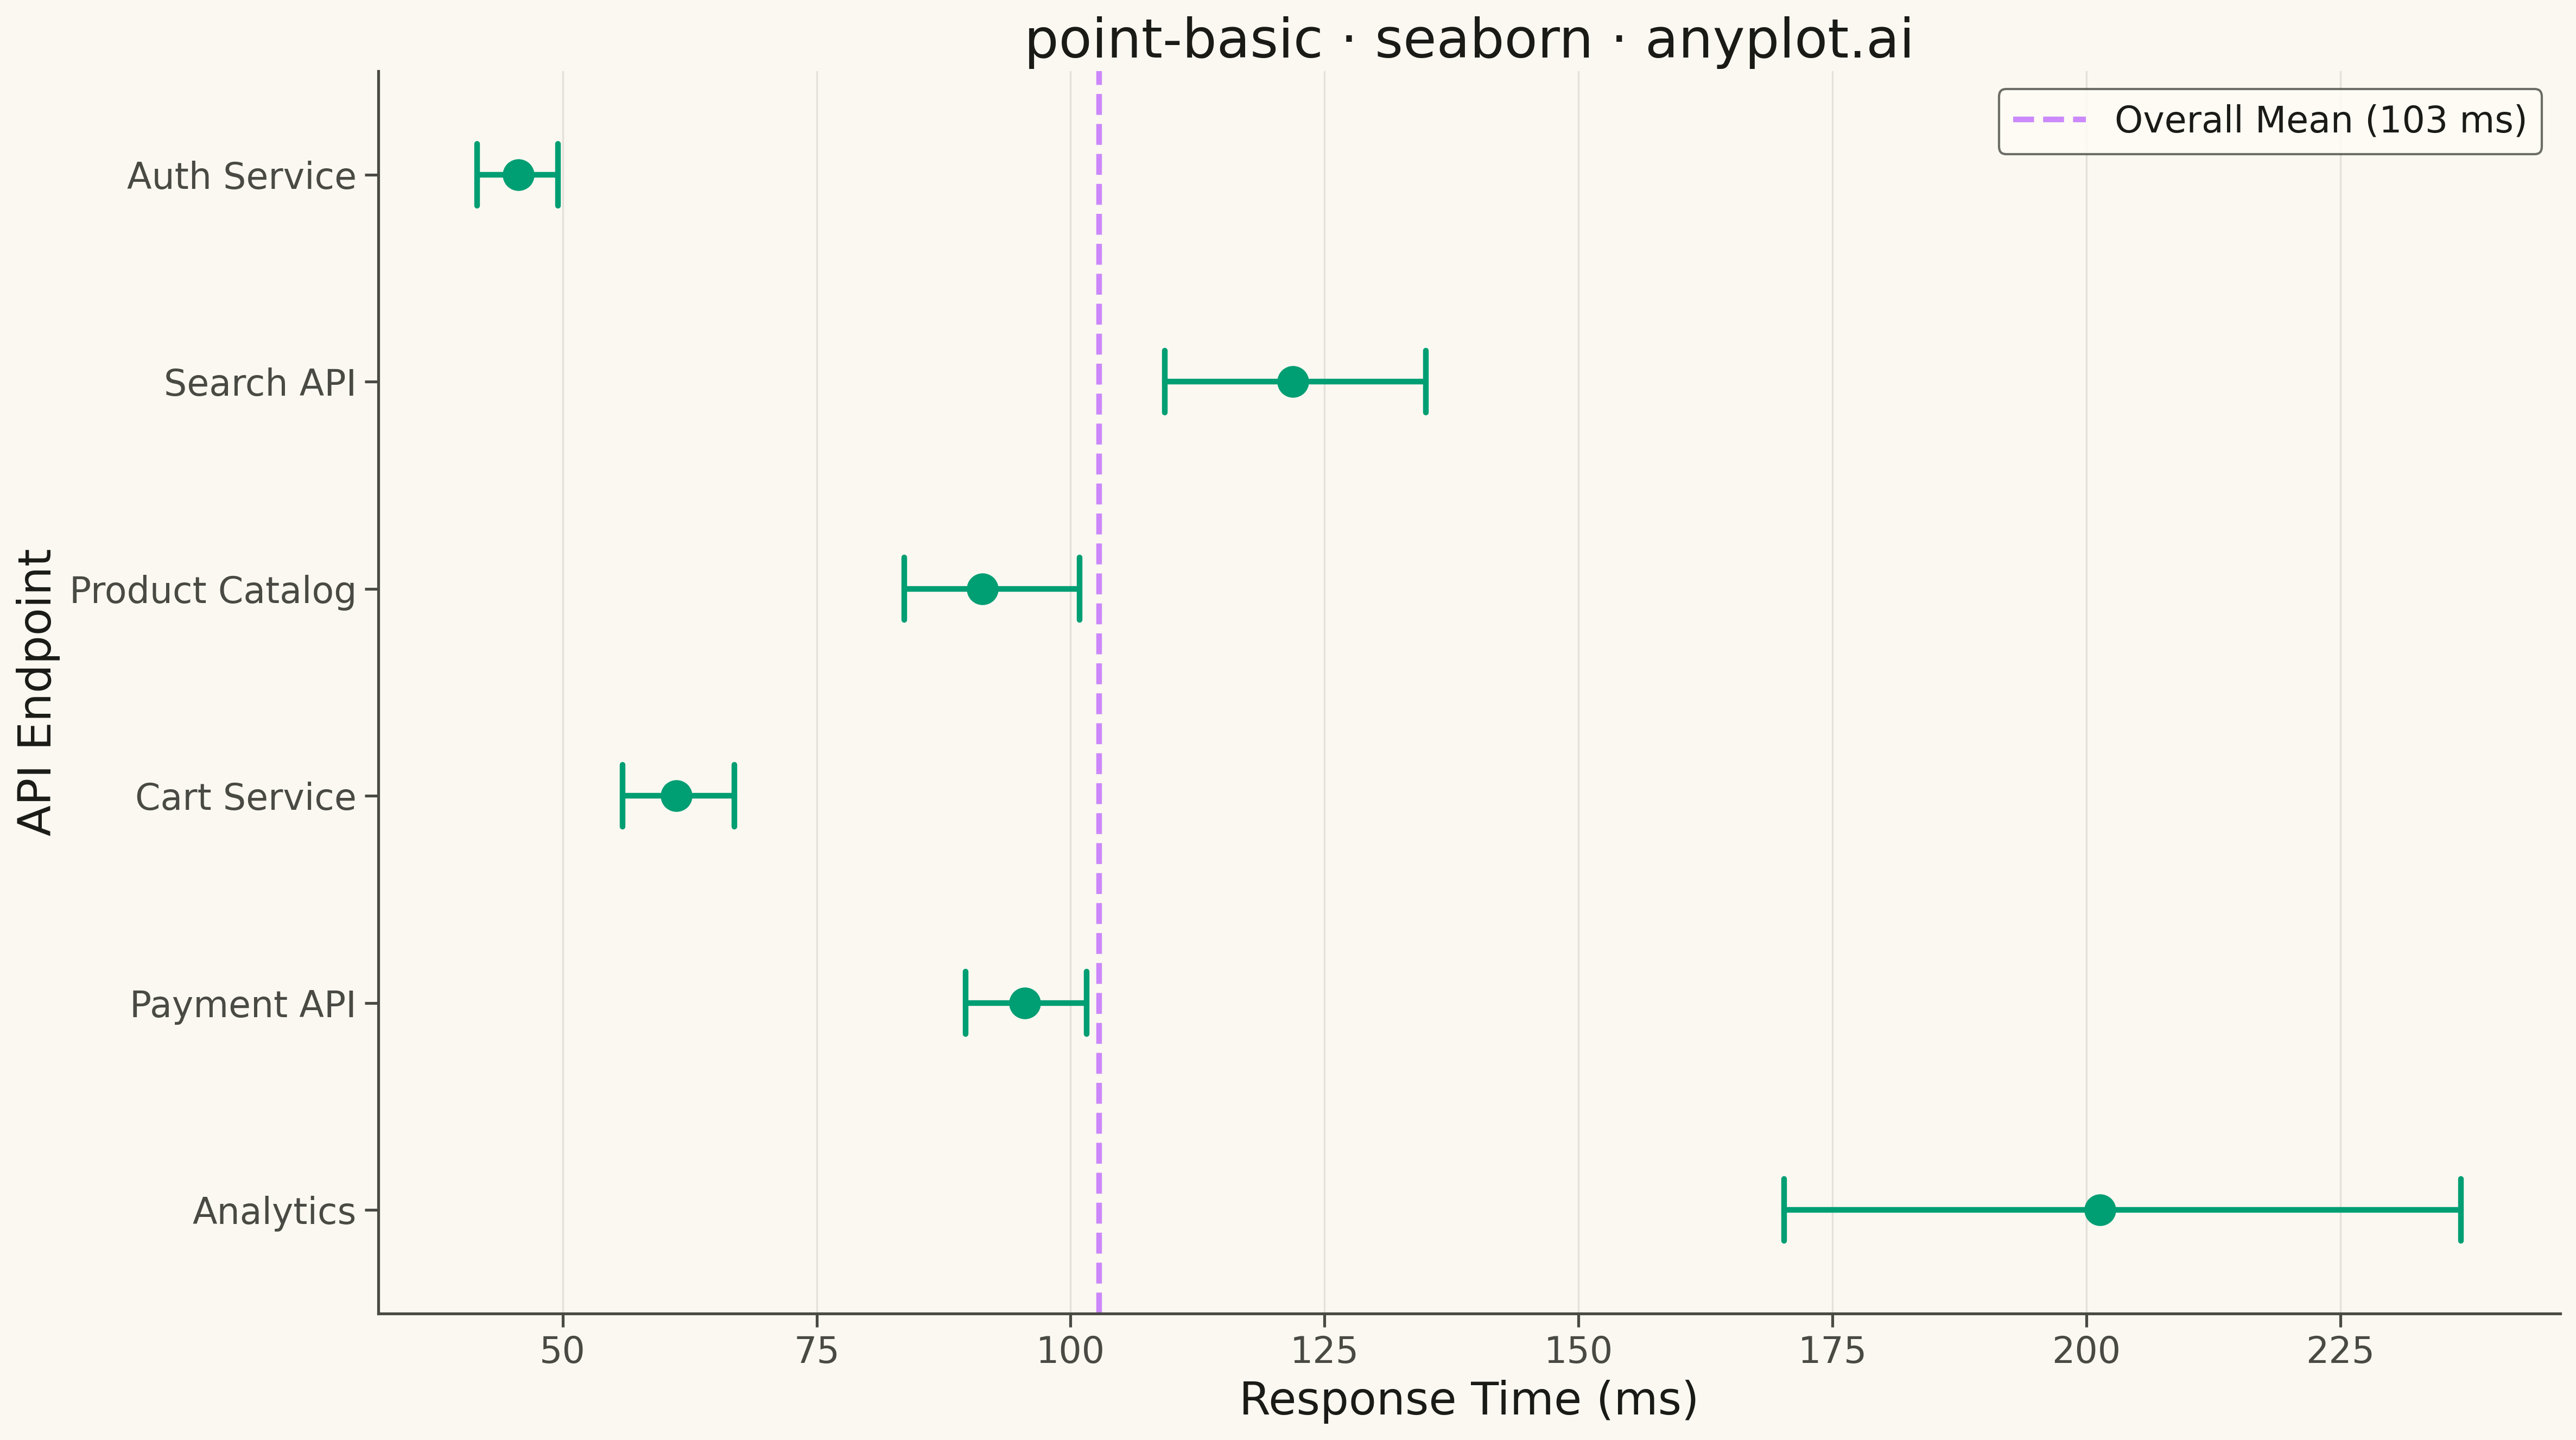
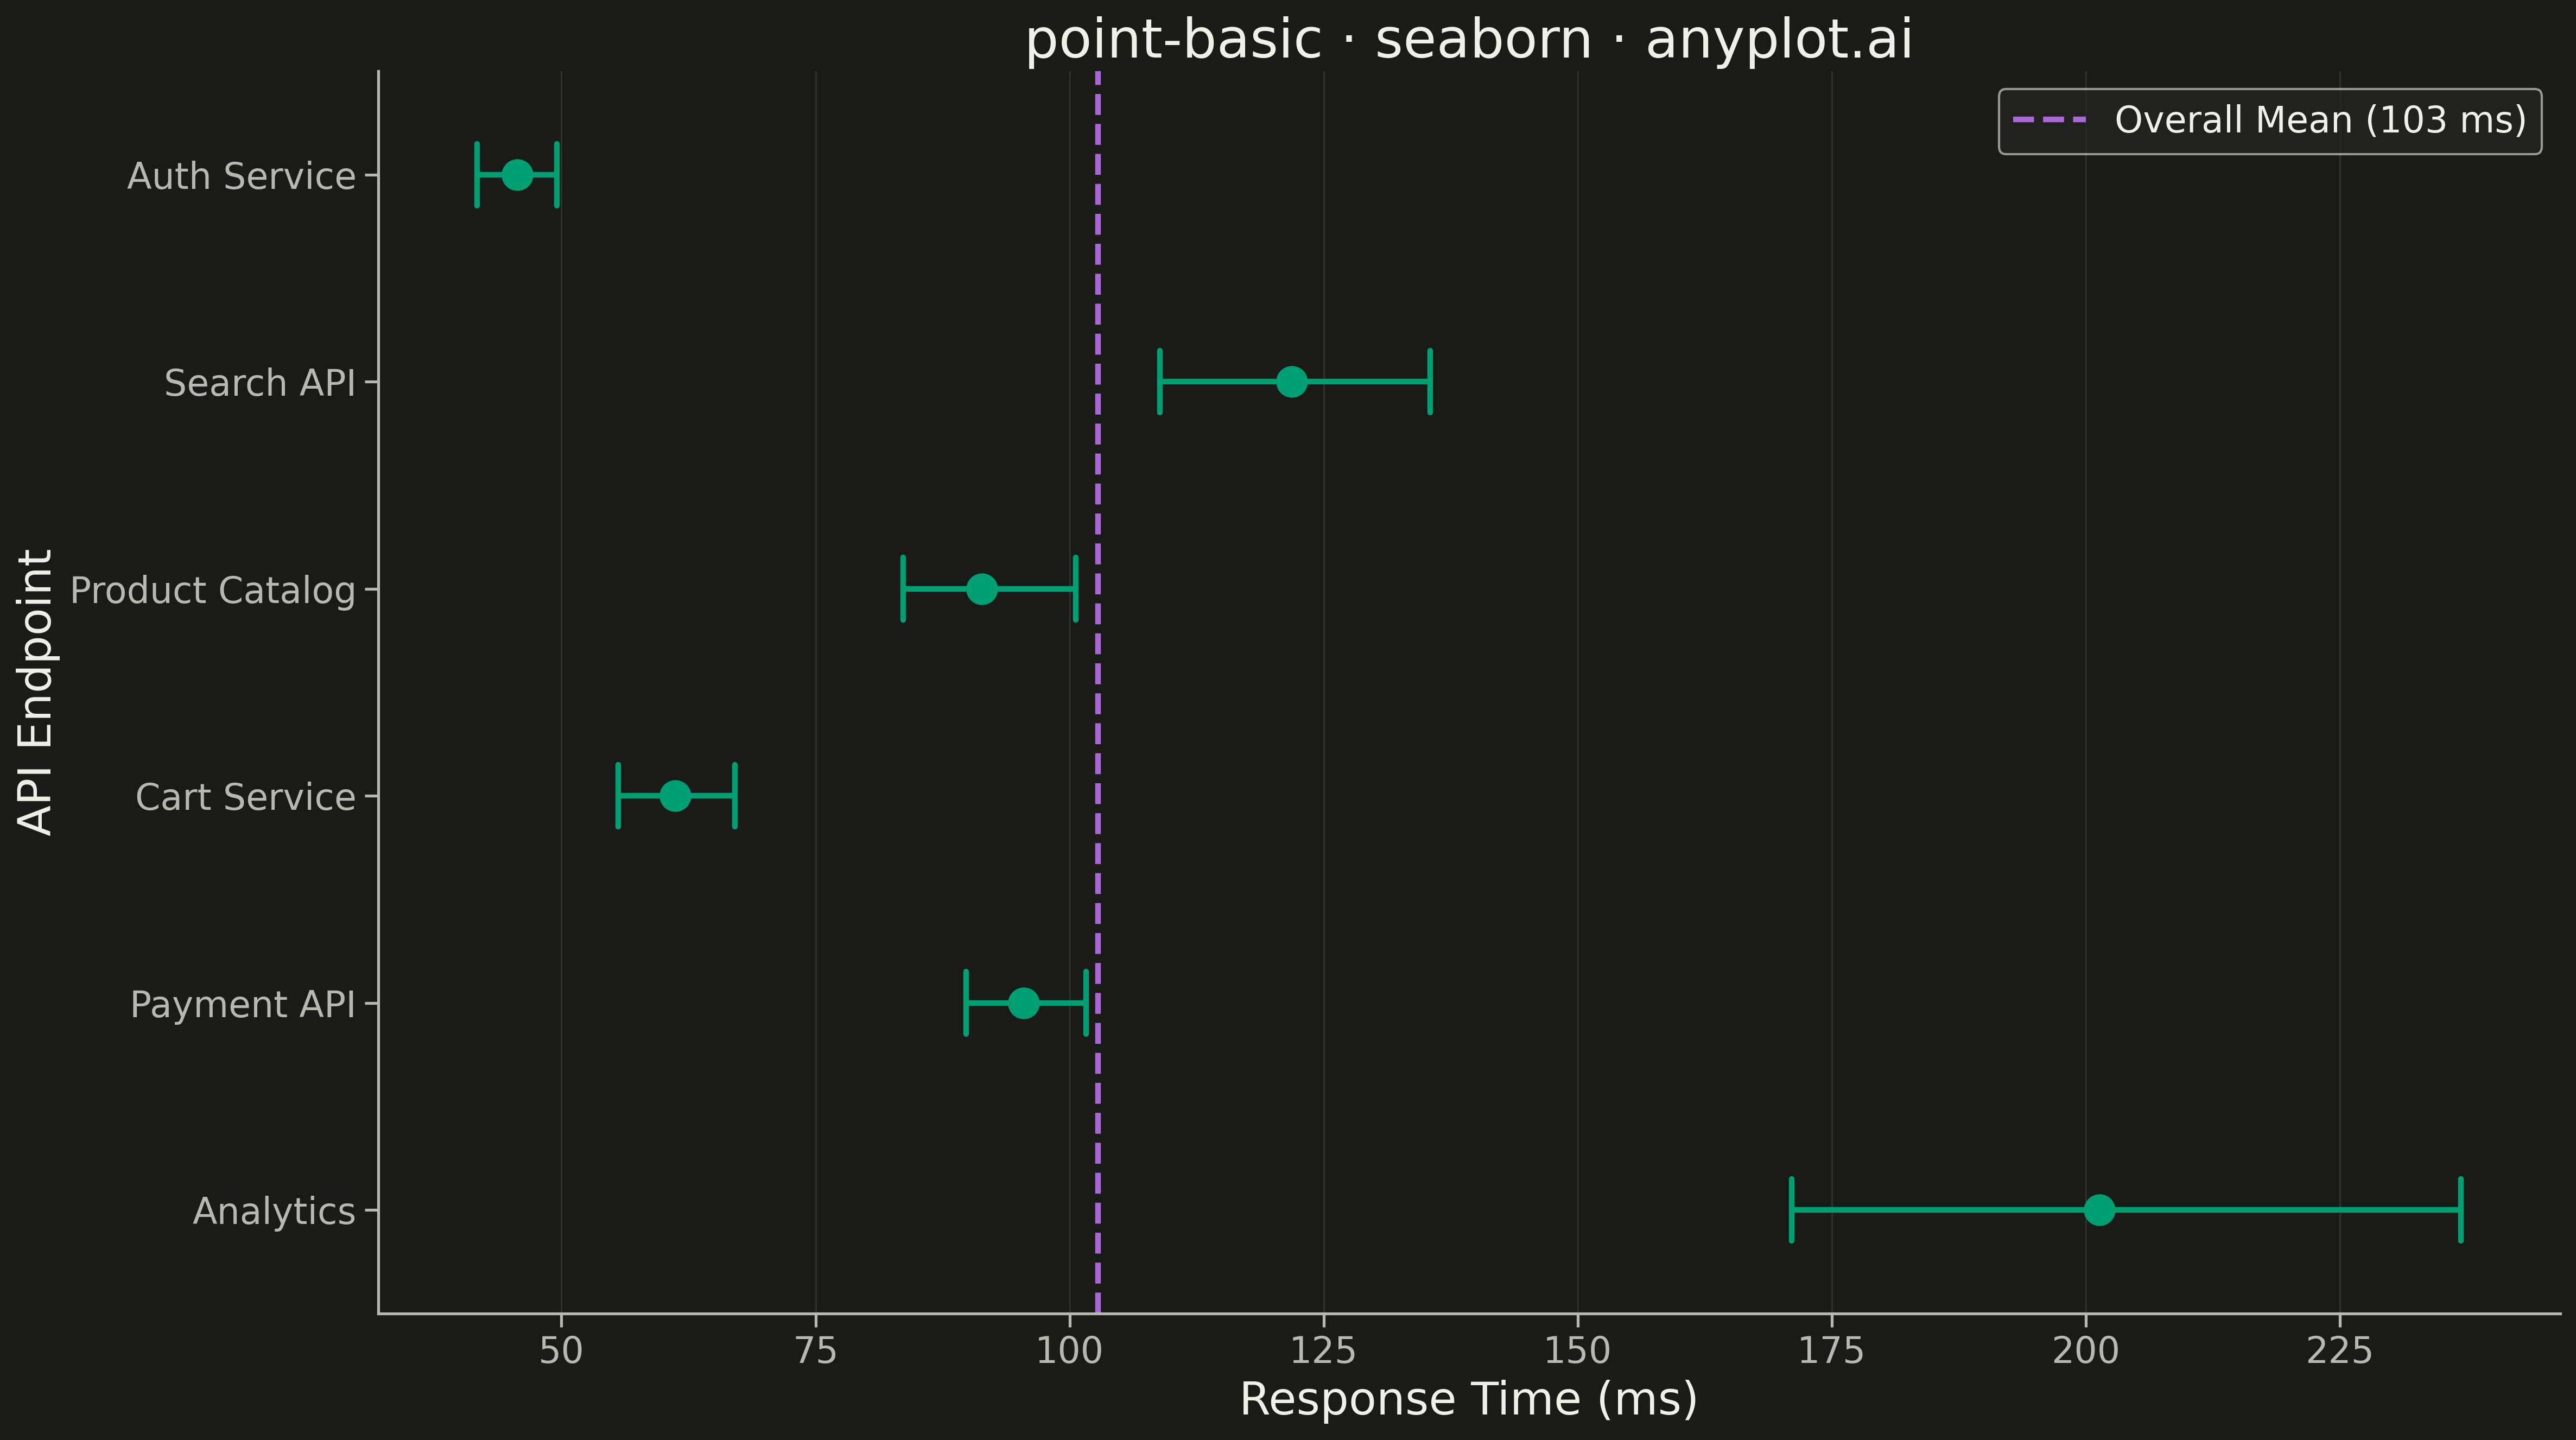
A point estimate plot displays central tendency values (means, medians, or other estimates) with confidence intervals or error bars for each category. Each point represents the estimate, and the lines extending from it show the uncertainty range.
""" anyplot.ai
point-basic: Point Estimate Plot
Library: seaborn 0.13.2 | Python 3.13.13
Quality: 91/100 | Updated: 2026-05-12
"""

import os

import matplotlib.pyplot as plt
import numpy as np
import pandas as pd
import seaborn as sns


# Theme tokens
THEME = os.getenv("ANYPLOT_THEME", "light")
PAGE_BG = "#FAF8F1" if THEME == "light" else "#1A1A17"
ELEVATED_BG = "#FFFDF6" if THEME == "light" else "#242420"
INK = "#1A1A17" if THEME == "light" else "#F0EFE8"
INK_SOFT = "#4A4A44" if THEME == "light" else "#B8B7B0"

BRAND = "#009E73"  # Okabe-Ito position 1 — first series
REF_COLOR = "#C475FD"  # Okabe-Ito position 2 — reference line

sns.set_theme(
    style="ticks",
    rc={
        "figure.facecolor": PAGE_BG,
        "axes.facecolor": PAGE_BG,
        "axes.edgecolor": INK_SOFT,
        "axes.labelcolor": INK,
        "text.color": INK,
        "xtick.color": INK_SOFT,
        "ytick.color": INK_SOFT,
        "grid.color": INK,
        "grid.alpha": 0.10,
        "legend.facecolor": ELEVATED_BG,
        "legend.edgecolor": INK_SOFT,
    },
)

# Data: API endpoint response times (ms) — log-normal for realistic right-skewed latency
np.random.seed(42)
endpoints = ["Auth Service", "Search API", "Product Catalog", "Cart Service", "Payment API", "Analytics"]
# (mu, sigma) for log-normal → naturally asymmetric bootstrap CIs
lognorm_params = [
    (3.8, 0.40),  # Auth Service:      ~50ms mean
    (4.7, 0.50),  # Search API:       ~130ms mean
    (4.4, 0.35),  # Product Catalog:   ~90ms mean
    (4.0, 0.45),  # Cart Service:      ~60ms mean
    (4.5, 0.30),  # Payment API:      ~100ms mean
    (5.1, 0.60),  # Analytics:        ~200ms mean
]

records = []
for endpoint, (mu, sigma) in zip(endpoints, lognorm_params, strict=True):
    times = np.random.lognormal(mu, sigma, 80)
    for t in times:
        records.append({"Endpoint": endpoint, "Response Time (ms)": t})

df = pd.DataFrame(records)

# Plot
fig, ax = plt.subplots(figsize=(16, 9), facecolor=PAGE_BG)
ax.set_facecolor(PAGE_BG)

# Seaborn native 95% bootstrap CI — asymmetric due to log-normal skew
sns.pointplot(
    data=df,
    x="Response Time (ms)",
    y="Endpoint",
    orient="h",
    color=BRAND,
    markers="o",
    markersize=12,
    linestyle="none",
    errorbar=("ci", 95),
    err_kws={"linewidth": 2.5},
    capsize=0.3,
    ax=ax,
)

# Reference line at overall mean
overall_mean = df["Response Time (ms)"].mean()
ax.axvline(
    x=overall_mean,
    color=REF_COLOR,
    linestyle="--",
    linewidth=2.5,
    alpha=0.85,
    label=f"Overall Mean ({overall_mean:.0f} ms)",
)

# Style
ax.set_xlabel("Response Time (ms)", fontsize=20, color=INK)
ax.set_ylabel("API Endpoint", fontsize=20, color=INK)
ax.set_title("point-basic · seaborn · anyplot.ai", fontsize=24, fontweight="medium", color=INK)
ax.tick_params(axis="both", labelsize=16)
ax.spines["top"].set_visible(False)
ax.spines["right"].set_visible(False)
ax.xaxis.grid(True, alpha=0.10, linewidth=0.8)

ax.legend(fontsize=16, loc="upper right", frameon=True)

plt.tight_layout()
plt.savefig(f"plot-{THEME}.png", dpi=300, bbox_inches="tight", facecolor=PAGE_BG)
Runnable source as JSON, for any HTTP client: https://api.anyplot.ai/specs/point-basic/seaborn/code. Any spec id and library id listed in llms-full.txt fit the same URL shape; every URL below is complete and callable.
{
  "spec_id": "point-basic",
  "language": "python",
  "library": "seaborn",
  "page": "https://anyplot.ai/point-basic/python/seaborn",
  "hub": "https://anyplot.ai/point-basic",
  "code_json": "https://api.anyplot.ai/specs/point-basic/seaborn/code",
  "spec_json": "https://api.anyplot.ai/specs/point-basic",
  "render_light_png": "https://storage.googleapis.com/anyplot-images/plots/point-basic/python/seaborn/plot-light.png",
  "render_dark_png": "https://storage.googleapis.com/anyplot-images/plots/point-basic/python/seaborn/plot-dark.png",
  "quality_score": 91.0,
  "license": "MIT",
  "guide": "https://anyplot.ai/llms.txt"
}
Part of Point Estimate Plot on anyplot.ai.