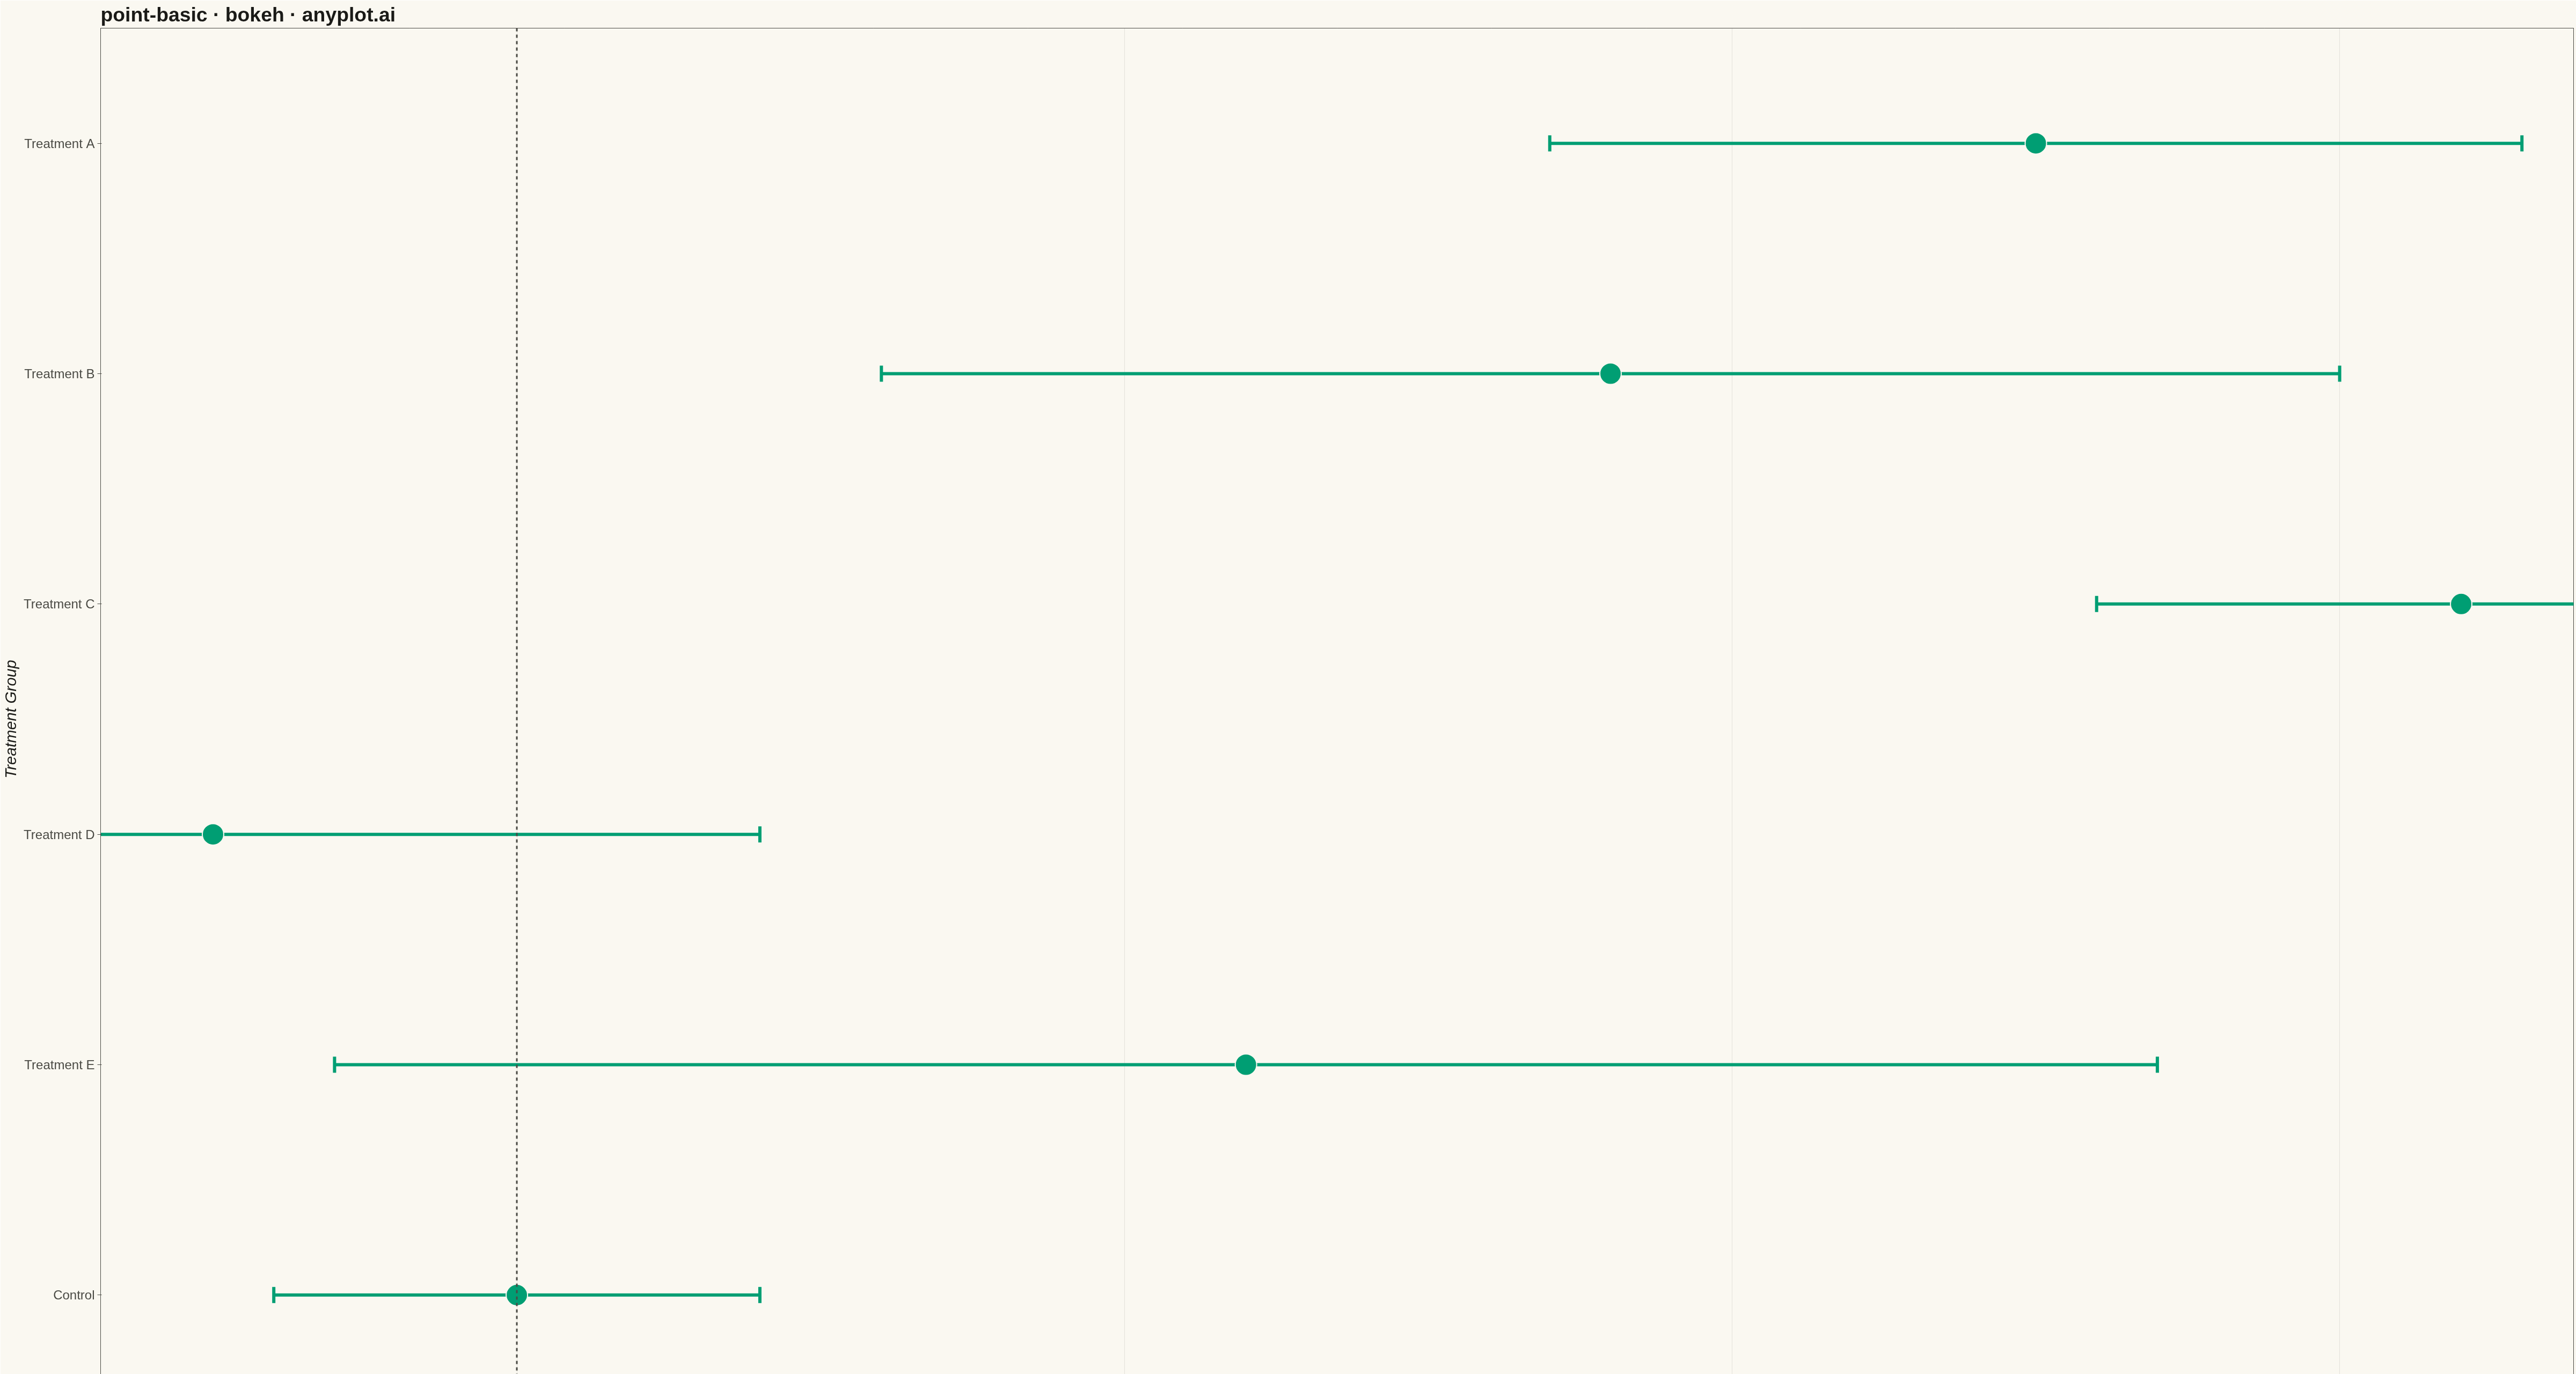
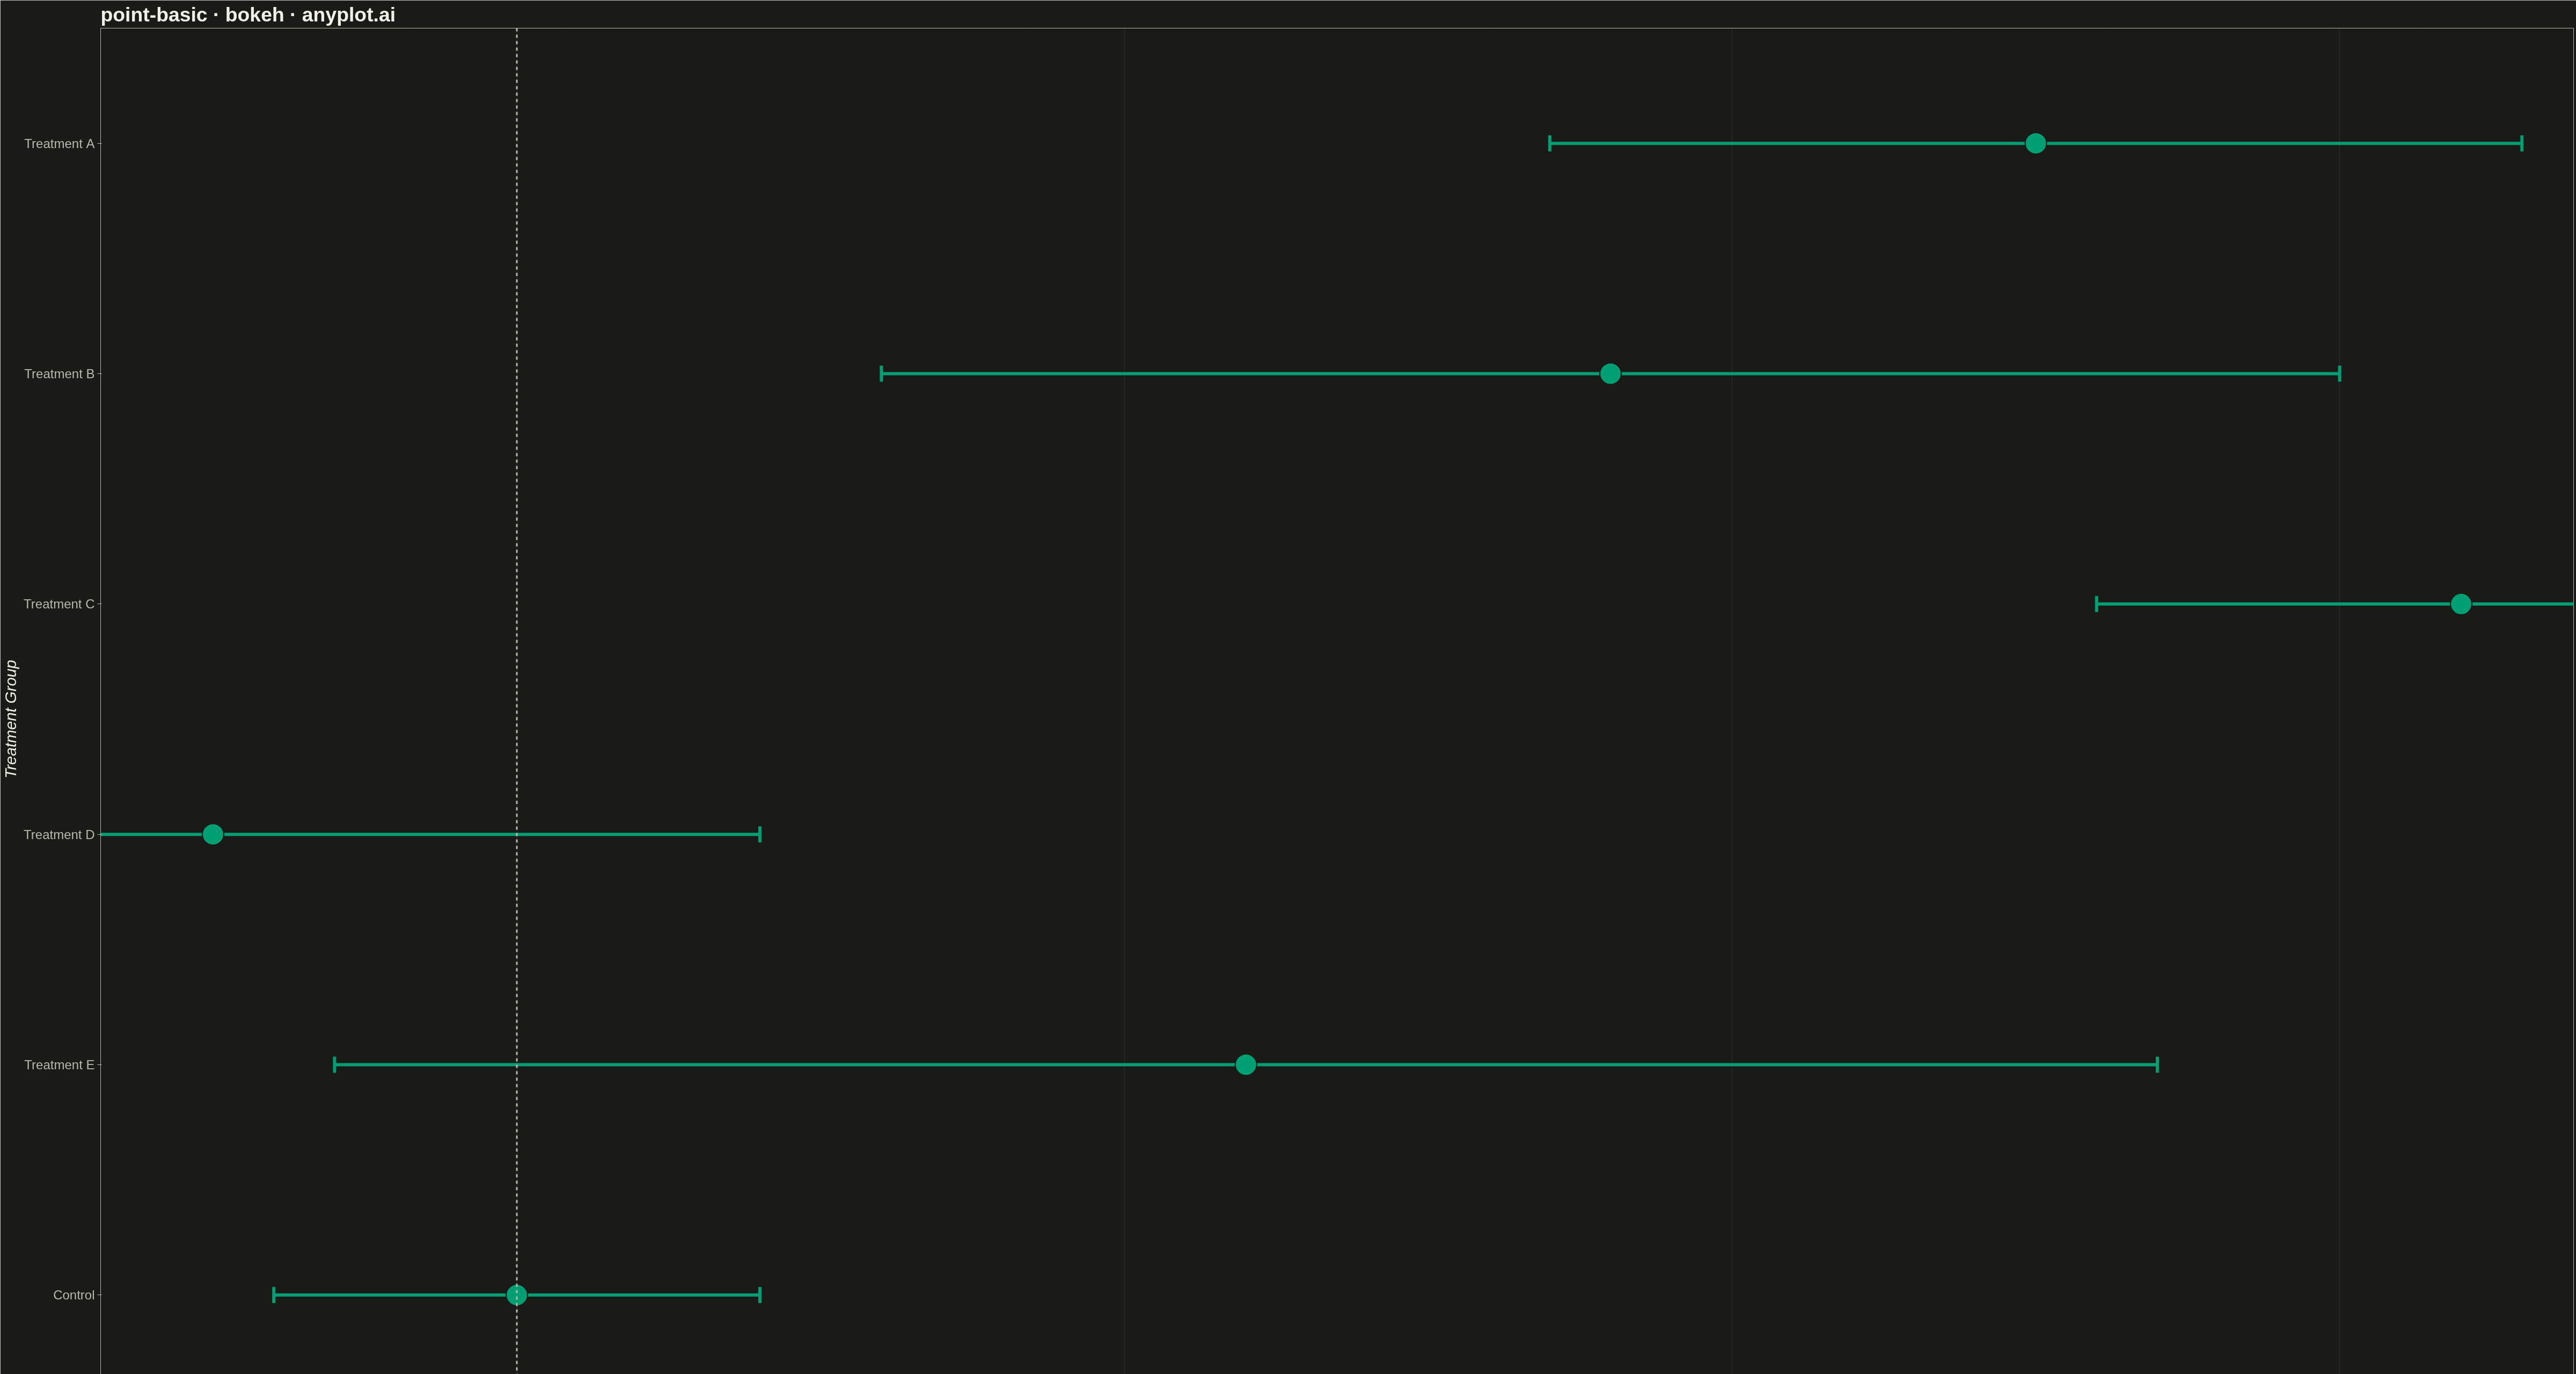
A point estimate plot displays central tendency values (means, medians, or other estimates) with confidence intervals or error bars for each category. Each point represents the estimate, and the lines extending from it show the uncertainty range.
""" anyplot.ai
point-basic: Point Estimate Plot
Library: bokeh 3.9.0 | Python 3.13.13
Quality: 92/100 | Updated: 2026-05-11
"""

import os
import sys
import time
from pathlib import Path

import numpy as np
from selenium import webdriver
from selenium.webdriver.chrome.options import Options


# Avoid shadowing bokeh module - remove current directory from path
_original_path = sys.path.copy()
sys.path = [p for p in sys.path if p not in ("", ".", str(Path(__file__).parent))]

try:
    import bokeh.io as bk_io
    import bokeh.models as bk_models
    import bokeh.plotting as bk_plotting
finally:
    sys.path = _original_path


# Theme tokens
THEME = os.getenv("ANYPLOT_THEME", "light")
PAGE_BG = "#FAF8F1" if THEME == "light" else "#1A1A17"
ELEVATED_BG = "#FFFDF6" if THEME == "light" else "#242420"
INK = "#1A1A17" if THEME == "light" else "#F0EFE8"
INK_SOFT = "#4A4A44" if THEME == "light" else "#B8B7B0"
BRAND = "#009E73"

# Data - Effect sizes for different treatment groups with 95% confidence intervals
np.random.seed(42)
categories = ["Treatment A", "Treatment B", "Treatment C", "Treatment D", "Treatment E", "Control"]
estimates = np.array([2.5, 1.8, 3.2, -0.5, 1.2, 0.0])
ci_widths = np.array([0.8, 1.2, 0.6, 0.9, 1.5, 0.4])
lower = estimates - ci_widths
upper = estimates + ci_widths

# Create ColumnDataSource
source = bk_models.ColumnDataSource(
    data={"categories": categories, "estimates": estimates, "lower": lower, "upper": upper}
)

# Create figure with categorical y-axis (horizontal orientation)
p = bk_plotting.figure(
    width=4800,
    height=2700,
    y_range=categories[::-1],
    title="point-basic · bokeh · anyplot.ai",
    x_axis_label="Effect Size",
    y_axis_label="Treatment Group",
)

# Add reference line at zero
zero_line = bk_models.Span(location=0, dimension="height", line_color=INK_SOFT, line_width=3, line_dash="dashed")
p.add_layout(zero_line)

# Add error bars with caps
whisker = bk_models.Whisker(
    source=source,
    base="categories",
    lower="lower",
    upper="upper",
    dimension="width",
    line_color=BRAND,
    line_width=6,
    upper_head=bk_models.TeeHead(size=30, line_color=BRAND, line_width=6),
    lower_head=bk_models.TeeHead(size=30, line_color=BRAND, line_width=6),
)
p.add_layout(whisker)

# Plot points with larger markers
p.scatter(x="estimates", y="categories", source=source, size=40, color=BRAND, line_width=2, line_color=PAGE_BG)

# Typography sizing
p.title.text_font_size = "28pt"
p.xaxis.axis_label_text_font_size = "22pt"
p.yaxis.axis_label_text_font_size = "22pt"
p.xaxis.major_label_text_font_size = "18pt"
p.yaxis.major_label_text_font_size = "18pt"

# Theme-adaptive colors
p.background_fill_color = PAGE_BG
p.border_fill_color = PAGE_BG
p.outline_line_color = INK_SOFT

p.title.text_color = INK
p.xaxis.axis_label_text_color = INK
p.yaxis.axis_label_text_color = INK
p.xaxis.major_label_text_color = INK_SOFT
p.yaxis.major_label_text_color = INK_SOFT
p.xaxis.axis_line_color = INK_SOFT
p.yaxis.axis_line_color = INK_SOFT
p.xaxis.major_tick_line_color = INK_SOFT
p.yaxis.major_tick_line_color = INK_SOFT

p.xgrid.grid_line_color = INK
p.xgrid.grid_line_alpha = 0.10
p.ygrid.grid_line_alpha = 0.0

# Remove toolbar
p.toolbar_location = None

# Save HTML
bk_io.output_file(f"plot-{THEME}.html")
bk_io.save(p)

# Screenshot with headless Chrome
W, H = 4800, 2700
opts = Options()
for arg in (
    "--headless=new",
    "--no-sandbox",
    "--disable-dev-shm-usage",
    "--disable-gpu",
    f"--window-size={W},{H}",
    "--hide-scrollbars",
):
    opts.add_argument(arg)
driver = webdriver.Chrome(options=opts)
driver.set_window_size(W, H)
driver.get(f"file://{Path(f'plot-{THEME}.html').resolve()}")
time.sleep(3)
driver.save_screenshot(f"plot-{THEME}.png")
driver.quit()
Runnable source as JSON, for any HTTP client: https://api.anyplot.ai/specs/point-basic/bokeh/code. Any spec id and library id listed in llms-full.txt fit the same URL shape; every URL below is complete and callable.
{
  "spec_id": "point-basic",
  "language": "python",
  "library": "bokeh",
  "page": "https://anyplot.ai/point-basic/python/bokeh",
  "hub": "https://anyplot.ai/point-basic",
  "code_json": "https://api.anyplot.ai/specs/point-basic/bokeh/code",
  "spec_json": "https://api.anyplot.ai/specs/point-basic",
  "render_light_png": "https://storage.googleapis.com/anyplot-images/plots/point-basic/python/bokeh/plot-light.png",
  "render_dark_png": "https://storage.googleapis.com/anyplot-images/plots/point-basic/python/bokeh/plot-dark.png",
  "interactive_light_html": "https://storage.googleapis.com/anyplot-images/plots/point-basic/python/bokeh/plot-light.html",
  "interactive_dark_html": "https://storage.googleapis.com/anyplot-images/plots/point-basic/python/bokeh/plot-dark.html",
  "quality_score": 92.0,
  "license": "MIT",
  "guide": "https://anyplot.ai/llms.txt"
}
Part of Point Estimate Plot on anyplot.ai.