The same plot in 14 other libraries — JavaScript: D3.js, Apache ECharts, Highcharts, MUI X Charts; Python: Altair, Bokeh, lets-plot, Matplotlib, Plotly, plotnine, Pygal, Seaborn; R: ggplot2; Julia: Makie.jl. Compare all 15 side by side: Basic Polar Chart in Python, R, Julia and JavaScript.
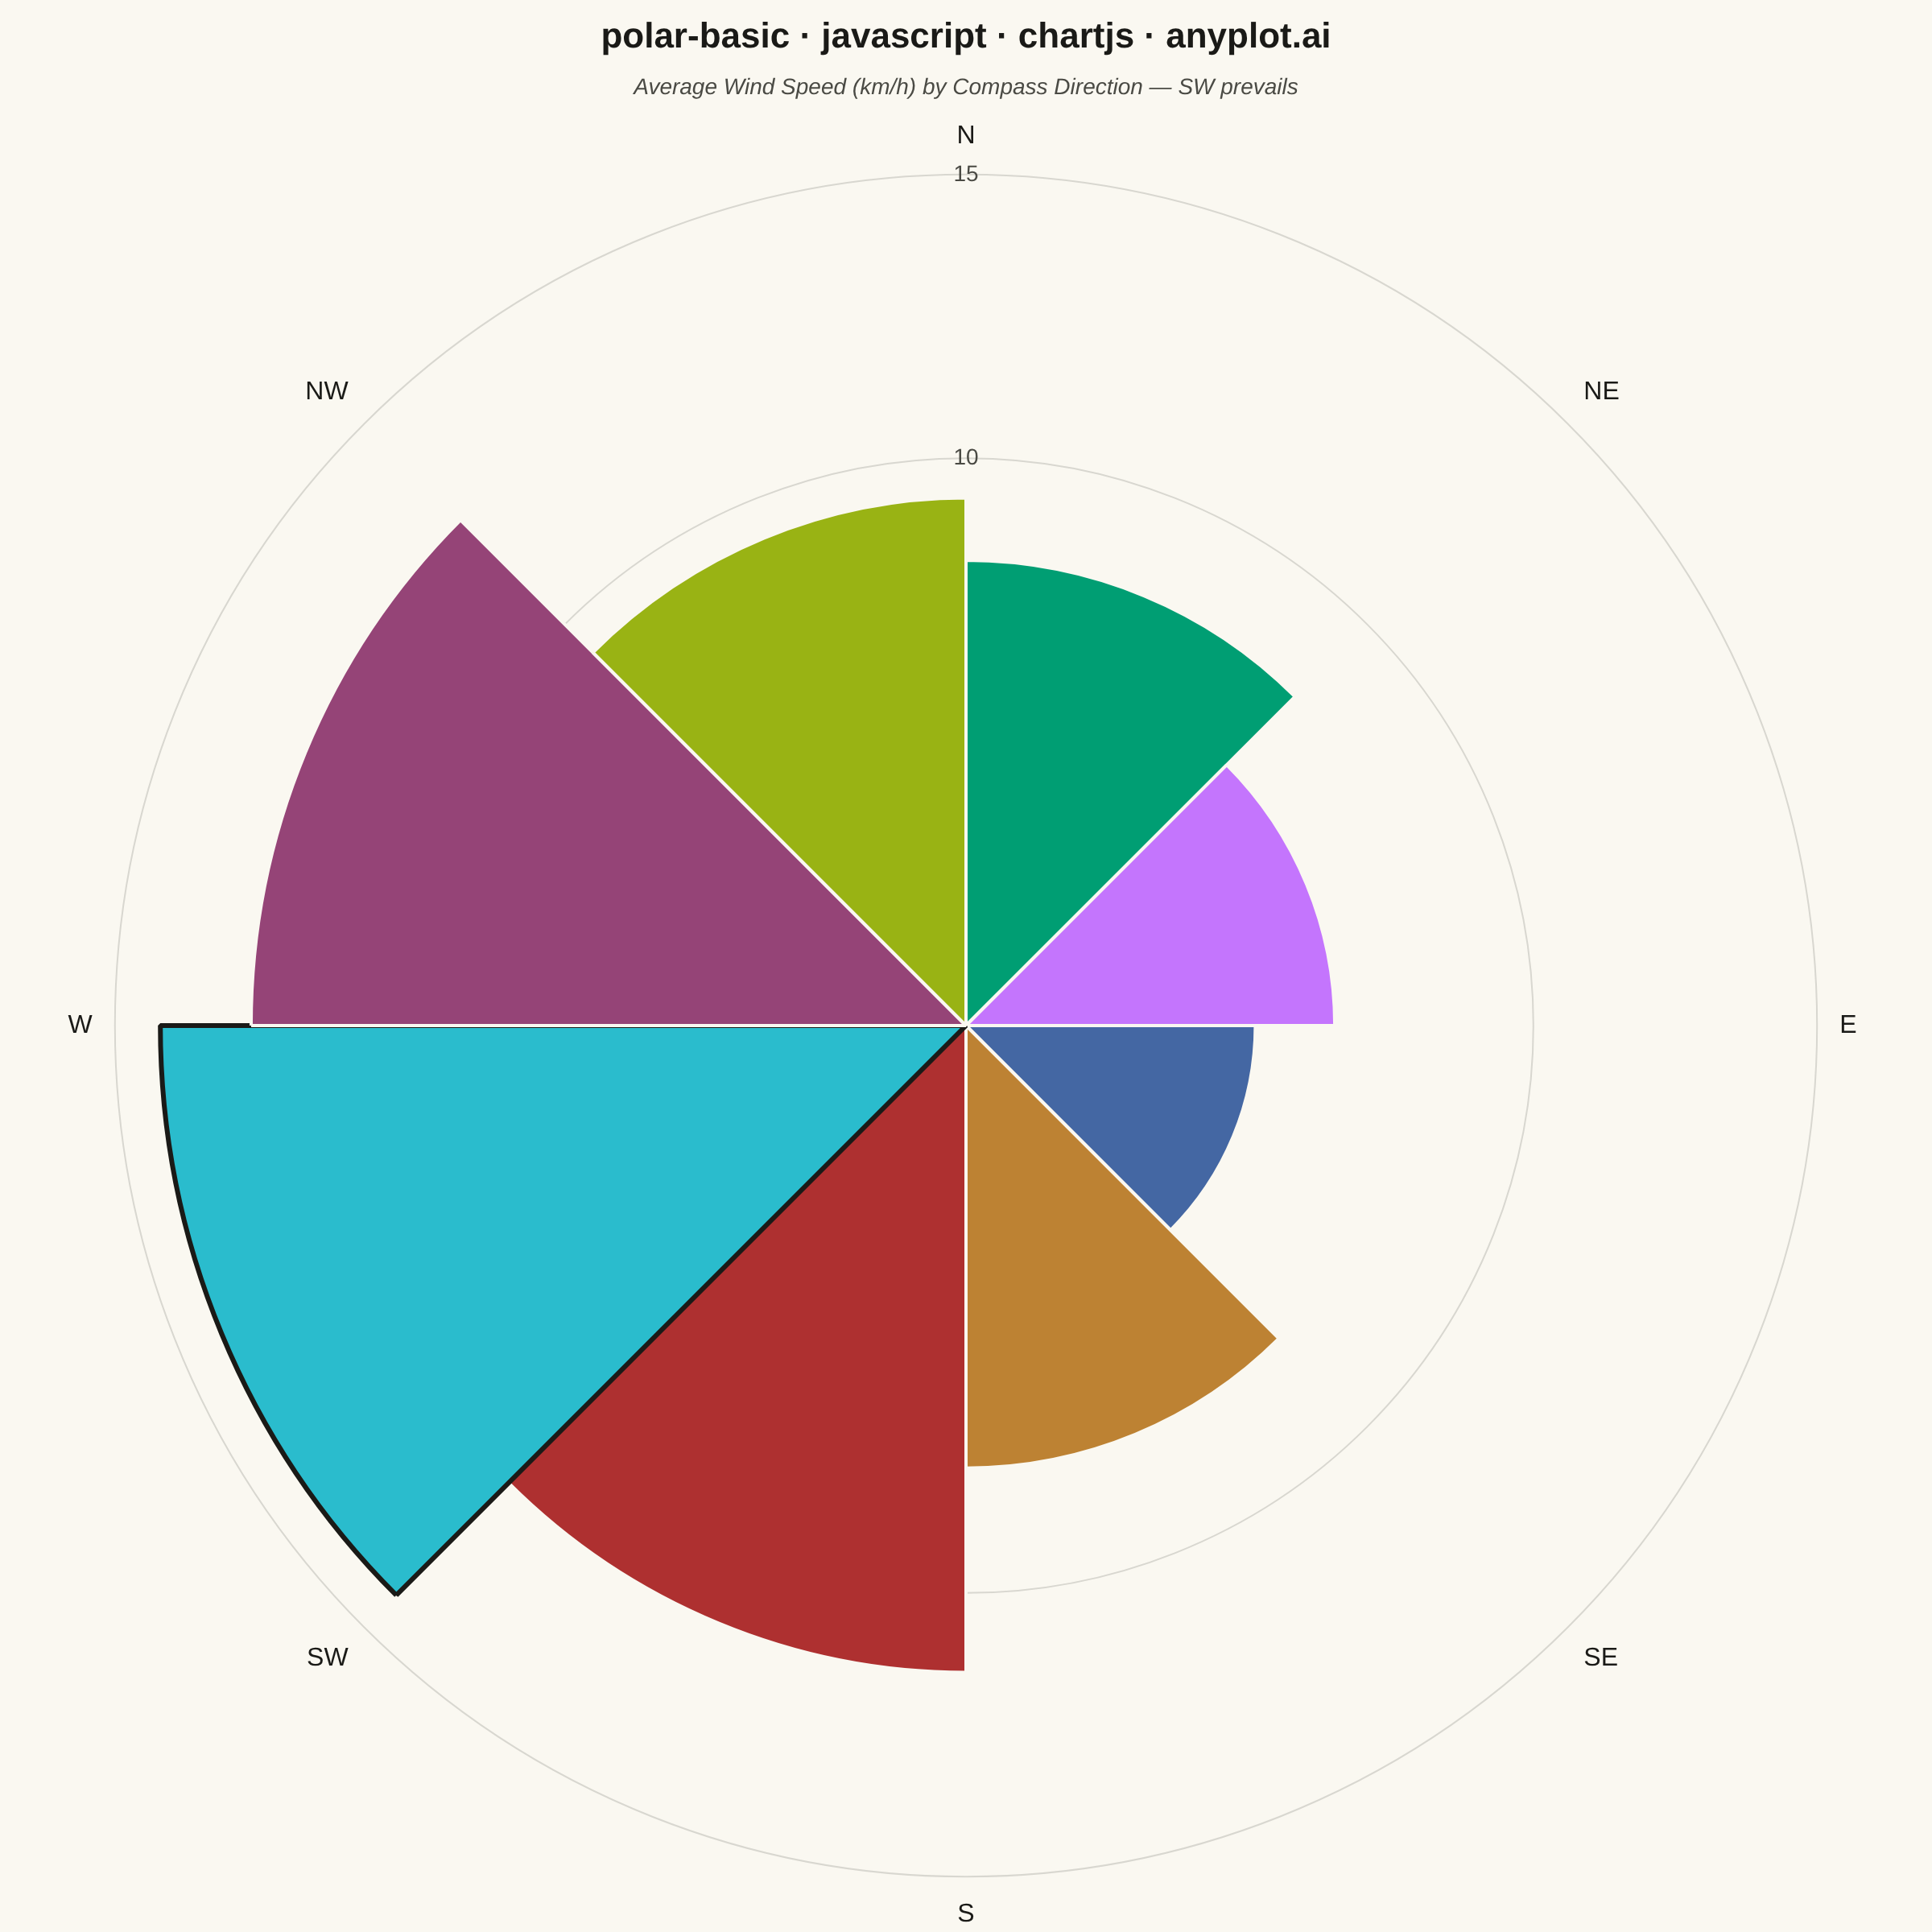
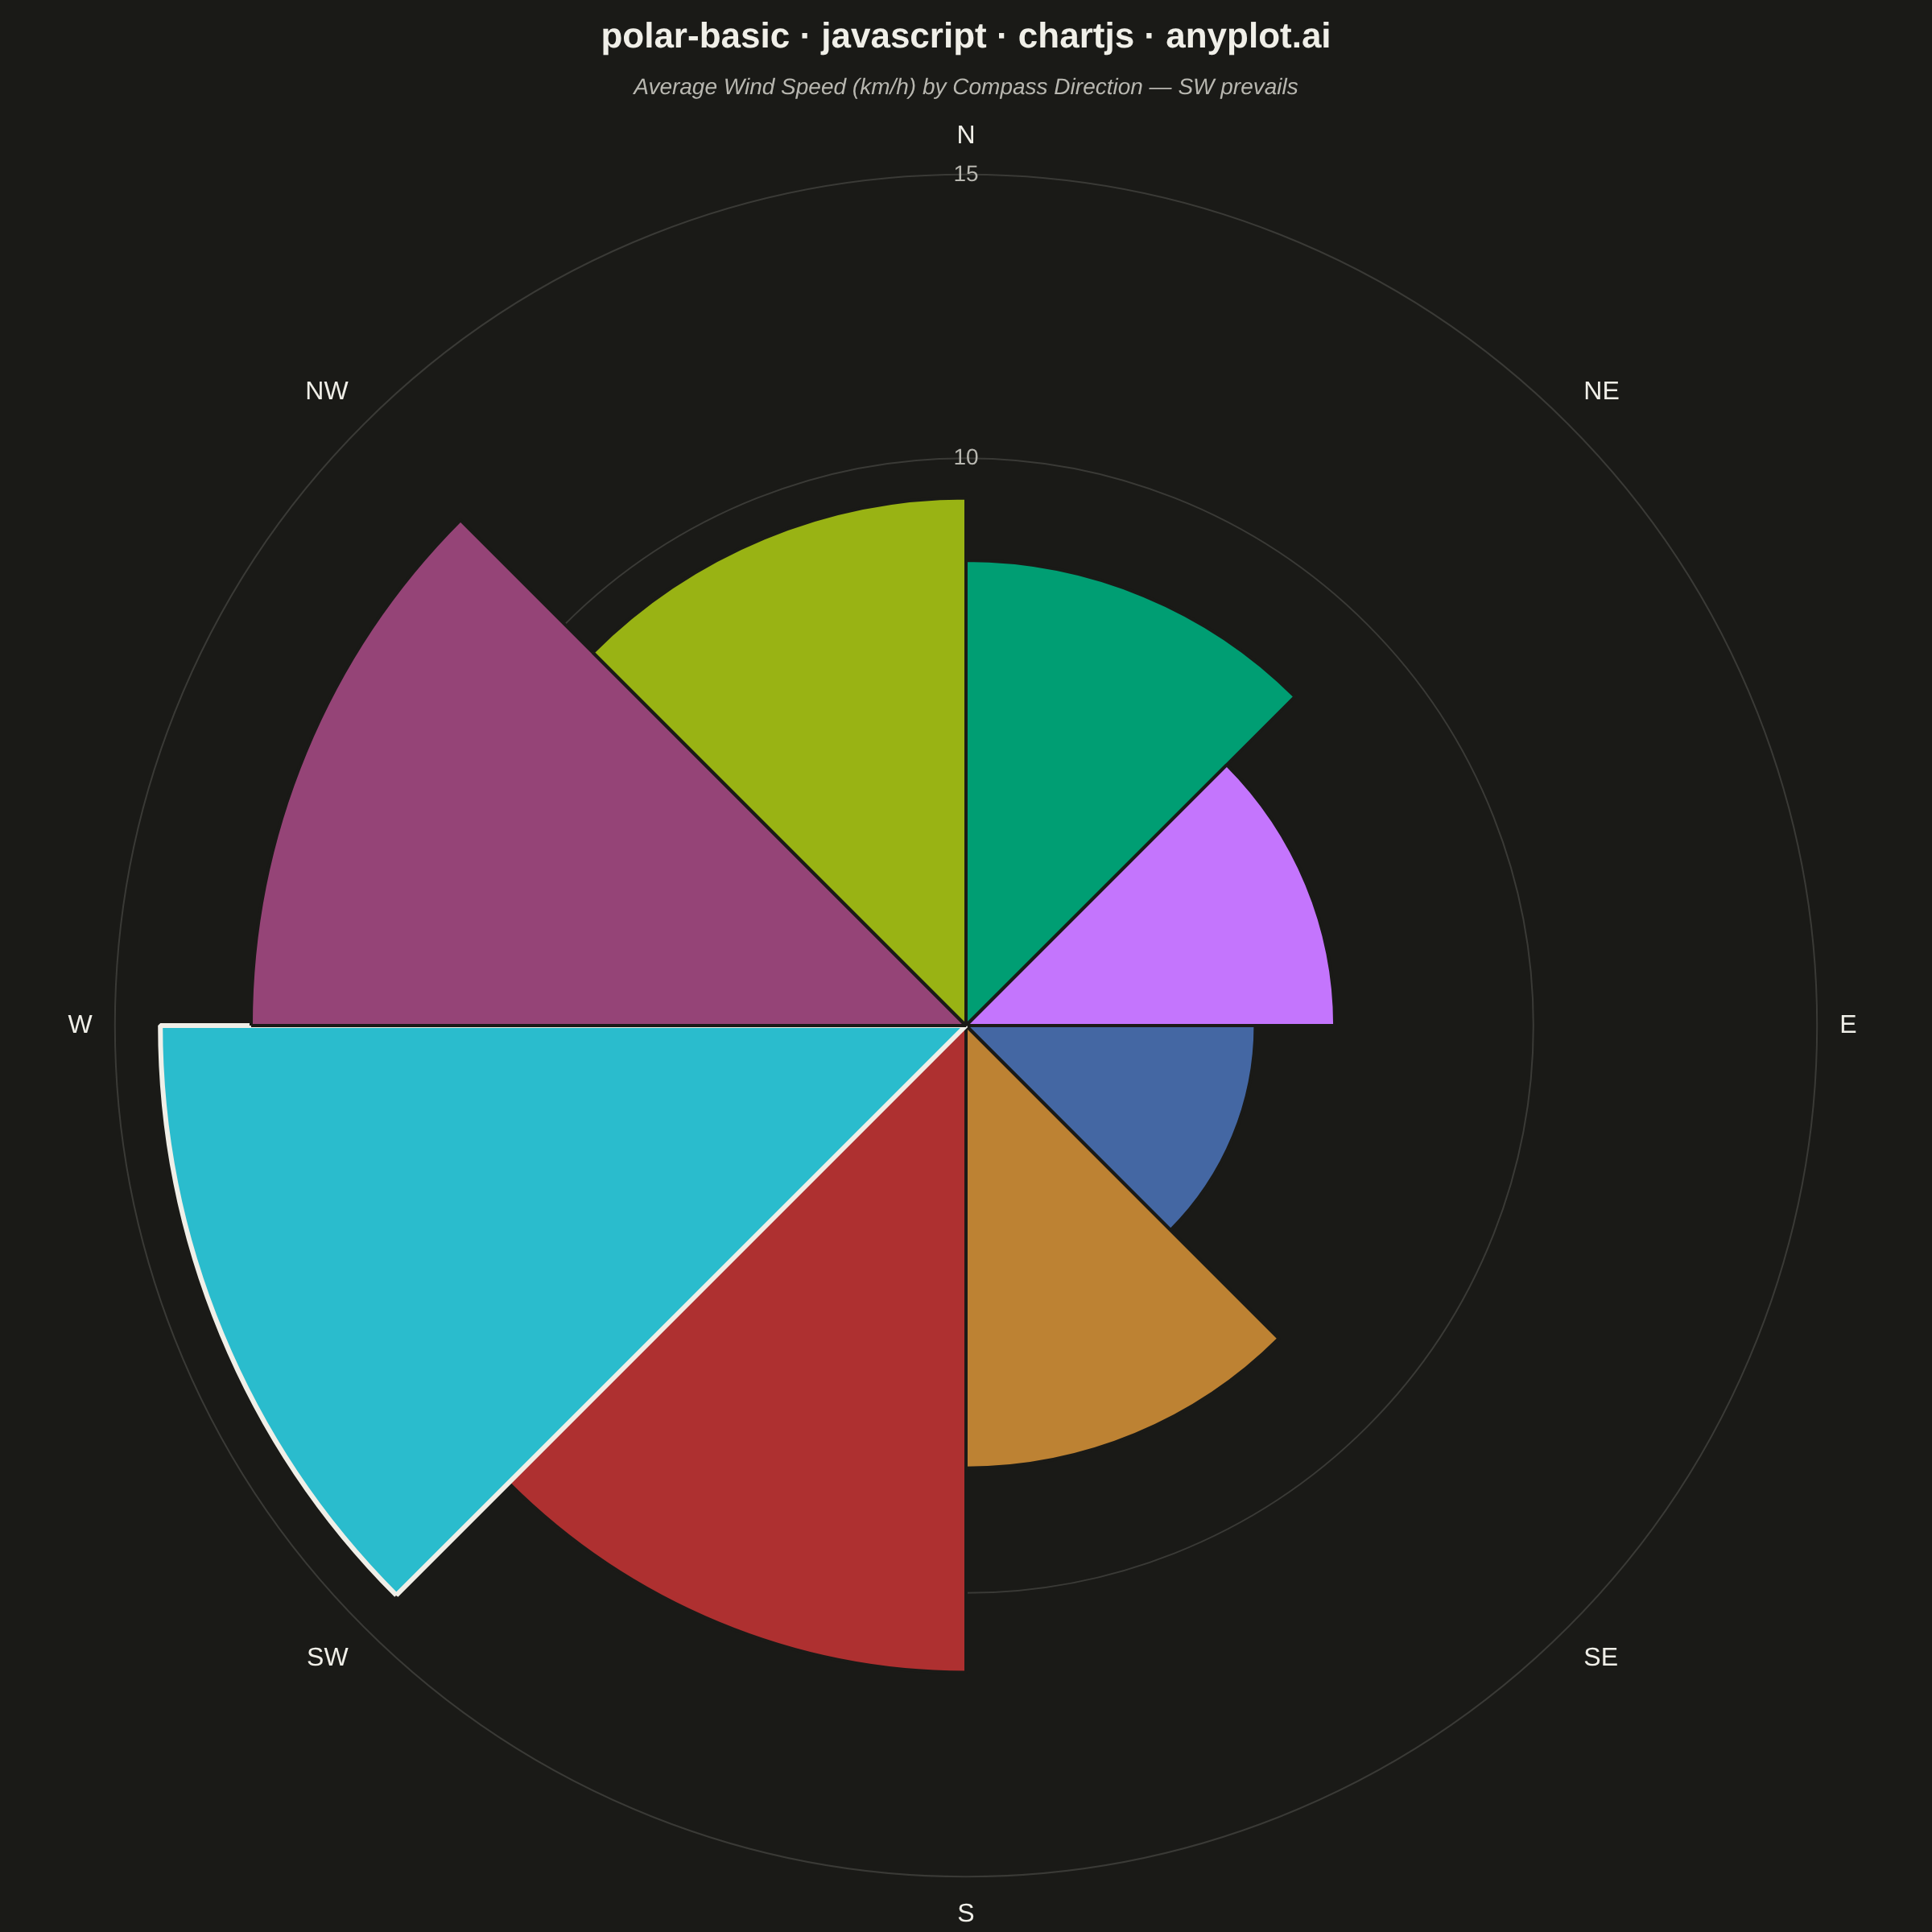
A polar chart displays data points on a circular coordinate system where position is determined by angle (theta) and distance from center (radius). This visualization is ideal for cyclical patterns, directional data, or any dataset where angular relationships are meaningful. It reveals periodic trends and directional distributions that would be obscured in Cartesian coordinates.
// anyplot.ai
// polar-basic: Basic Polar Chart
// Library: chartjs 4.4.7 | JavaScript 22.23.1
// Quality: 90/100 | Updated: 2026-07-25

//# anyplot-orientation: square
const t = window.ANYPLOT_TOKENS;

// --- Data (in-memory, deterministic): average wind speed by compass direction
const directions = ["N", "NE", "E", "SE", "S", "SW", "W", "NW"];
const windSpeeds = [8.2, 6.5, 5.1, 7.8, 11.4, 14.2, 12.6, 9.3];
const maxSpeed = Math.max(...windSpeeds);
const prevailingIndex = windSpeeds.indexOf(maxSpeed);

// --- Mount -----------------------------------------------------------------
const canvas = document.createElement("canvas");
document.getElementById("container").appendChild(canvas);

// --- Chart -----------------------------------------------------------------
new Chart(canvas, {
  type: "polarArea",
  data: {
    labels: directions,
    datasets: [
      {
        data: windSpeeds,
        backgroundColor: directions.map((_, i) => t.palette[i % t.palette.length]),
        borderColor: directions.map((_, i) => (i === prevailingIndex ? t.ink : t.pageBg)),
        borderWidth: directions.map((_, i) => (i === prevailingIndex ? 3 : 2)),
      },
    ],
  },
  options: {
    responsive: true,
    maintainAspectRatio: false,
    animation: false,
    plugins: {
      title: {
        display: true,
        text: "polar-basic · javascript · chartjs · anyplot.ai",
        color: t.ink,
        font: { size: 22, weight: "600" },
      },
      subtitle: {
        display: true,
        text: "Average Wind Speed (km/h) by Compass Direction — SW prevails",
        color: t.inkSoft,
        font: { size: 14, style: "italic" },
        padding: { bottom: 12 },
      },
      legend: { display: false },
    },
    scales: {
      r: {
        beginAtZero: true,
        max: 15,
        ticks: {
          color: t.inkSoft,
          backdropColor: "transparent",
          font: { size: 14 },
          stepSize: 5,
        },
        grid: { color: t.grid },
        angleLines: { color: t.grid },
        pointLabels: { display: true, color: t.ink, font: { size: 16 } },
      },
    },
  },
});
Runnable source as JSON, for any HTTP client: https://api.anyplot.ai/specs/polar-basic/chartjs/code. Any spec id and library id listed in llms-full.txt fit the same URL shape; every URL below is complete and callable.
{
  "spec_id": "polar-basic",
  "language": "javascript",
  "library": "chartjs",
  "page": "https://anyplot.ai/polar-basic/javascript/chartjs",
  "hub": "https://anyplot.ai/polar-basic",
  "code_json": "https://api.anyplot.ai/specs/polar-basic/chartjs/code",
  "spec_json": "https://api.anyplot.ai/specs/polar-basic",
  "render_light_png": "https://storage.googleapis.com/anyplot-images/plots/polar-basic/javascript/chartjs/plot-light.png",
  "render_dark_png": "https://storage.googleapis.com/anyplot-images/plots/polar-basic/javascript/chartjs/plot-dark.png",
  "interactive_light_html": "https://storage.googleapis.com/anyplot-images/plots/polar-basic/javascript/chartjs/plot-light.html",
  "interactive_dark_html": "https://storage.googleapis.com/anyplot-images/plots/polar-basic/javascript/chartjs/plot-dark.html",
  "quality_score": 90.0,
  "license": "MIT",
  "guide": "https://anyplot.ai/llms.txt"
}
Part of Basic Polar Chart on anyplot.ai.